ABC News yesterday told us about the dangerous flash flooding, mud slides and excessive rains coming to California during their 5:30 pm Nightly news.
How it was coming from another Atmospheric River and really bad news.
I checked numerous other sources stating the same thing, that this is from an "Atmospheric River". In fact, dozens of stories, maybe even the majority!
THEY ARE WRONG!
https://apnews.com/article/california-atmospheric-river-df7cbc46aed08132794effc7c42f0853
LOS ANGELES (AP) — An unusually strong storm system called an atmospheric river was dousing Southern California on Saturday, prompting flood warnings in areas of coastal Los Angeles County that recently were ravaged by wildfire.
The long plume of tropical moisture that formed over the Pacific Ocean began drenching the San Francisco Bay Area on Wednesday and unleashed widespread rain over Southern California on Friday and Saturday. More than a foot of snow was predicted for parts of the Sierra Nevada.
+++++++++++++++++++
This is what an atmospheric river is:
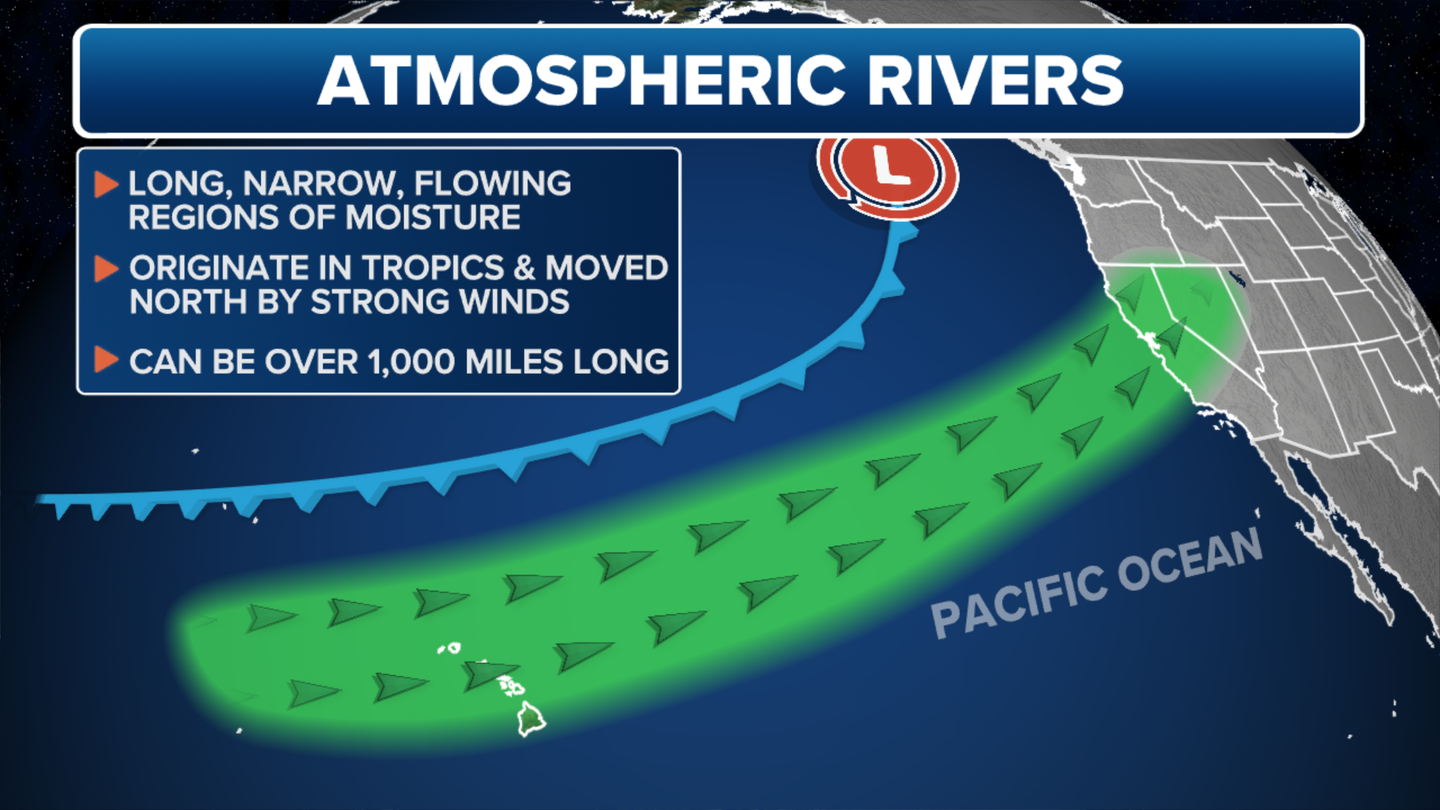
+++++++++++
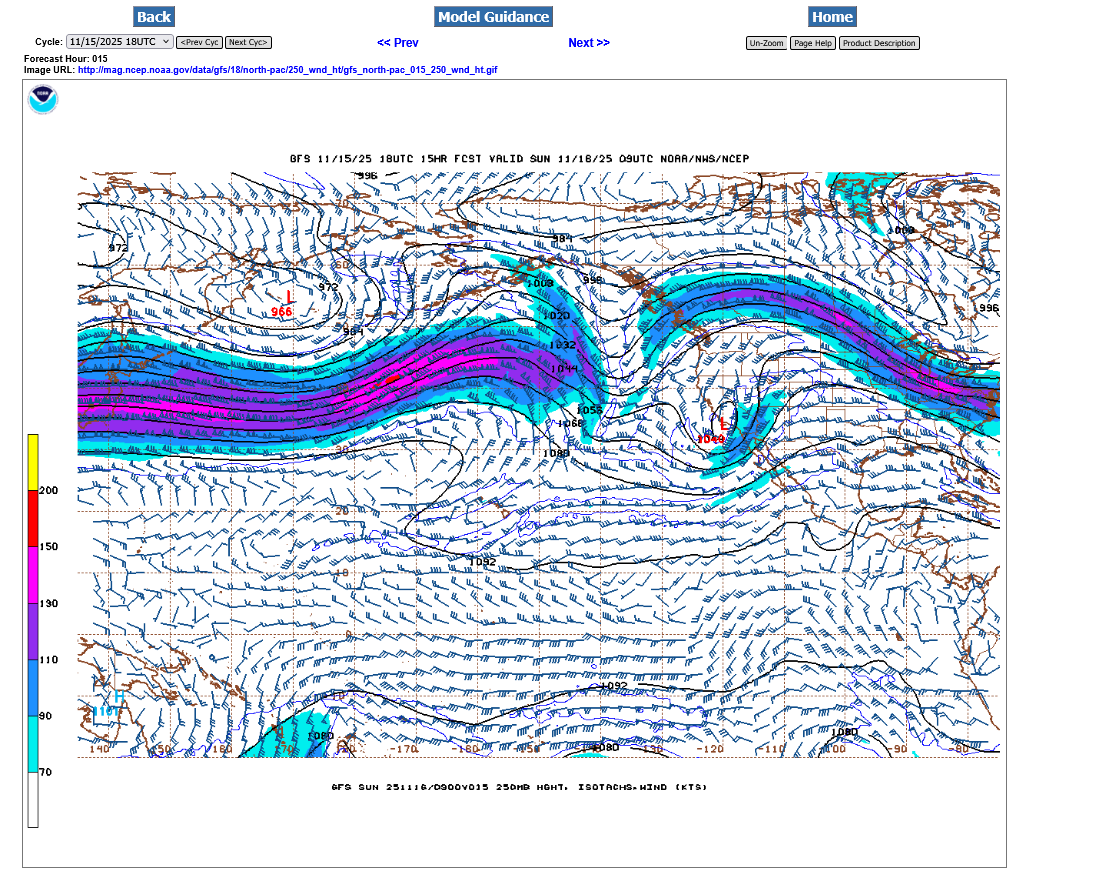
This is the current jet stream:
There is a cut off low along the California coast with a NON Atmospheric river, small jet stream from southwest to northeast circulating around the base.
The main jet stream is far to the north and having no impact on California's wonderful rains this week.
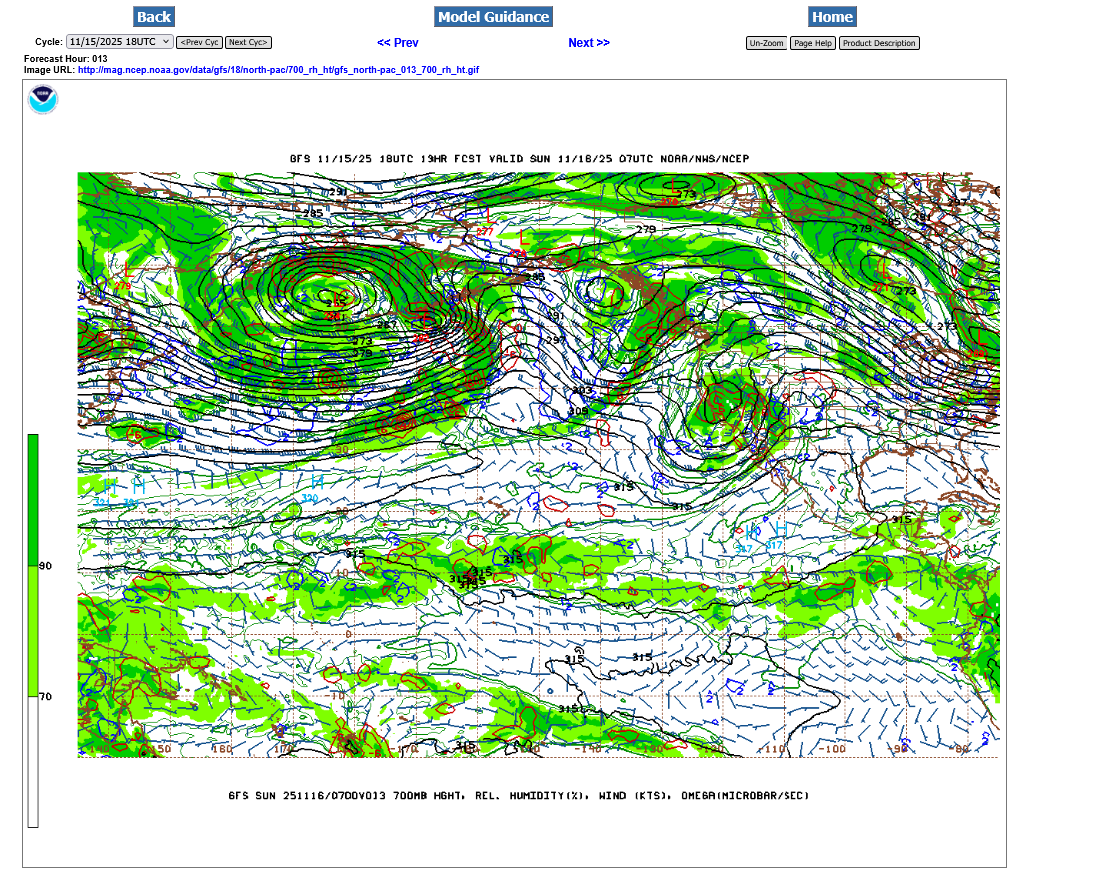
Below: Moisture/relative humidity at 700 mb. With an atmospheric river, we would see a long trail of green in the Pacific aimed at the coast. It would be associated with the pattern at the top, which would feature a strong and long jet stream aimed at California. This is NOT such a pattern, where a 1,000 mile long plume of moisture is tracking out of the Pacific on the power of a strong jet stream aimed at California.
Instead, we have a CUTOFF LOW which because it is CUT OFF from the main jet stream its moving extraordinarily slow. With an atmospheric river, a system like this would be tracking thru FAST, not lasting for numerous days.
There often are numerous, individual perturbations in an atmospheric river but that is NOT what is happening this time.
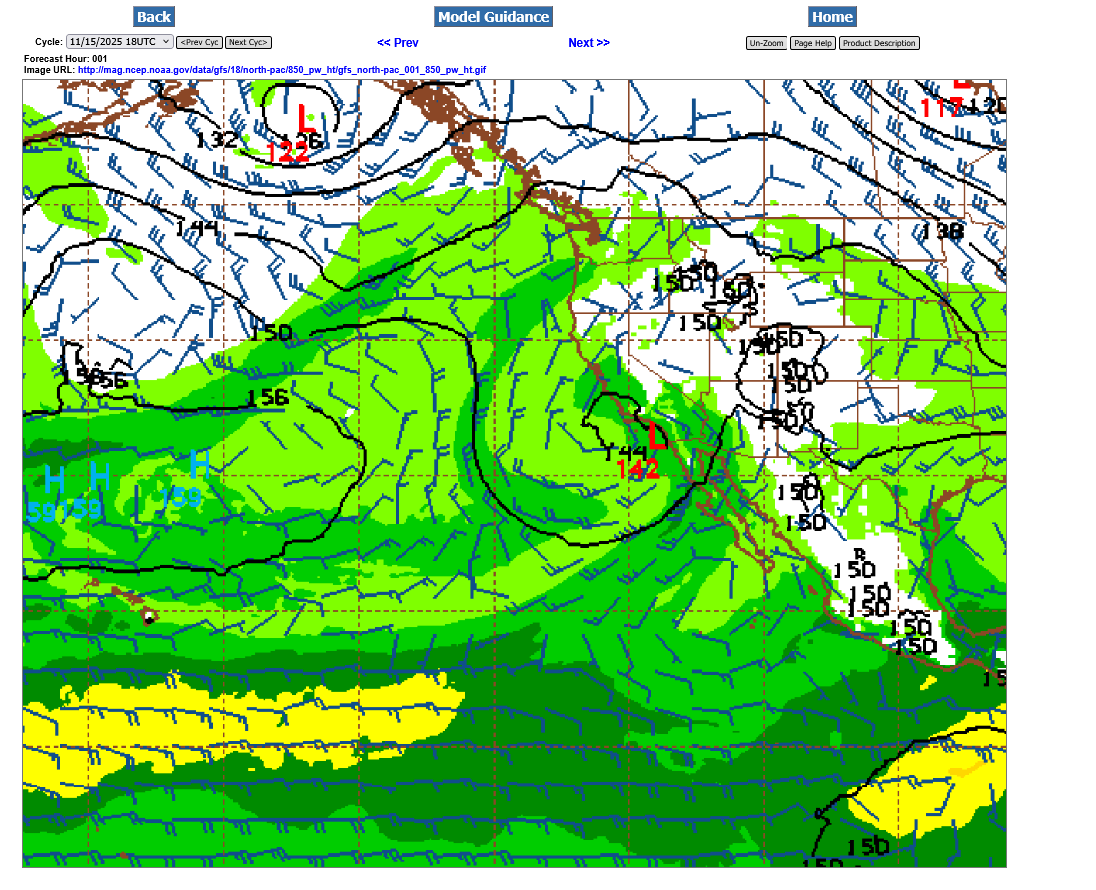
Here is the 850 mb precipitable water map, zoomed in to California, where we can see the CUTOFF LOW. The yellows are the areas with the highest moisture content of the atmosphere. If this was an atmospheric river, there would be a yellow stream aimed at California surrounded by the darkest green. Instead we have lighter shades of green flowing into California because this is NOT an atmospheric river!
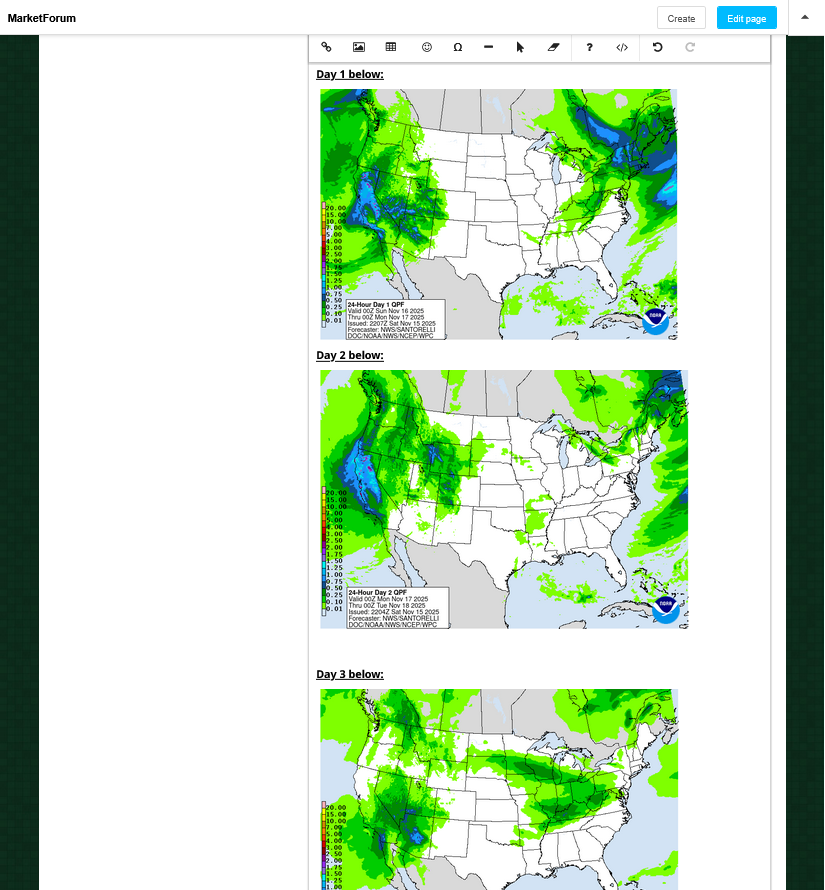
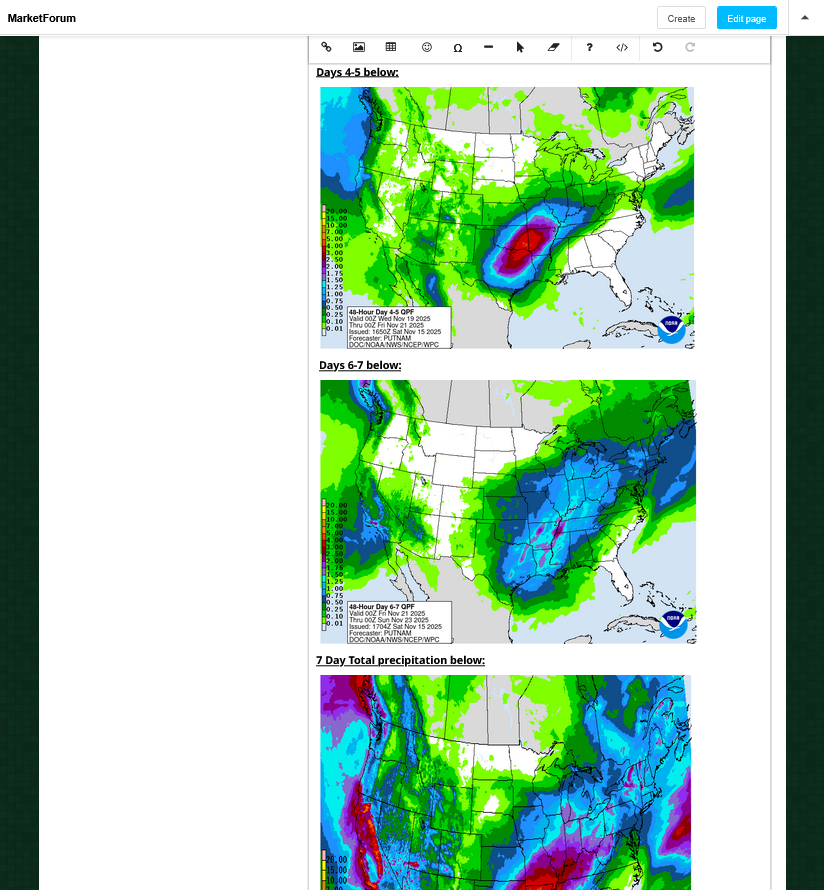
This is the forecast for the next week:
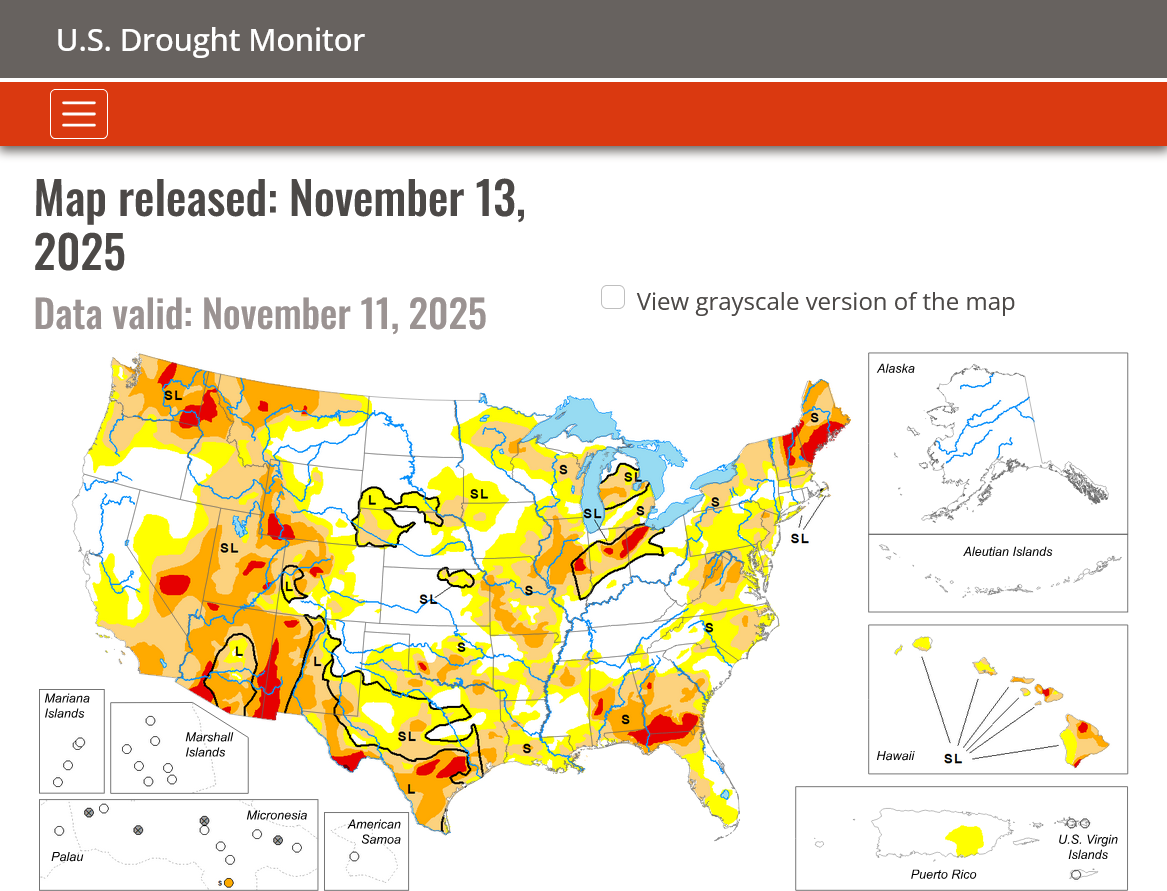
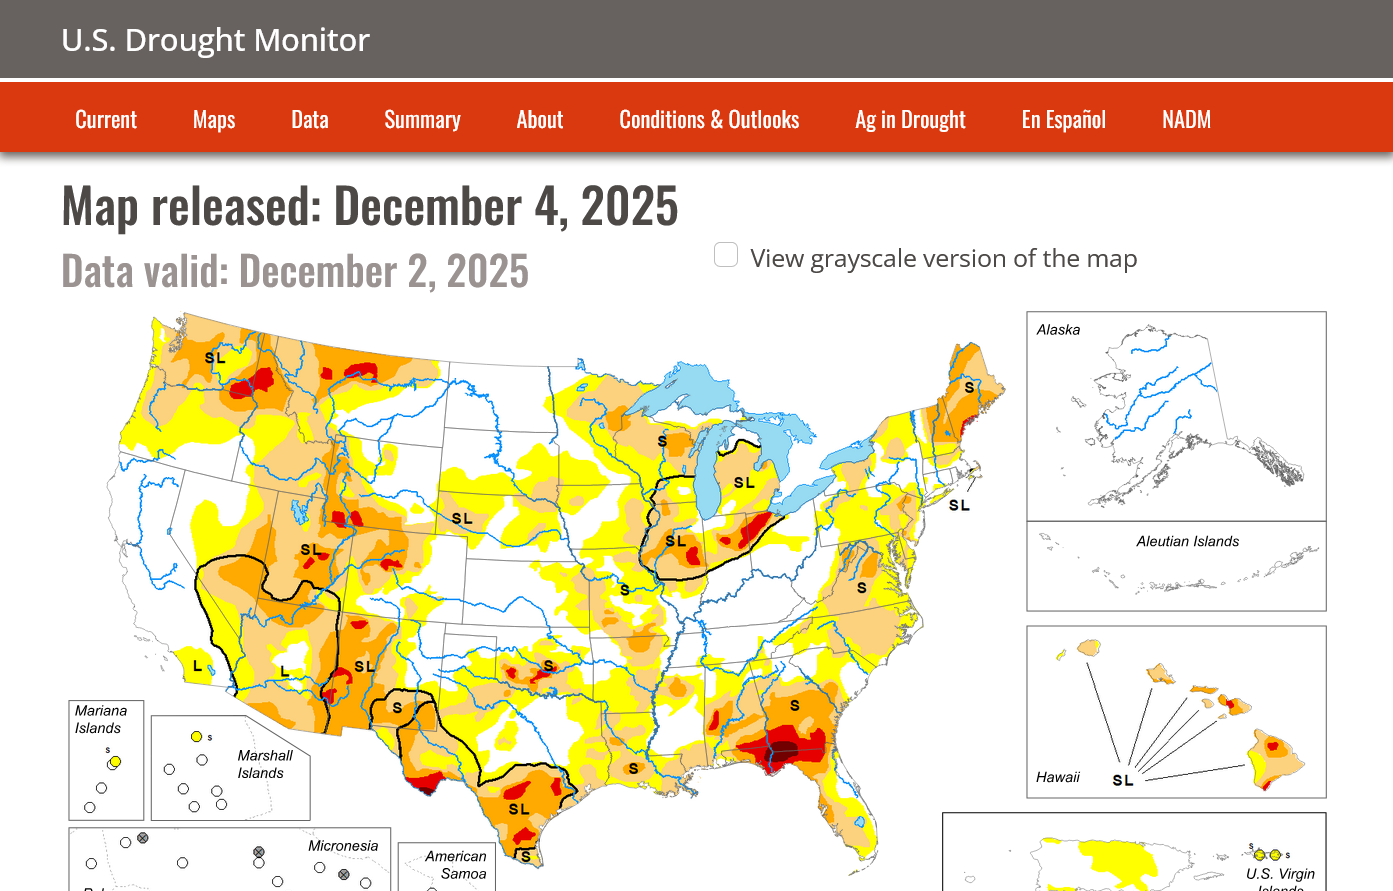
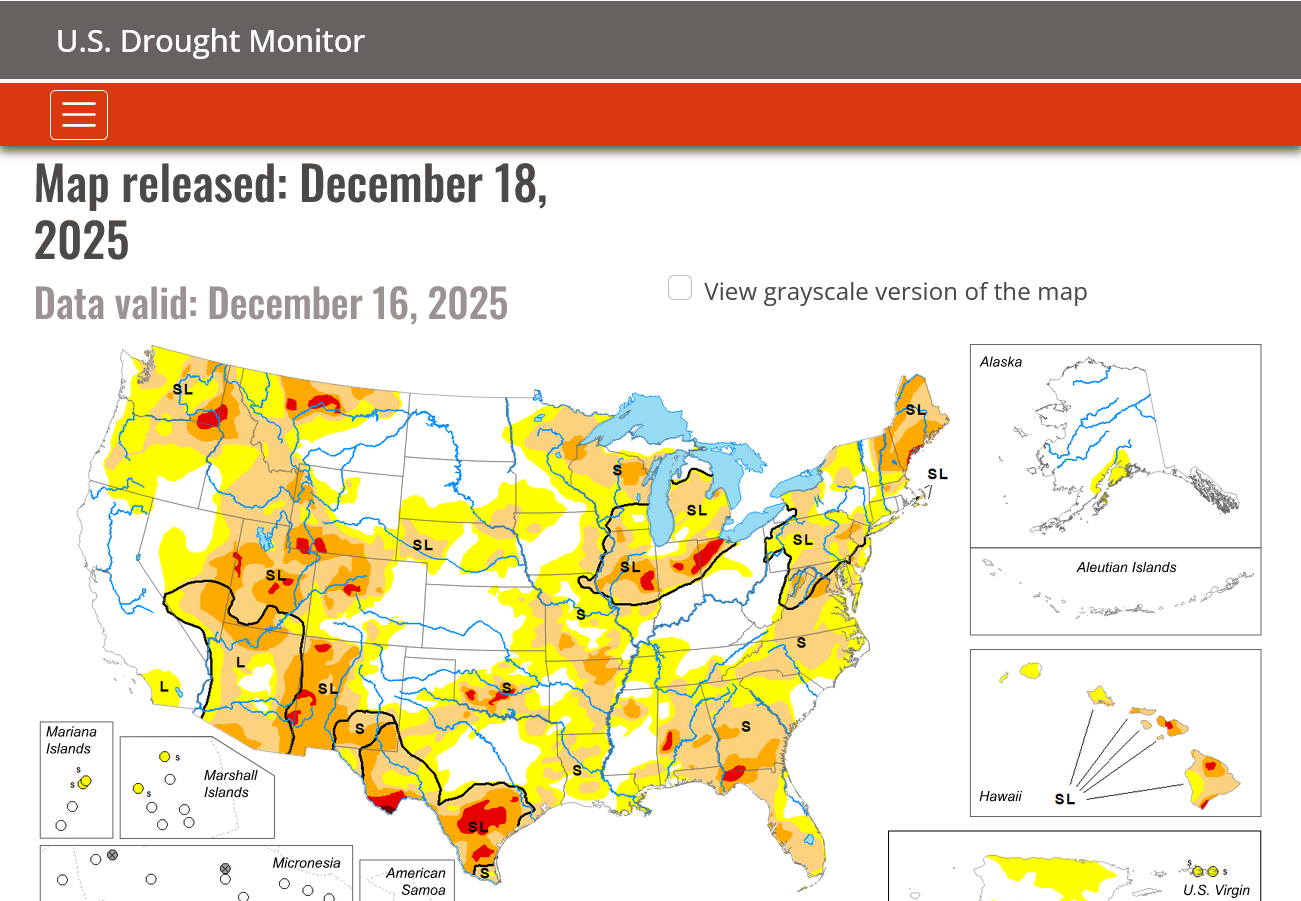
Here's the last Drought Monitor map with recent rains greatly improving soil moisture already:
Drought monitor 2 months ago(with typical late Summer/dry season drought).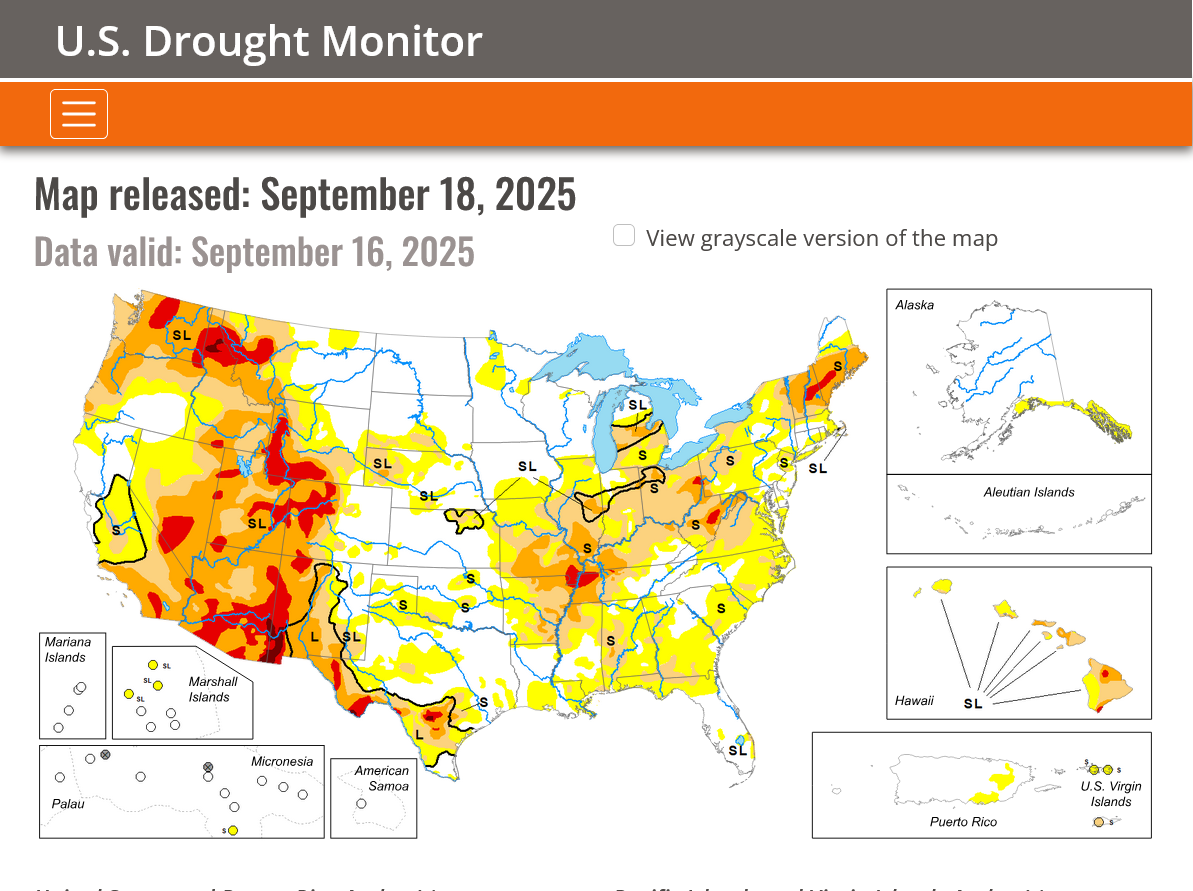
1. California gets the vast majority of rains from November- March. This is the time to get rains or they won't get any rains.
2. Show me a Winter where we don't have rains of, at least this intensity and I'll show you a year where the drought get's worse.
3. This is a mega wonderful rain event with numerous events spread out over a week because of a nearly stalled cuttoff low and most of them NOT excessive.
4. The lack of an atmospheric river with its tropical moisture gushing in from a powerful jet stream but instead, this cutoff low is one of the best set ups for soaking rains that California will ever see.
5. This drought prone area currently is abnormally dry to severe drought(typical headed into the rainy season). These rains are currently helping to recharge soil moisture for the next growing season. Filling up water storage. Dumping snow in the mountains that will melt next Spring/Summer and provide water to the area.
6. I have not seen 1 article that tells it like that!!!! They greatly exaggerate the negatives with some blaming it on the climate crisis. This is NOT the type of event that would be caused by a slightly warmer ocean in the tropical Pacific. In fact, we have a NATURAL La Nina right now which is COOL water anomalies compared to average.
Just 3 months ago(during the dry season), many of these same sources were telling us about how rains so far in 2025 were so low and bad.
https://www.sfgate.com/weather/article/southern-california-rainfall-totals-20802045.php
+++++++++++++++
According to the media and fake climate crisis sources: When its too dry, including dry in the Summer which ALWAYS HAPPENS...it's a disaster.
When the rain returns early and comes as a wonderful, long lived soil soaking, reservoir filling event..........that's bad news too according to them now.
Until these recent rains hit, look how dry it had been in this location:
Re: Re: Re: Re: Re: Weather May 2022

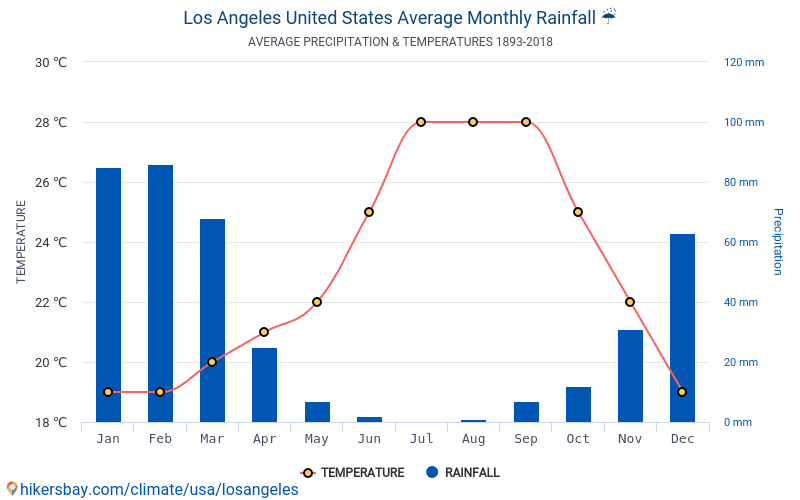
We have just started the 2025/2026 rainy season and its off to a blockbuster, great beginning!!!!
https://www.weather-guide.com/city-weather/Los-Angeles-weather.html
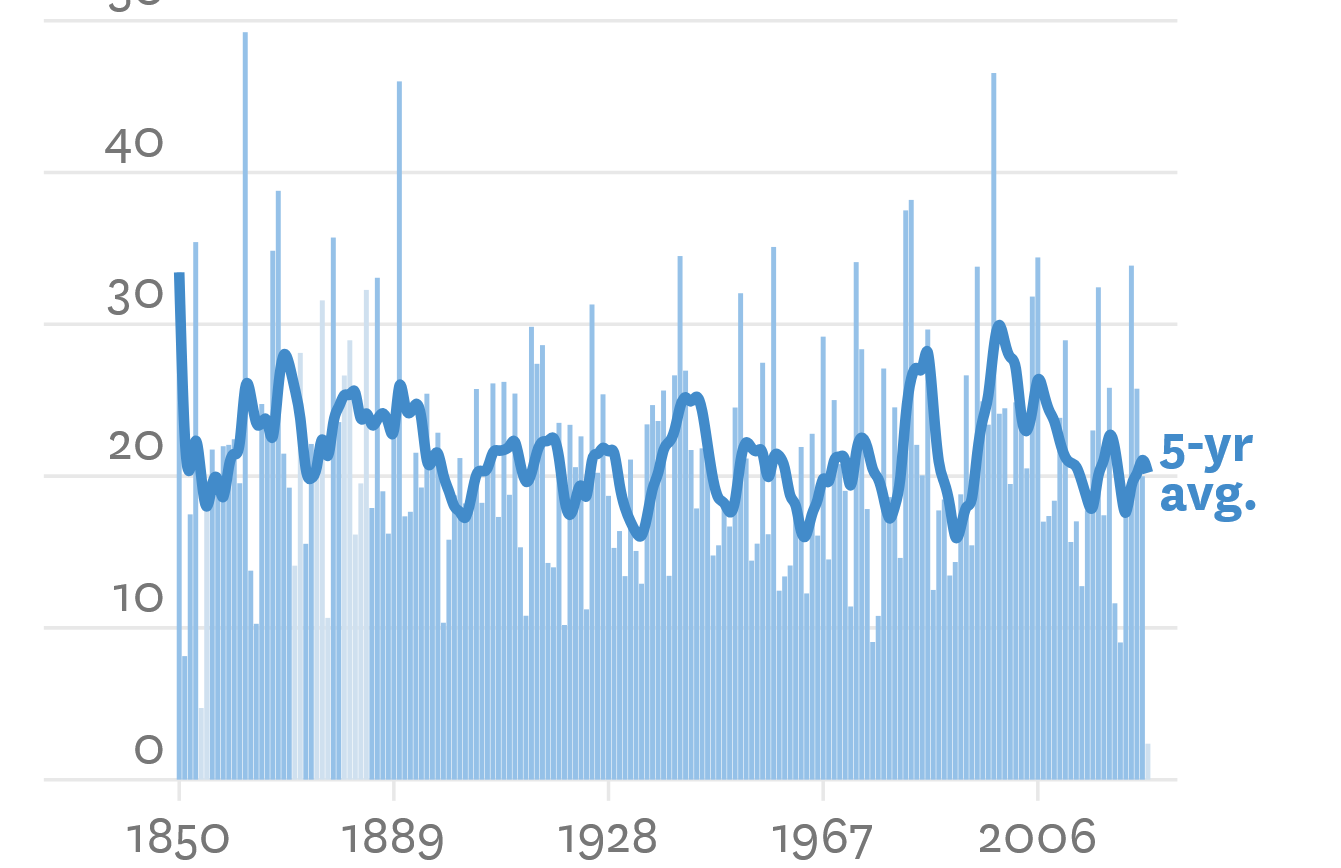
Let's take a look farther north to San Francisco to see how the fake climate crisis is impacting rainfall the past 175 years.
Can't see the impact with more extreme events, more rains or less rains????
That's because THERE HASN'T BEEN ANY!!!
Re: Re: Re: Re: Re: Death by GREENING!
By metmike - Feb. 2, 2025, 7:54 a.m.
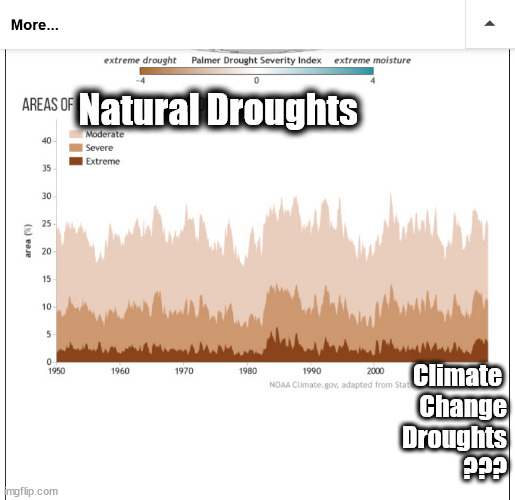
Here's a perfect example of why they get it so wrong using the global drought graph from below. Please tell me where on this graph below, that the climate change droughts are and where the natural droughts are since the year 2000? Impossible because the pattern is THE EXACT SAME! The MSM, in 2025 tells us that EVERY drought is now caused by climate change to the point that they use the terms interchangeably.
https://www.climate.gov/news-features/featured-images/2017-state-climate-global-drought
+++++++++++++++++++++++
Global cooling and LOW CO2 levels are what cause widespread, extremely long lasting droughts with catastrophic global and huge regional famines!
Here in 2025, we are living in a climate optimum with absolute, scientific certainty!!
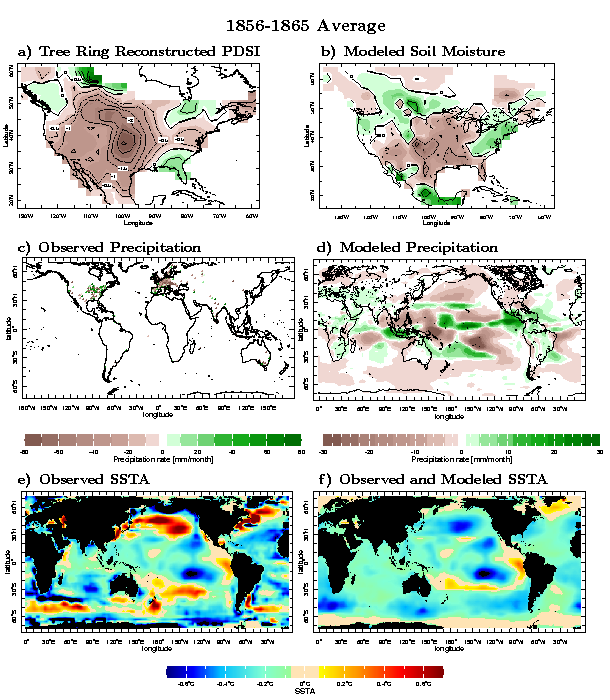
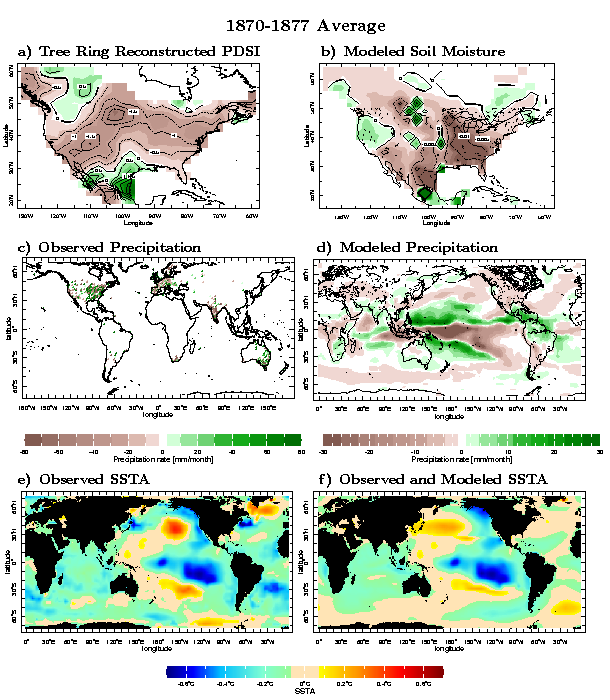
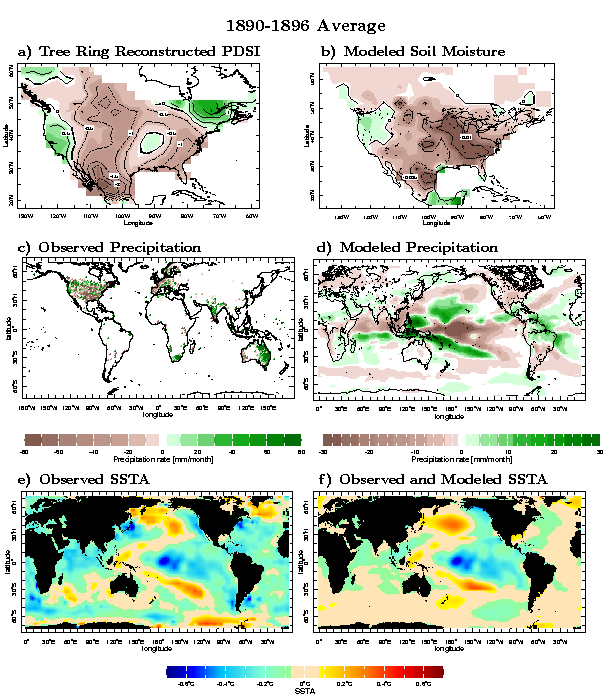
Causes and consequences of nineteenth century droughts in North America
https://ocp.ldeo.columbia.edu/res/div/ocp/drought/nineteenth.shtml
++++++++++++++++++++++++++++++++++++++++++++
You want a REAL climate CRISIS?
This is what it looks like:
Can you imagine if this below happened today? It's less likely because climate change and the current climate OPTIMUM is helping to PROTECT US!
The planet had a REAL climate crisis between 1876 and 1878.
50 million people died. 3% of the global population died from that real climate crisis!
https://news.climate.columbia.edu/2017/12/15/causes-great-famine-drought/

https://ui.adsabs.harvard.edu/abs/2017AGUFMGC51F..04S/abstract
The 1876-1878 Great Famine impacted multiple regions across the globe including parts of Asia, Nordeste Brazil, and northern and southern Africa, with total human fatalities exceeding 50 million people, arguably the worst environmental disaster to befall humanity.
NASA EXPLAINS THE DUST BOWL DROUGHT
https://www.nasa.gov/centers/goddard/news/topstory/2004/0319dustbowl.html
++++++++++++++++++
Climate change in the United States, with 100% certainty is helping to protect us from widespread severe droughts.
Summer Climate Change in the Midwest and Great Plains due to Agricultural Development during the Twentieth Century
https://journals.ametsoc.org/view/journals/clim/32/17/jcli-d-19-0096.1.xml

++++++++++++++++++++++++++++++++++++++++++++++++++++

We are indisputably living in a climate optimum for most life on this planet(that would still prefer a bit more warmth and a lot more CO2) and for growing crops in the United States!
Eric explains why this pattern in California is from CUTOFF LOWS bringing wonderful rains and not from an atmospheric river, strong jet stream:
https://www.youtube.com/watch?v=pAVS9TSMQM8
Thanks, Eric!
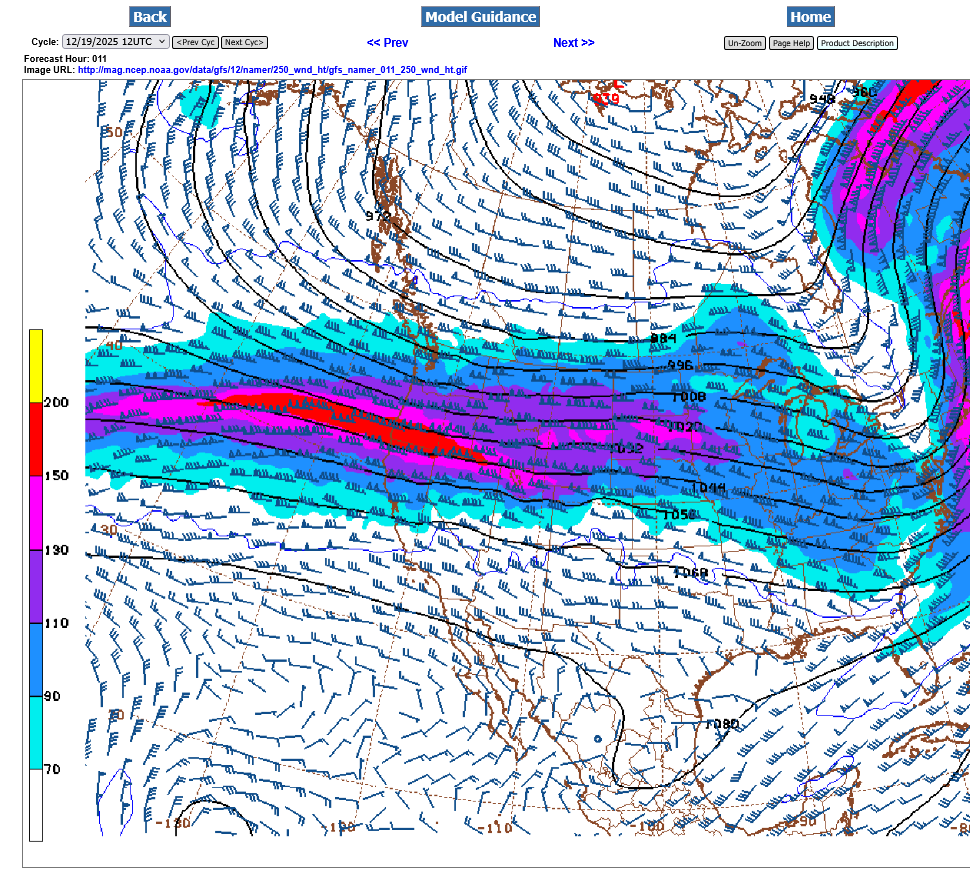
Now this is an Atmospheric River. 200 mph!!
250 mb at 34,000+ feet!
https://weather.com/forecast/regional/news/2025-12-07-atmospheric-river-pacific-northwest-rain-snow
+++++++++++++++=
The forecast below is updated constantly because i didn't do a freeze frame.
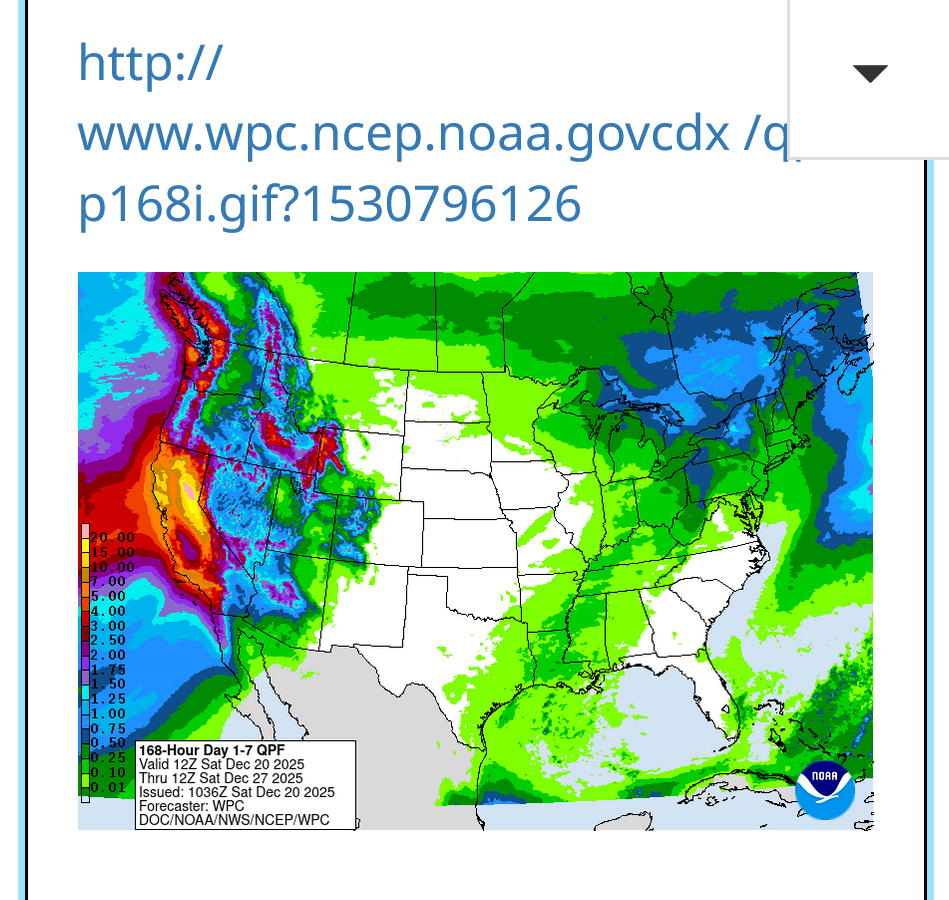
10 inches total rains added up this week in some spots.
7 Day Total precipitation below:
http://www.wpc.ncep.noaa.govcdx /qpf/p168i.gif?1530796126

That area in the Northwest actually needed precip, just not this much so quickly. However, their precip, like at most places doesn't come an inch/week which would be perfect.
The average precip everywhere, includes some long dry spells and some excessive events. That's NORMAL weather!
It would be unprecedented for any place get 1 inch/week for the entire year.
Or to have the 52 weeks precipitation pattern feature, equally distributed by the same amount every week for the entire period.
Warming the atmosphere and oceans by 1 deg. C, increases the potential for amounts to be 7% higher. So 10.0 inches of rain might be 10.7 inches of rain.
At the same time, a warmer planet does not cause more drought. Higher CO2 levels, are massively greening up the planet, while making plants more water efficient(drought tolerant) during the current climate OPTIMUM on our planet.
This is based on all the authentic science from this atmospheric scientist.........who is also an environmentalist that fights against wasting natural resources and fights REAL pollution.
DROUGHT MONITOR
https://droughtmonitor.unl.edu/
The Pacific Northwest has been getting bombarded with storms recently!
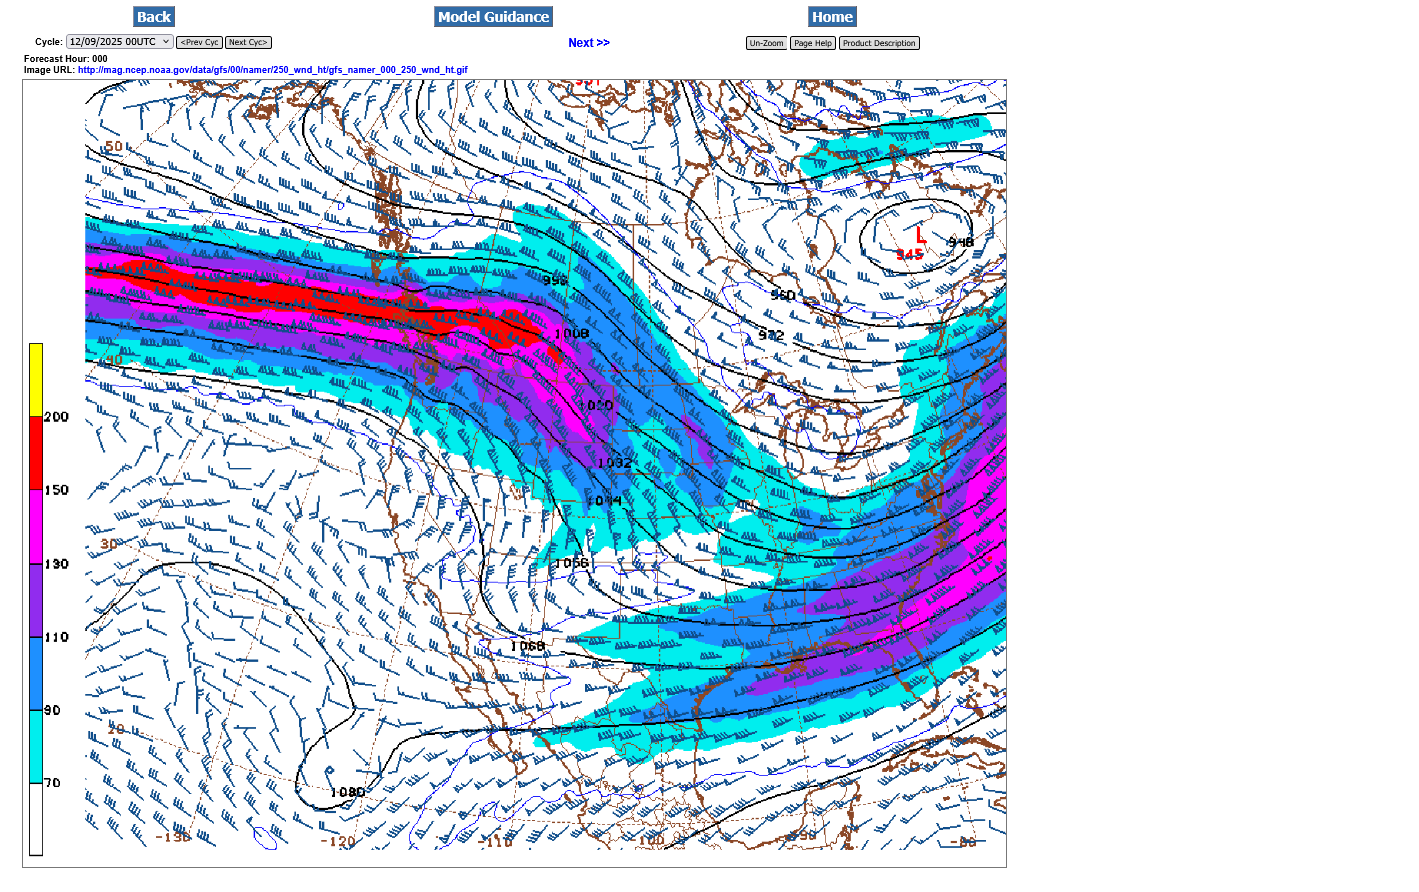
This is the last in the serious of atmospheric rivers hitting right now. This is the 250 mb level which is around 34,000 feet above the ground.
The red colors(in knots) are a 200+ mph jet streak embedded within the jet stream(atmospheric river).
https://www.theweatherprediction.com/habyhints/100/
https://www.theweatherprediction.com/habyhints/159/
This pattern is exactly the same reason that the Midwest and East have seen such a massive warm up quickly this week with mild, Pacific, oceanic air masses blowing west to east across the country and dislodging the frigid Arctic air that was deeply entrenched last weekend!
Huge warm up this week!
Started by metmike - Dec. 13, 2025, 9:25 p.m.
https://www.marketforum.com/forum/topic/116566/
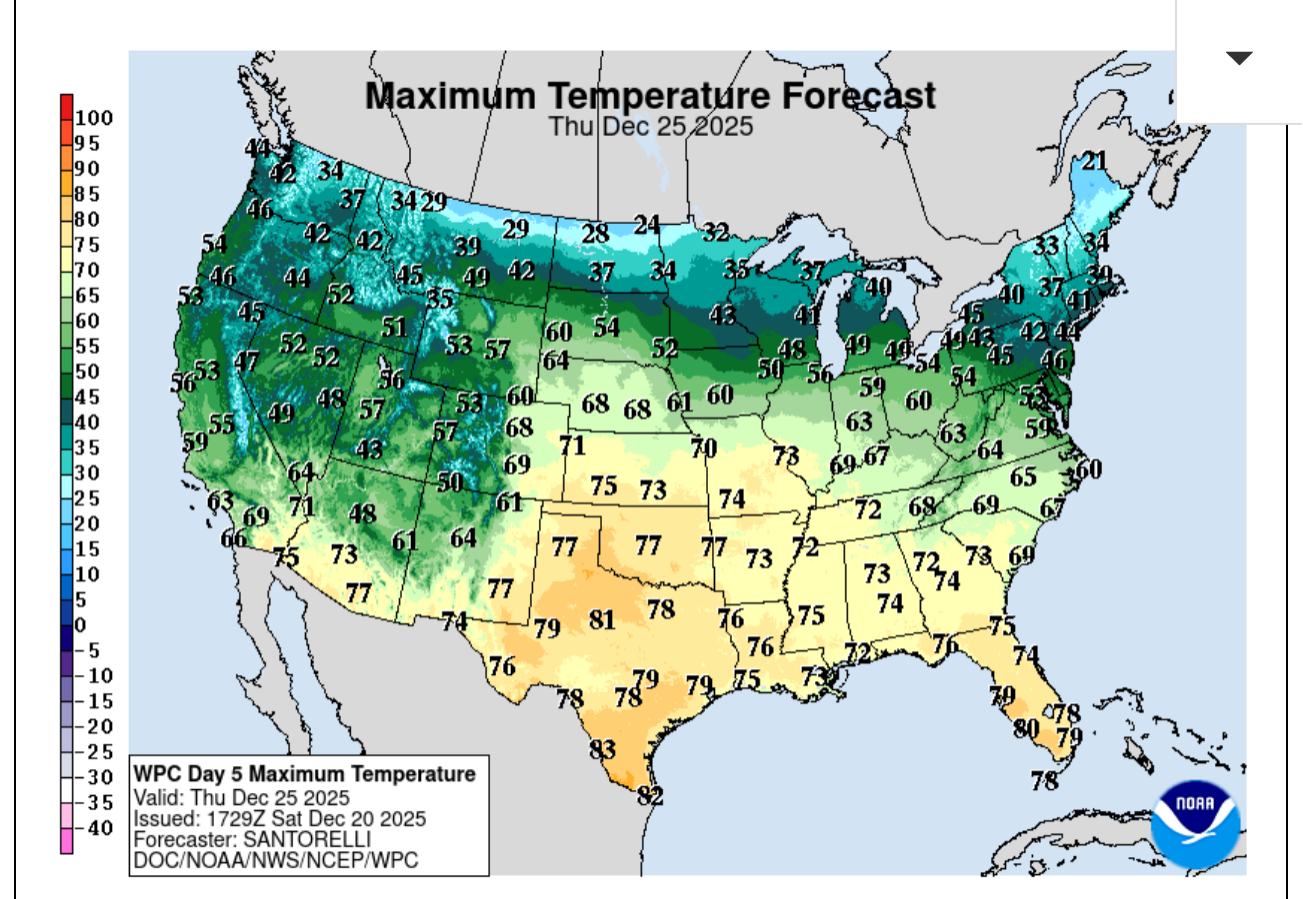
By metmike - Dec. 17, 2025, 7:29 p.m.
These were the temperatures 3 days ago:
Sunday morning wind chills at 8am CST 12-14-25:
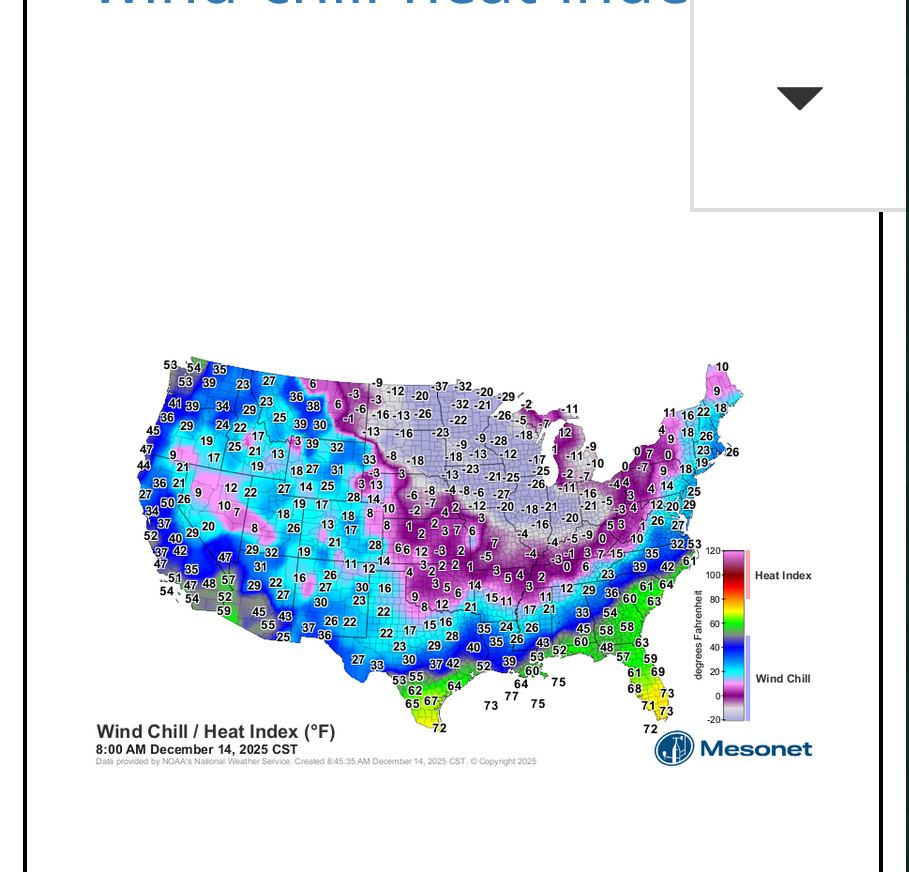
Look how much warmer the early evening temperatures are here on Wednesday, 12-17-25 compared to the map above!!! There are places, like the N.Plains where it feels 60+ degrees warmer right now!!!!
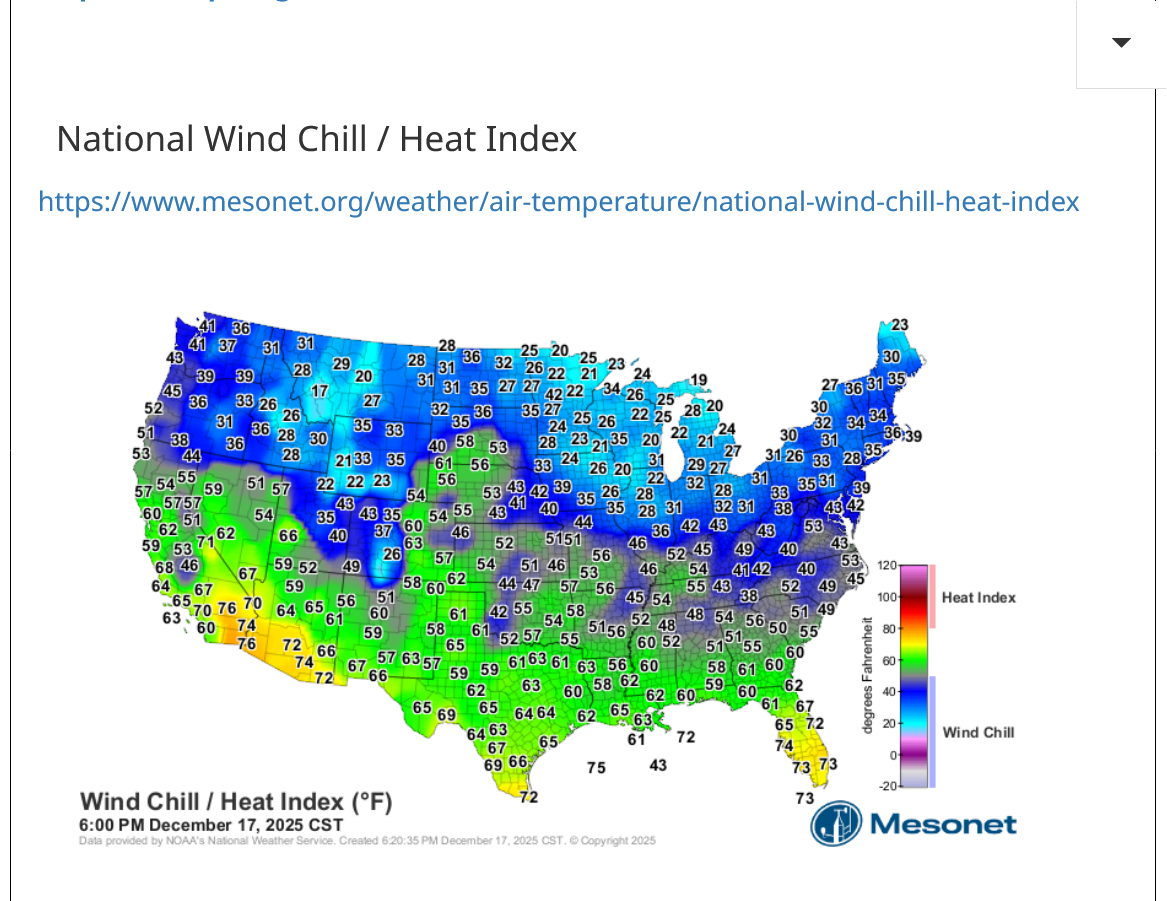
Go here for the latest map:
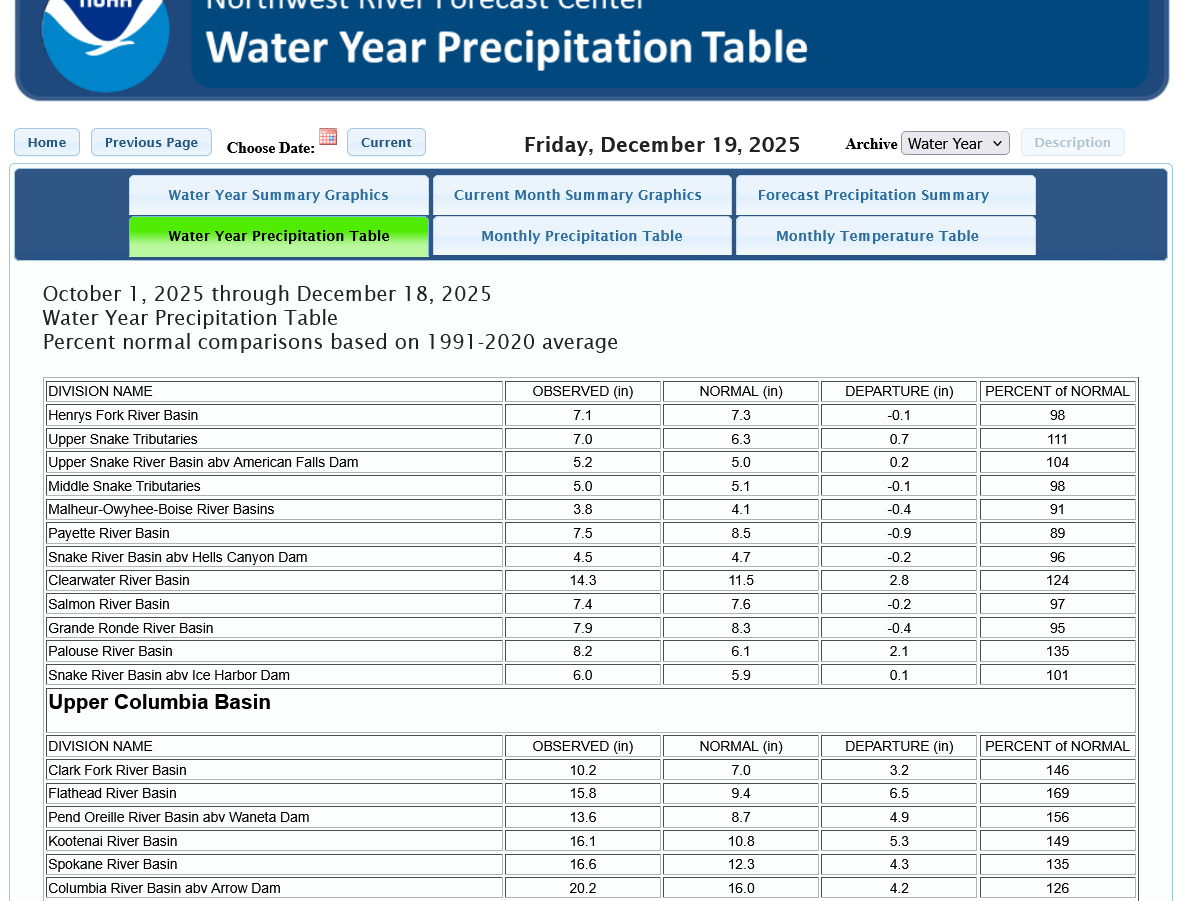
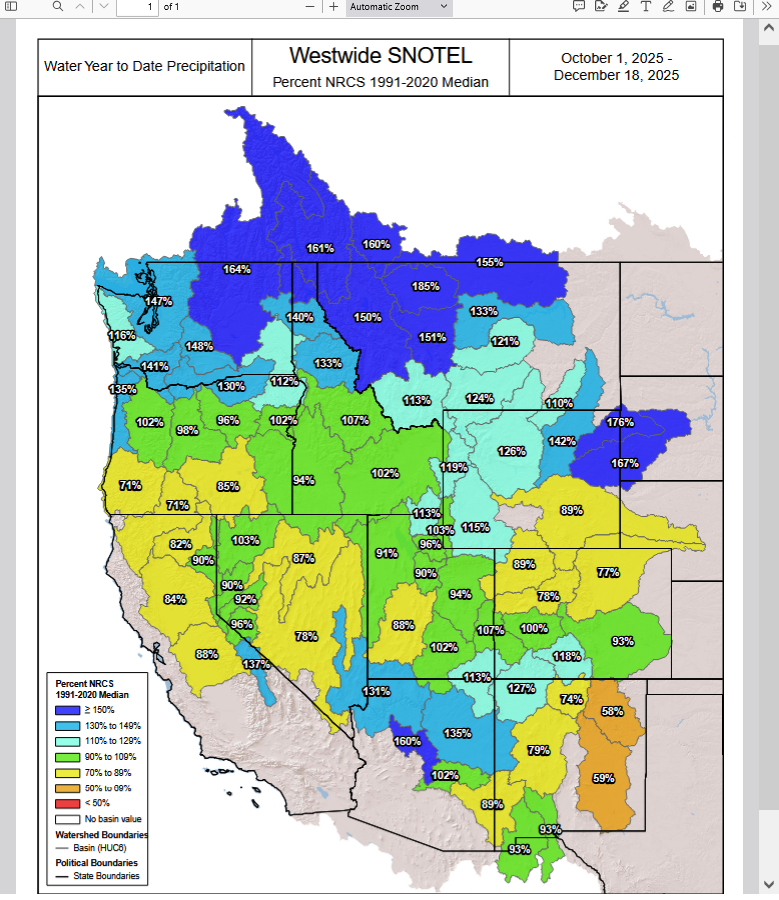
These are the rain/temp stats from the Pacific Northwest:
https://www.nwrfc.noaa.gov/water_supply/wy_summary/wy_summary.php?tab=2
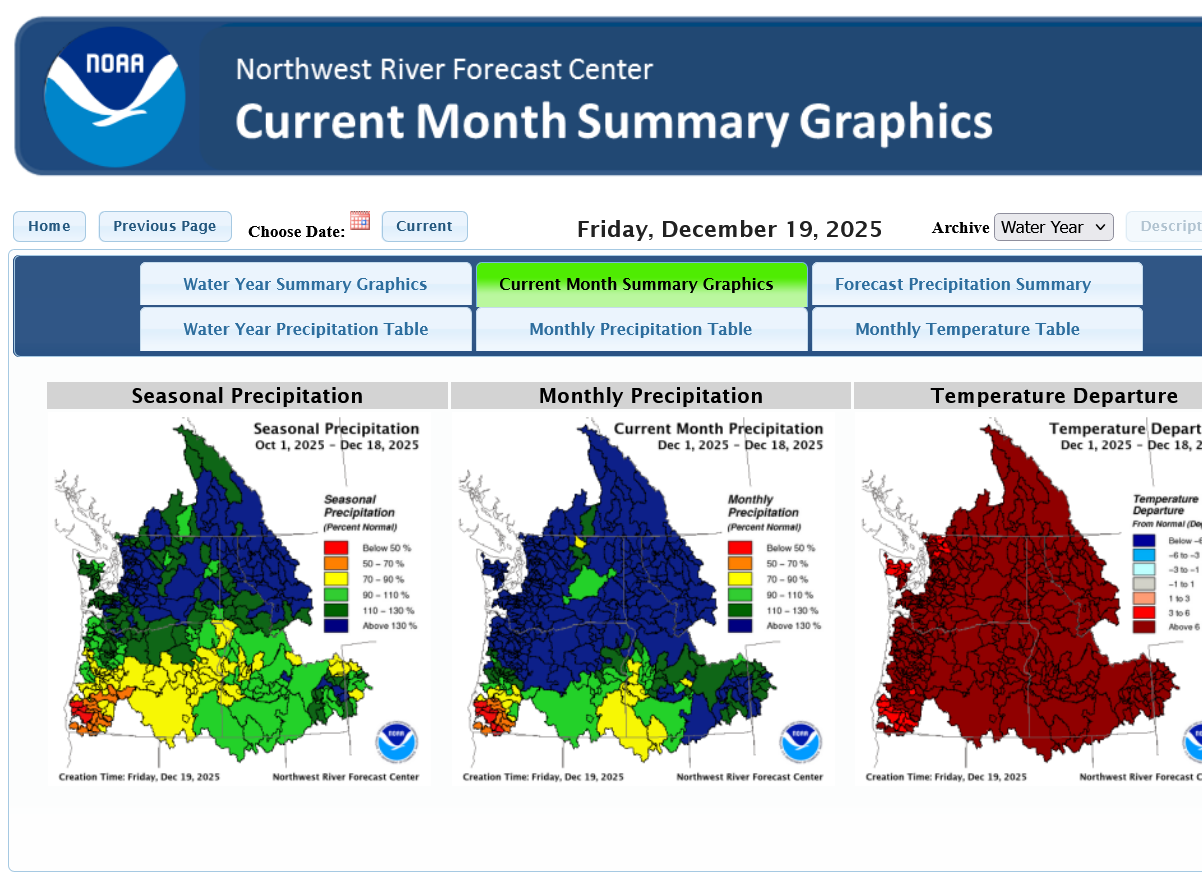
https://www.nwrfc.noaa.gov/water_supply/wy_summary/wy_summary.php?tab=1
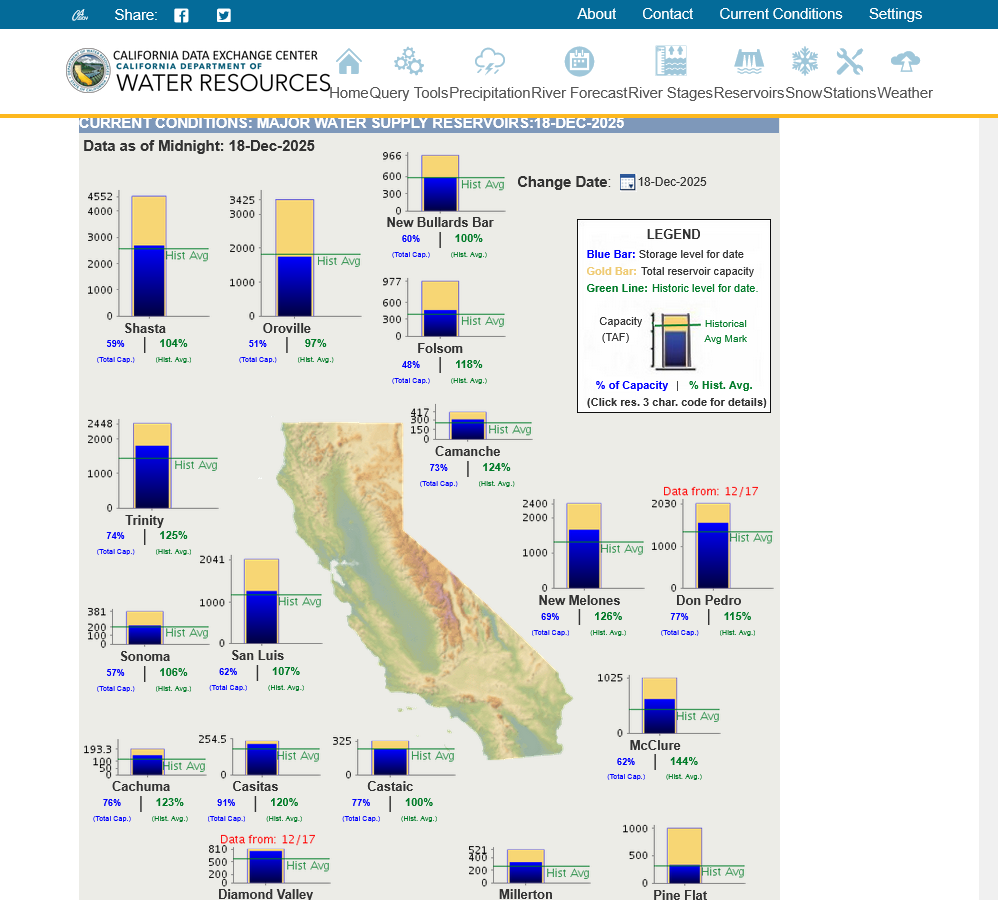
Reservoirs out West.
I'm looking for the comparable information for OR and WA right now but the state of CA is in great shape for this time of year, still needing more rains.........and they are coming.
https://cdec.water.ca.gov/resapp/RescondMain
The atmospheric river with warm humid air has resulted in very little high elevation snows because the air aloft has been too warm.
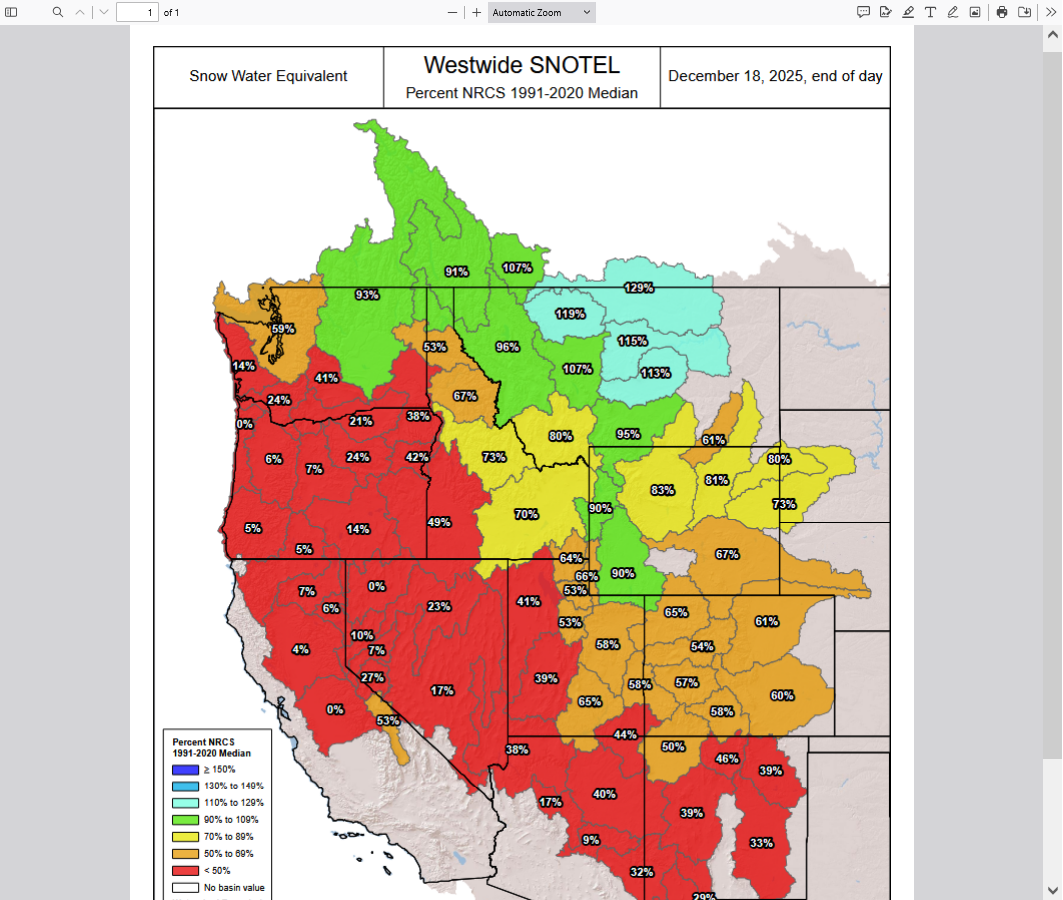
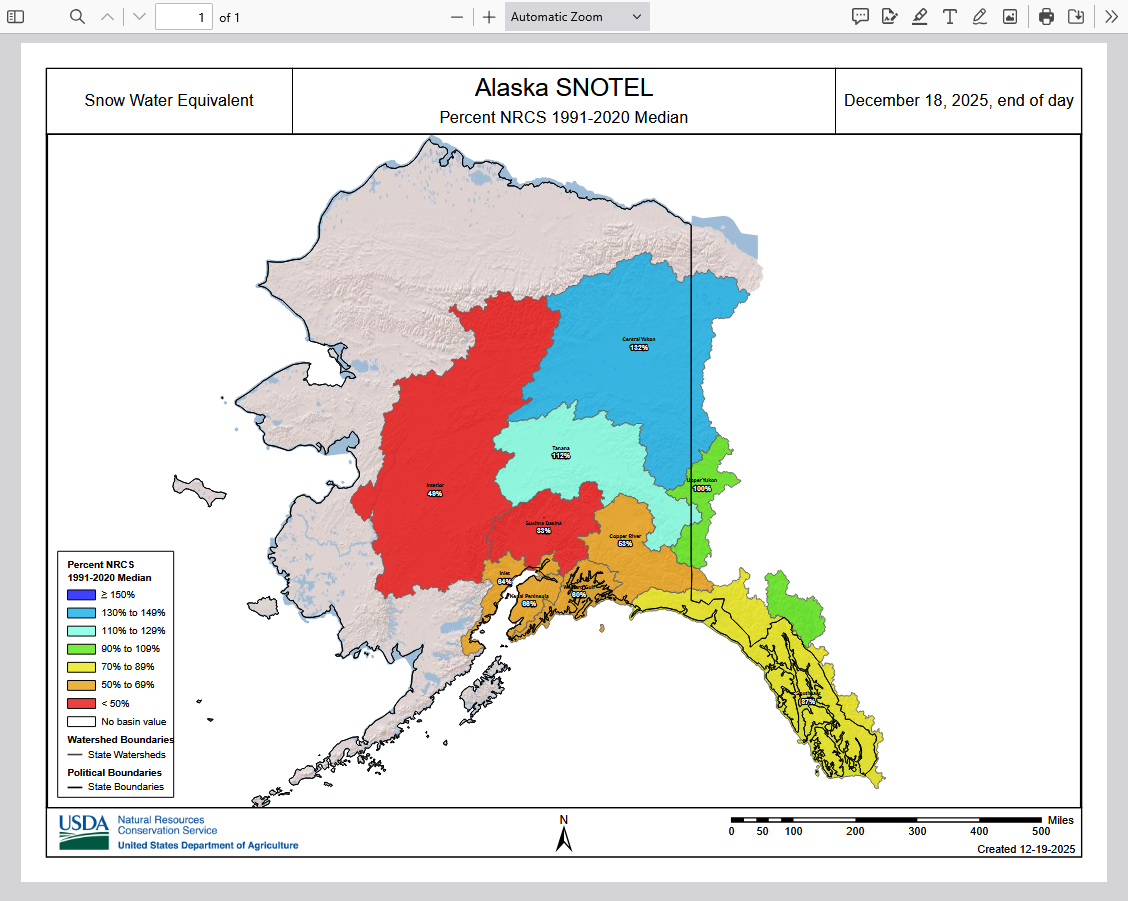
Just for fun, let's look at Alaska's data: Liquid rains have been close to average or ABOVE average everywhere.
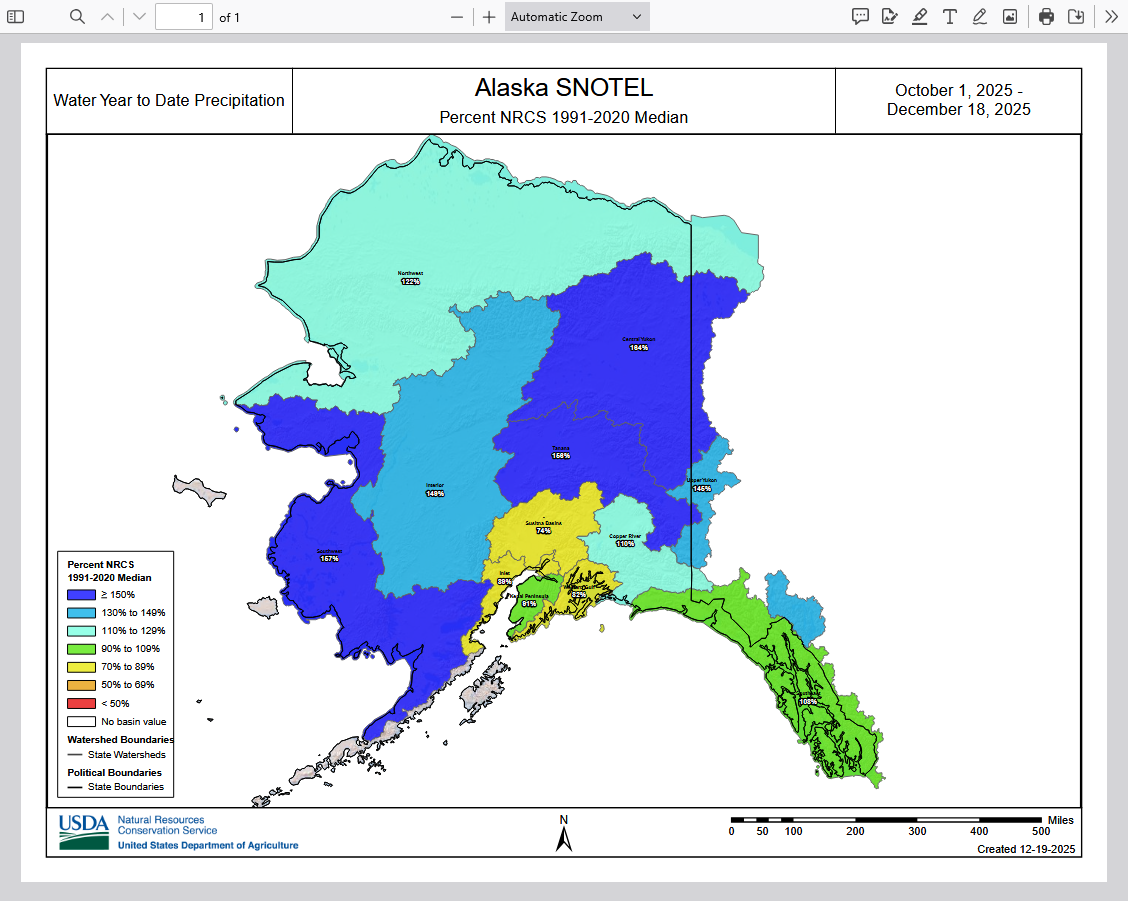
Snowpack is BELOW average except for the EastCentral/Northeast districts(where the air was colder and much of it fell as snow)
Back south again.
The storms and the atmospheric river will continue the next week but AIMED FARTHER SOUTH towards California.
This is TOO MUCH rain TOO FAST of course but the majority of precip at this time of year is TOO MUCH in this part of the country. That's just part of the normal climate.
More typical of an El Nino year, with the rains going this far south but this will help refill reservoirs, dams, lakes and rivers while dumping mountain snows that will melt in the Spring/Summer and provide water during the dry season.

Latest update on rains:
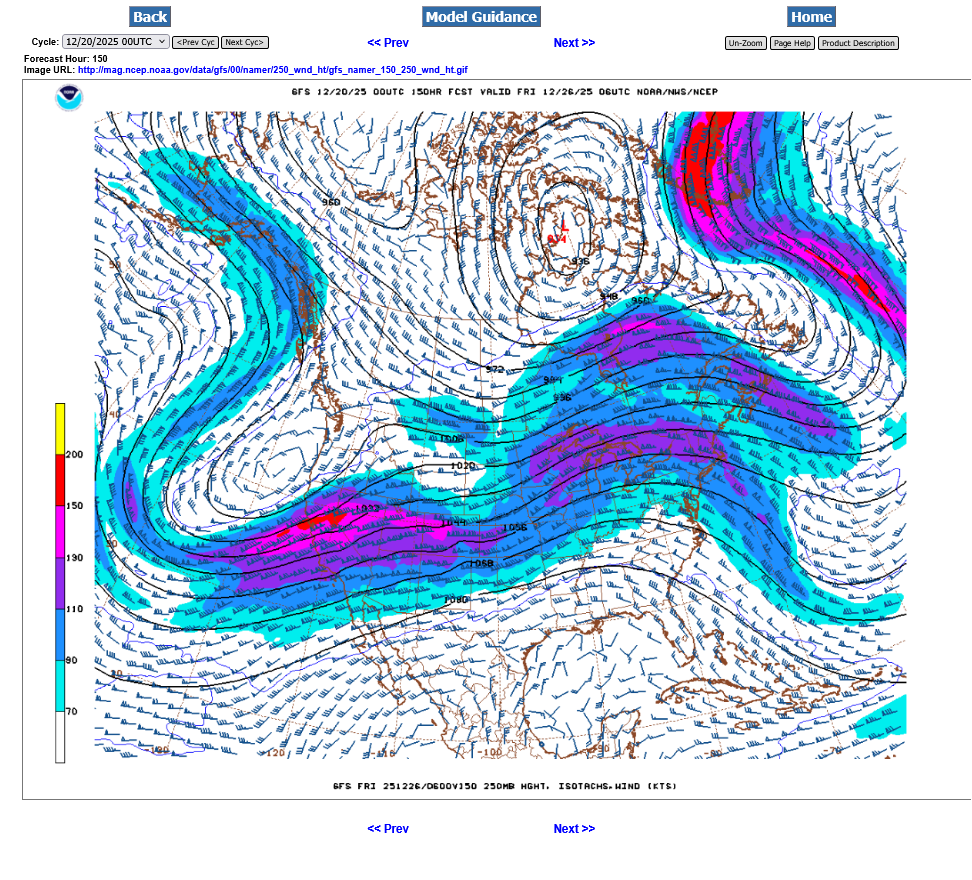
Note the changes in the jet stream the next week.
This is the 250 mb level which is around 34,000 feet above the ground.
The red colors(in knots) is a 200+ mph jet streak embedded within the jet stream(atmospheric river).
1. Recent jet stream clobbering the Pacific Northwest.
2. Jet stream next week, hitting much farther south. This new jet stream will actually buckle the flow, creating a deepening upper level low out West that builds/pumps up a downstream upper level ridge. A very common teleconnection/couplet in the atmosphere. As a result there will be near record warmth is in the Midwest around Christmas.

Constant updates at this link:
https://www.marketforum.com/forum/topic/83844/#83848
Last forecast, here on Saturday Morning. Heavy precip for California the next week!
Recent rains, falling too heavy as they often do, have greatly improved soil moisture, reservoir levels and lake levels out West.
https://www.marketforum.com/forum/topic/83844/#83853
Soilmoisture anomaly:
These maps sometimes take a day to catch up to incorporate the latest data(the bottom map is only updated once a week).
https://www.cpc.ncep.noaa.gov/products/Soilmst_Monitoring/US/Soilmst/Soilmst.shtml#
![]()


++++++++++++++++++++++++++++
Updated daily below:
https://mrcc.purdue.edu/cliwatch/watch.htm#curMonths
Support for all MRCC-hosted products and services is currently suspended as of April 17, 2025, due to a lapse in federal funding from the Department of Commerce through NOAA.

NEW LINK:
https://www.drought.gov/current-conditions
Released December 16, 2025
DROUGHT MONITOR
https://droughtmonitor.unl.edu/
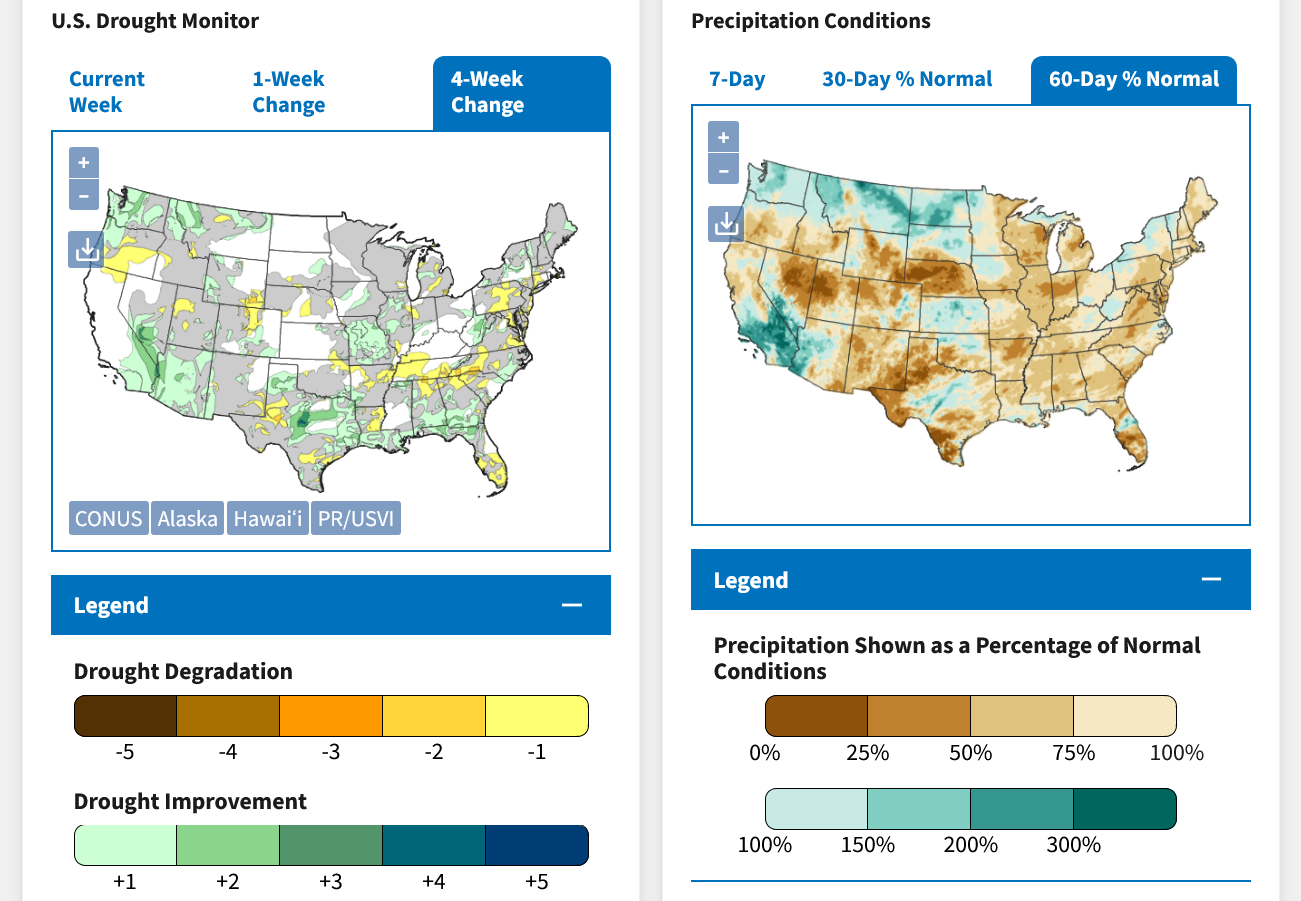
Drought out West has been improving from recent rains:
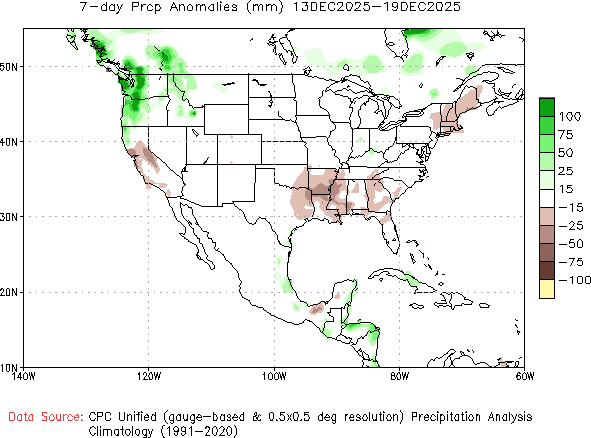
Here's a new site! Precipitation anomalies.
7 days
14 days
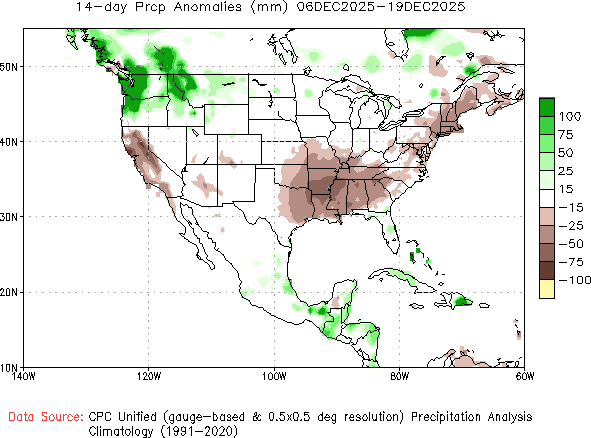 30 days
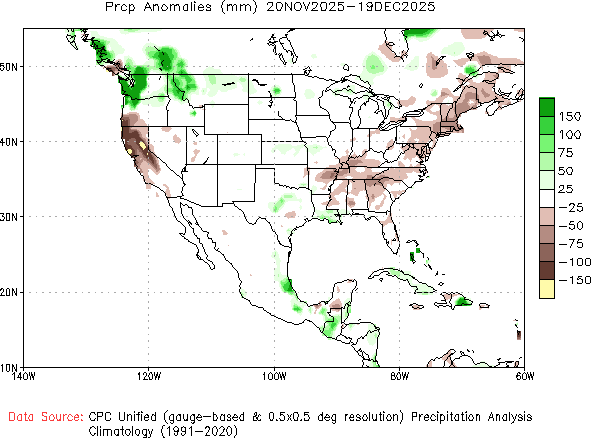
90 days
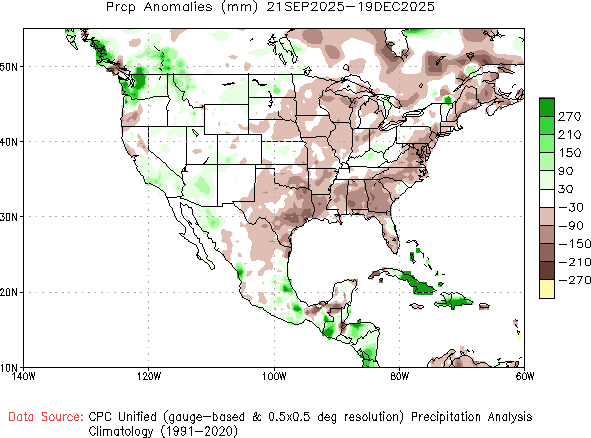
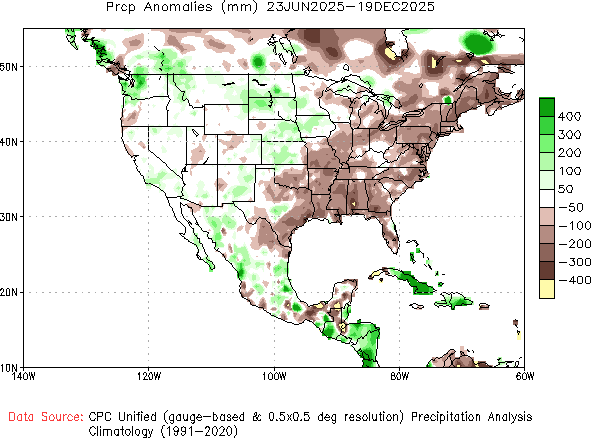
180 days