
+++++++++++++++++
+++++++++++++++++++
By my standards, we already have a flash drought. By the time the indices and charts we see show it, it's been there for a little while.
The top of this thread covers it pretty well, so I copied it below:
https://www.marketforum.com/forum/topic/83844/
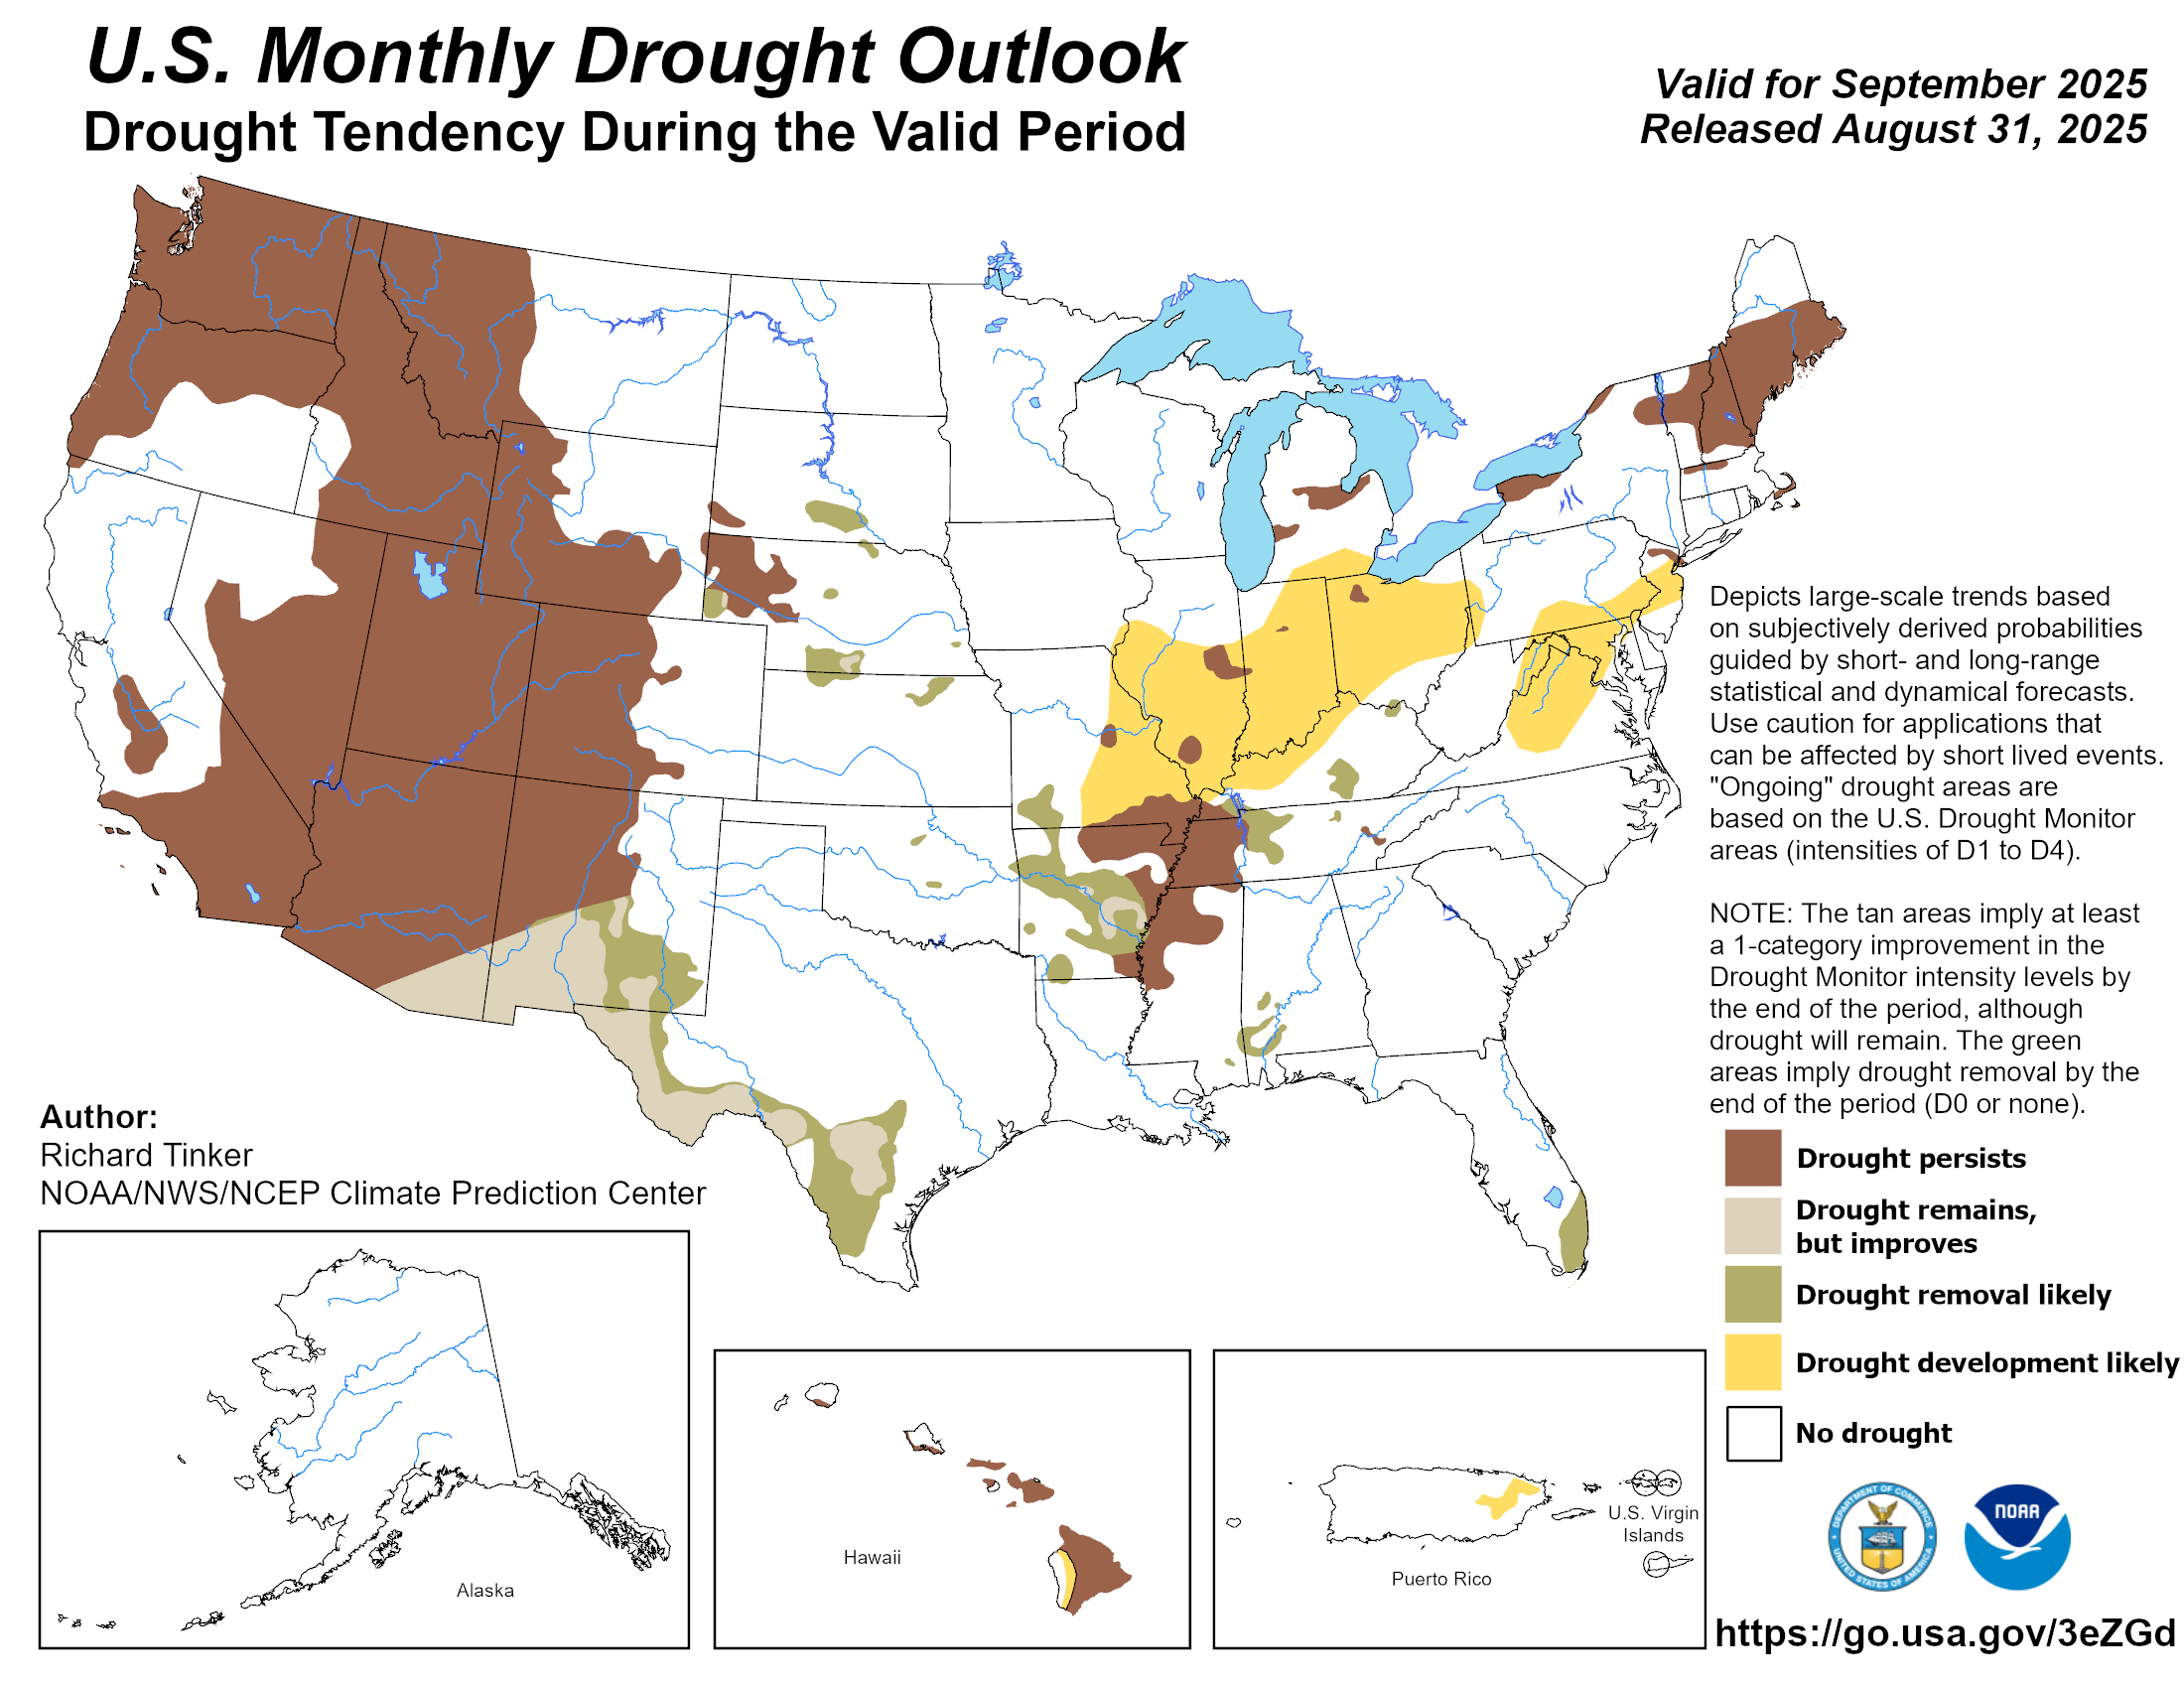
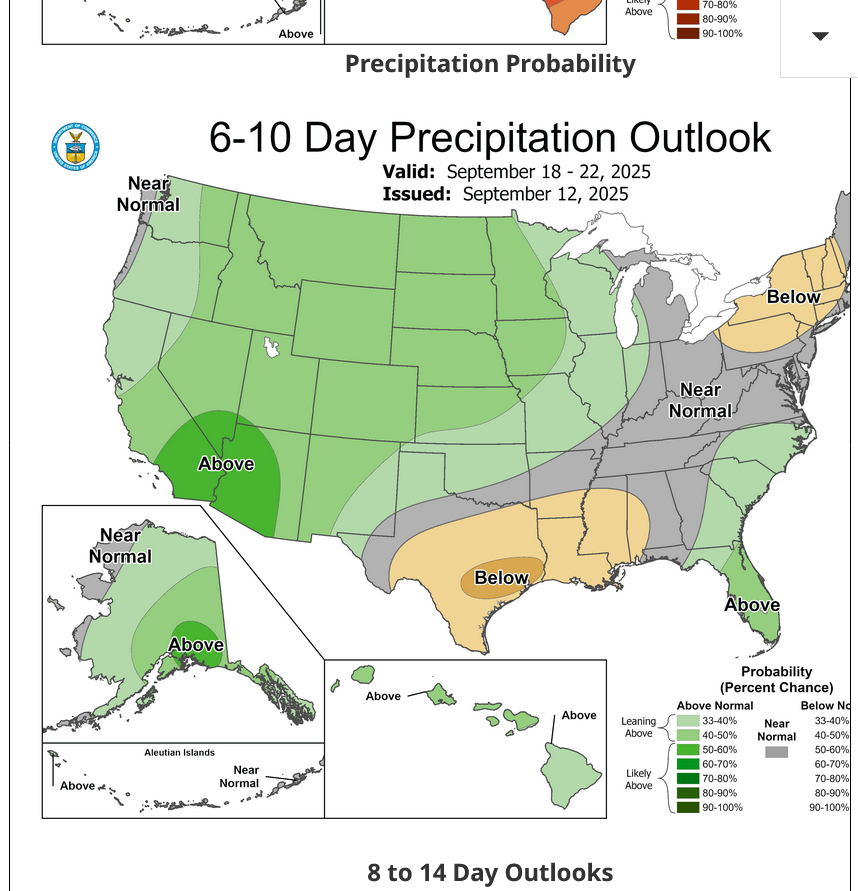
The NWS has been a couple weeks slow in their forecast on this:
https://www.cpc.ncep.noaa.gov/products/expert_assessment/month_drought.png
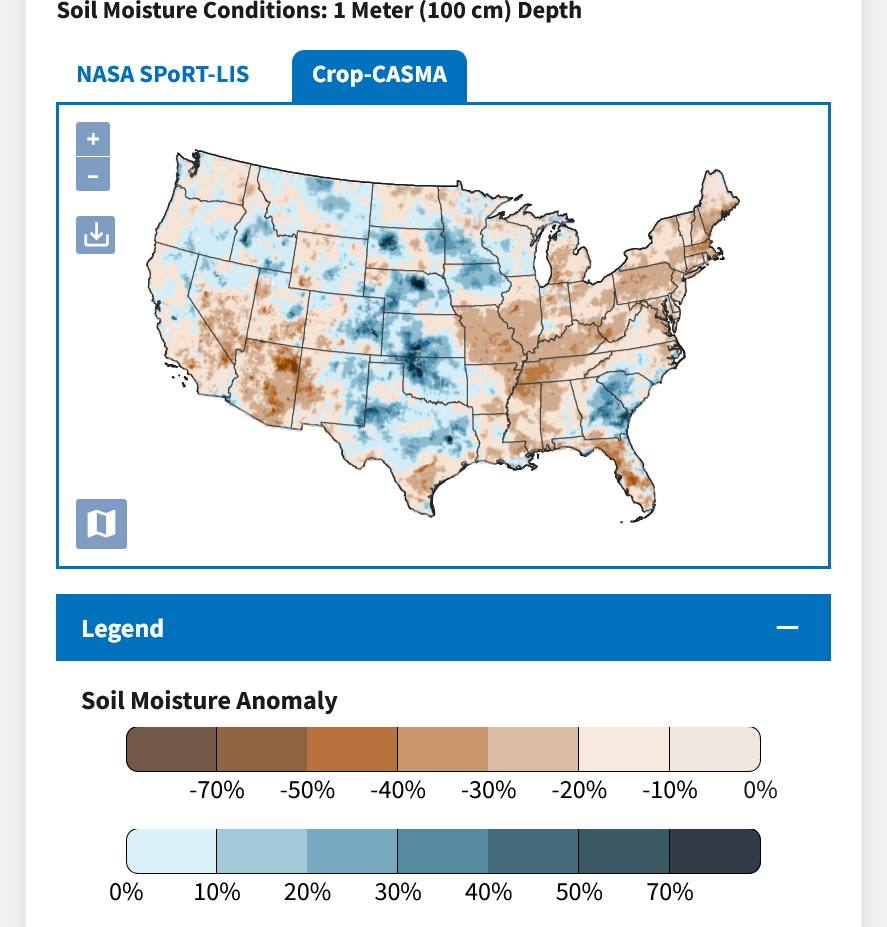
Soilmoisture anomaly:
These maps sometimes take a day to catch up to incorporate the latest data(the bottom map is only updated once a week).
https://www.cpc.ncep.noaa.gov/products/Soilmst_Monitoring/US/Soilmst/Soilmst.shtml#
![]()


++++++++++++++++++++++++++++
NEW LINK:
https://www.drought.gov/current-conditions
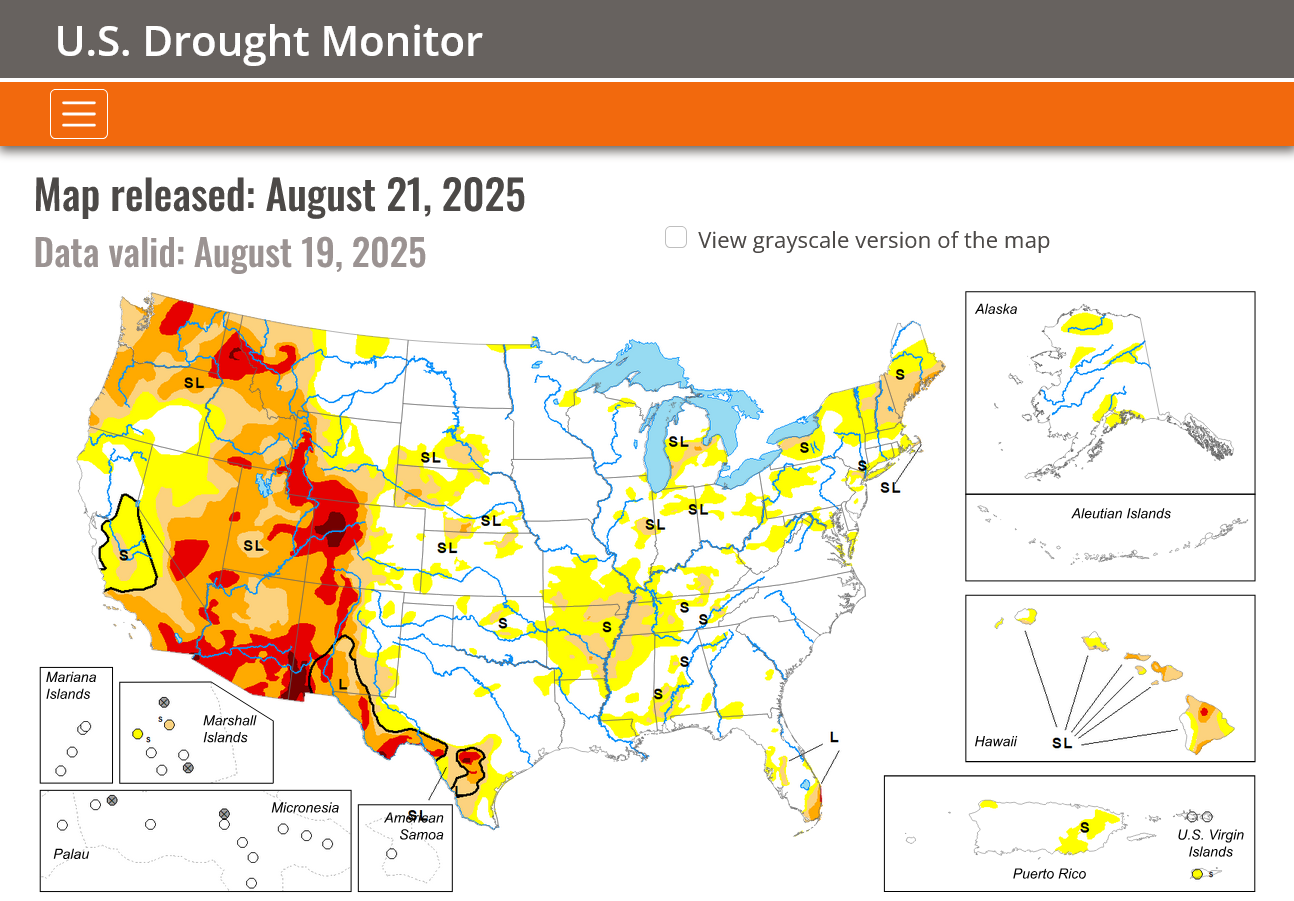
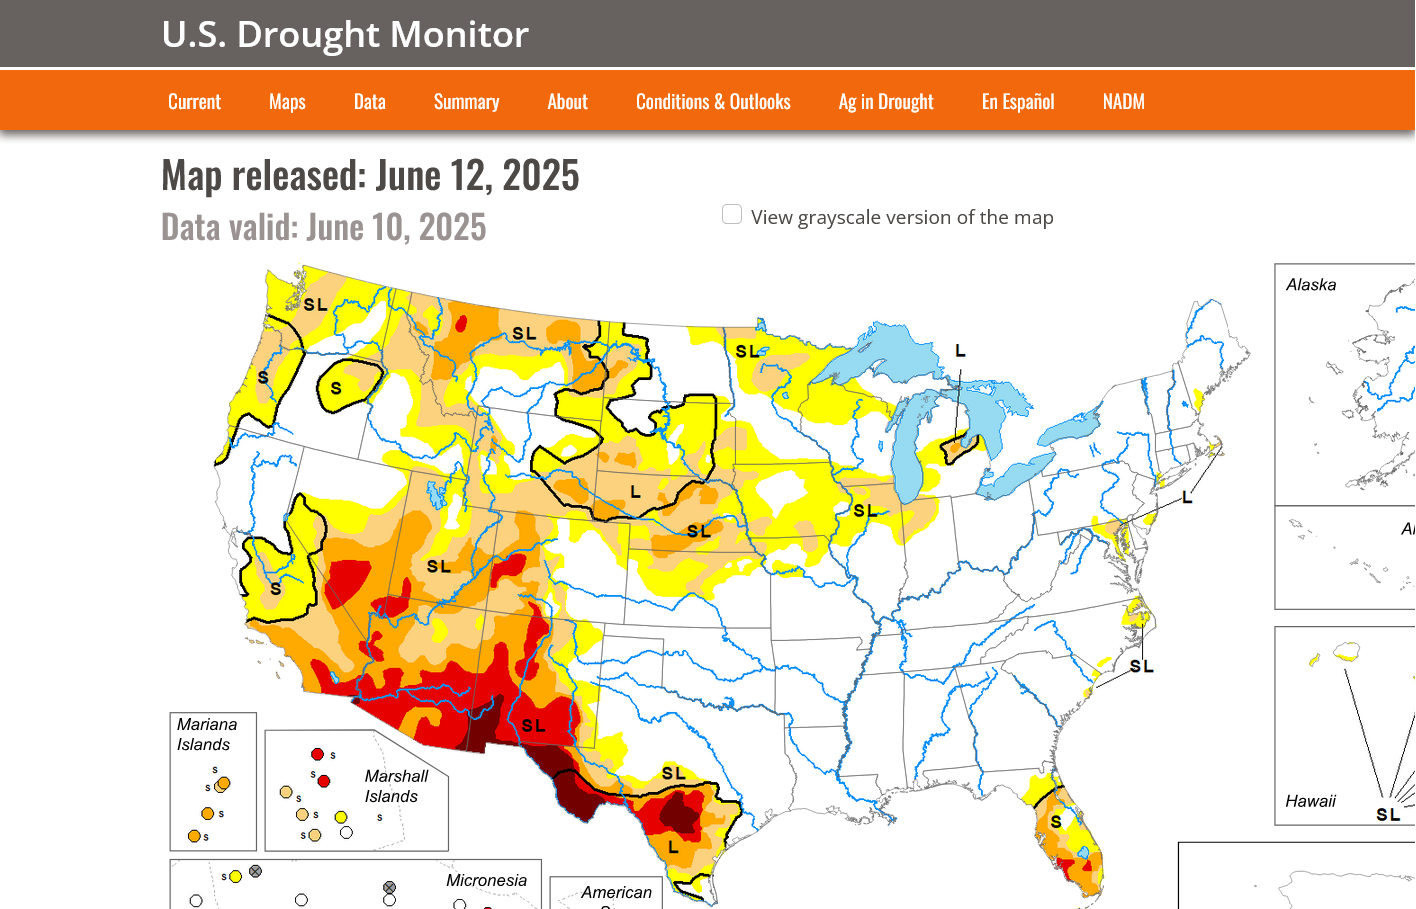
August 20, 2025 - August 26, 2025
https://droughtmonitor.unl.edu/
FLASH DROUGHT!!
The outlook is not great but we have chances for rain the next several days.
https://www.marketforum.com/forum/topic/83844/#83848
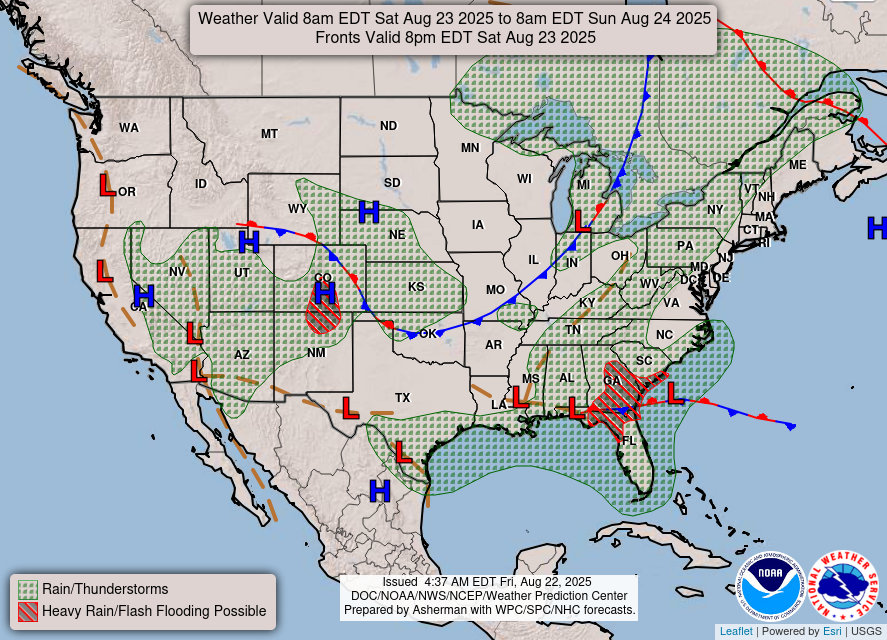
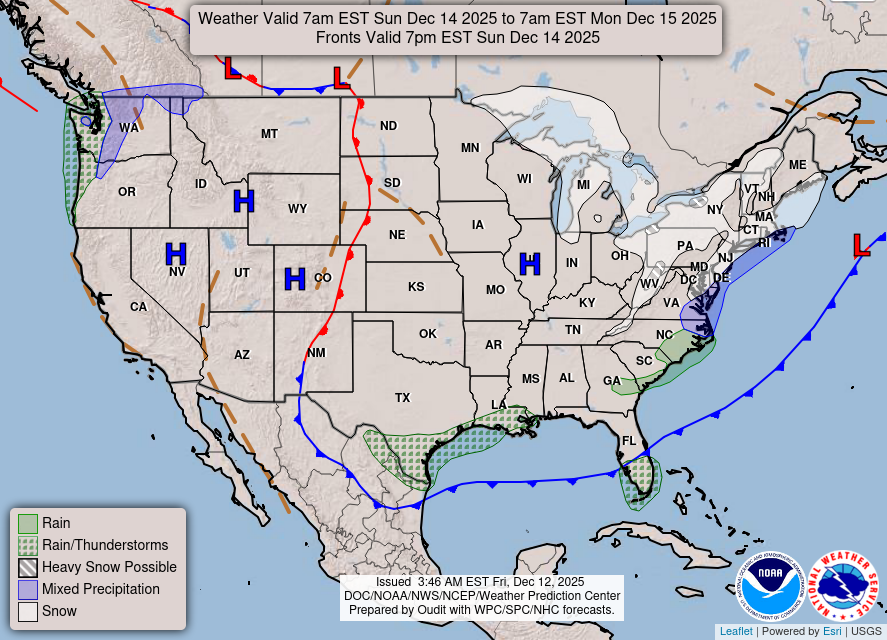
1. Weather map now.
2. In 24 hours and
3. In 48 hours.
https://www.wpc.ncep.noaa.gov/#

+++++++++++++++++++++++++++++++++++++++++++++++++
Surface Weather maps for days 3-7 below:
https://www.wpc.ncep.noaa.gov/medr/medr.shtml

+++++++++++++++++++++++++++++++++++++++++++
The latest 7 day precip forecasts are below.
Day 1 below:
http://www.wpc.ncep.noaa.gov/qpf/fill_94qwbg.gif?1526306199054

Day 2 below:
http://www.wpc.ncep.noaa.gov/qpf/fill_98qwbg.gif?1528293750112

Day 3 below:
http://www.wpc.ncep.noaa.gov/qpf/fill_99qwbg.gif?1528293842764

Days 4-5 below:
http://www.wpc.ncep.noaa.gov/qpf/95ep48iwbg_fill.gif?1526306162

Days 6-7 below:
http://www.wpc.ncep.noaa.gov/qpf/97ep48iwbg_fill.gif?1526306162

7 Day Total precipitation below:
http://www.wpc.ncep.noaa.govcdx /qpf/p168i.gif?1530796126

++++++++++++
Severe Storm Risk......updated daily(days 1 and 2 twice daily).
https://www.spc.noaa.gov/products/outlook/
Current Day 1 Outlook | |
Current Day 2 Outlook | |
Current Day 3 Outlook | |
Current Day 4-8 Outlook |
I forgot that I started this new thread to discuss our flash drought.
These were the posts since then that are related:
September 4, 2025, 2:02 a.m.
.55 worth of rain here a short while ago. We were one,of the more fortunate ones.
Yippee! The most since July!
Hopefully, a bit more before this weather system moves past us over the weekend because the 2 weeks after that look like back to dryI
By cutworm - Sept. 4, 2025, 11:35 a.m.
22/100 here soaked into the top1 inch of the soil, not getting to the root zone. Below that dry. Way to late to help the deteriorating condition of beans in my area.
By metmike - Sept. 4, 2025, 12:20 p.m.
Thanks, cutworm.
Sorry you didn't get more than that. I was thinking that farther east, you are the better the rains should be. We just got dang lucky here in this county. I'll try to put together a rain report later since this came after such a LOOOONG dry period.
I act like an idiot when it hasn't rained for weeks and its raining outside.
1. It's more fun tracking a rain event like this than anything. OK, snow storms are up there too.
2. While it's raining, I will run out to the rain gauge, in the pouring rain numerous times, getting pretty wet when its really coming down but I can't wait for it to end. I'll make guesses on how much I think the rain gauge will show each time before going out there
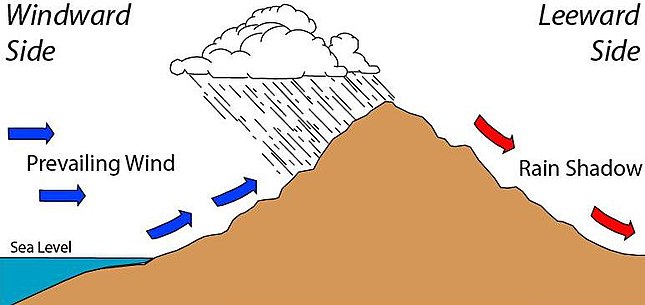
3. I have a rain gauge in front of our porch in the front yard and 1 in the backyard, around 15 feet away from the back door. You would think the measurements would be the same but the one in the front always measures more rain. ALWAYS! I have a couple of theories. The one in the back is on the east side of the house, with most of our rains coming in with a west to east component so the house may be producing a "rain shadow" effect. This happens on the lee side of mountains for an entirely different reason. In our case, I think that it’s more of an "umbrella shadow" effect. The one in the front doesn't have as much blocking, even though there are some trees that are close enough to theoretically do that.
It might be an artifact from the actual rain gauges, so I'll switch them for the next event to see if that matters.
cutworm,
You also make a great point about the piddly rain you got not making it into the root zone where the plants can actually use it. At best, it just stopped the additional drying. I think too, the plants could be shutting down early which reduces the time for pod filling and reduces the time for kernel filling for corn.
I pass some very late planted corn fields several times each week. They still have several weeks of kernel filling left........or they should have had. They are going from green, to drying up and dying instead of brown.
+++++
Forgot to mention that we got another .21 early this morning. Total of .76:and another decent chance LATE FRIDAY and very early Saturday. This is what I was hoping for because of the powerful dynamics with this system(more like cold season dynamics) even though moisture for it to work with isn’t the greatest.
I showed them in the natural gas thread yesterday and will copy that here, when back on the computer.
+++++++++++++
https://en.wikipedia.org/wiki/Rain_shadow
 ++++++++++++++=
I speculate that the leeward side of our house, consistently has less rain in that rain gauge for a complete different principle. Some of the rain bearing air parcels are BLOCKED from wind that goes AROUND the house(over the top) then passes OVER the rain gauge.
Re: Re: Re: August 12, 2025 USDA
By metmike - Sept. 4, 2025, 1:48 p.m.
Cutworm,
Im worried this next rain event is going to come together on top of us and then track southeast with rains that we barely miss. Going to be a close call.
Re: Re: Re: Re: August 12, 2025 USDA
By cutworm - Sept. 4, 2025, 7:04 p.m.
Some of the corn is drying up before it matures (black layers). This is similar to frost damage. in that it will have low test weight, it(the kernels) will not dry. How much is affected is very hard to tell till the combine starts running. You can't see this by looking form the road, need to pull some ears. I have checked some spots and found some of this. Again Very hard to tell the extent. I'm thinking a few(1-3) %.
By metmike - Sept. 4, 2025, 8 p.m.
Thanks very much, cutworm!
You would know better than anyone, including me so your opinion is especially appreciated!
By cutworm - Sept. 5, 2025, 9:27 a.m.
Eric seems to echo your forecast for no rain for my part of Indiana. No rain for a large part of the growing area in In. ILL. Ohio Mo. About 40% of the bean crop in drought and no rain in the foreseeable future.
By metmike - Sept. 5, 2025, 11:19 a.m.
These were the weather map forecast from 2 days ago that I posted on the NG thread. WOW for early September!
HUGE weather pattern change for next week that turns up the heat but does not bring any rain to Indiana!
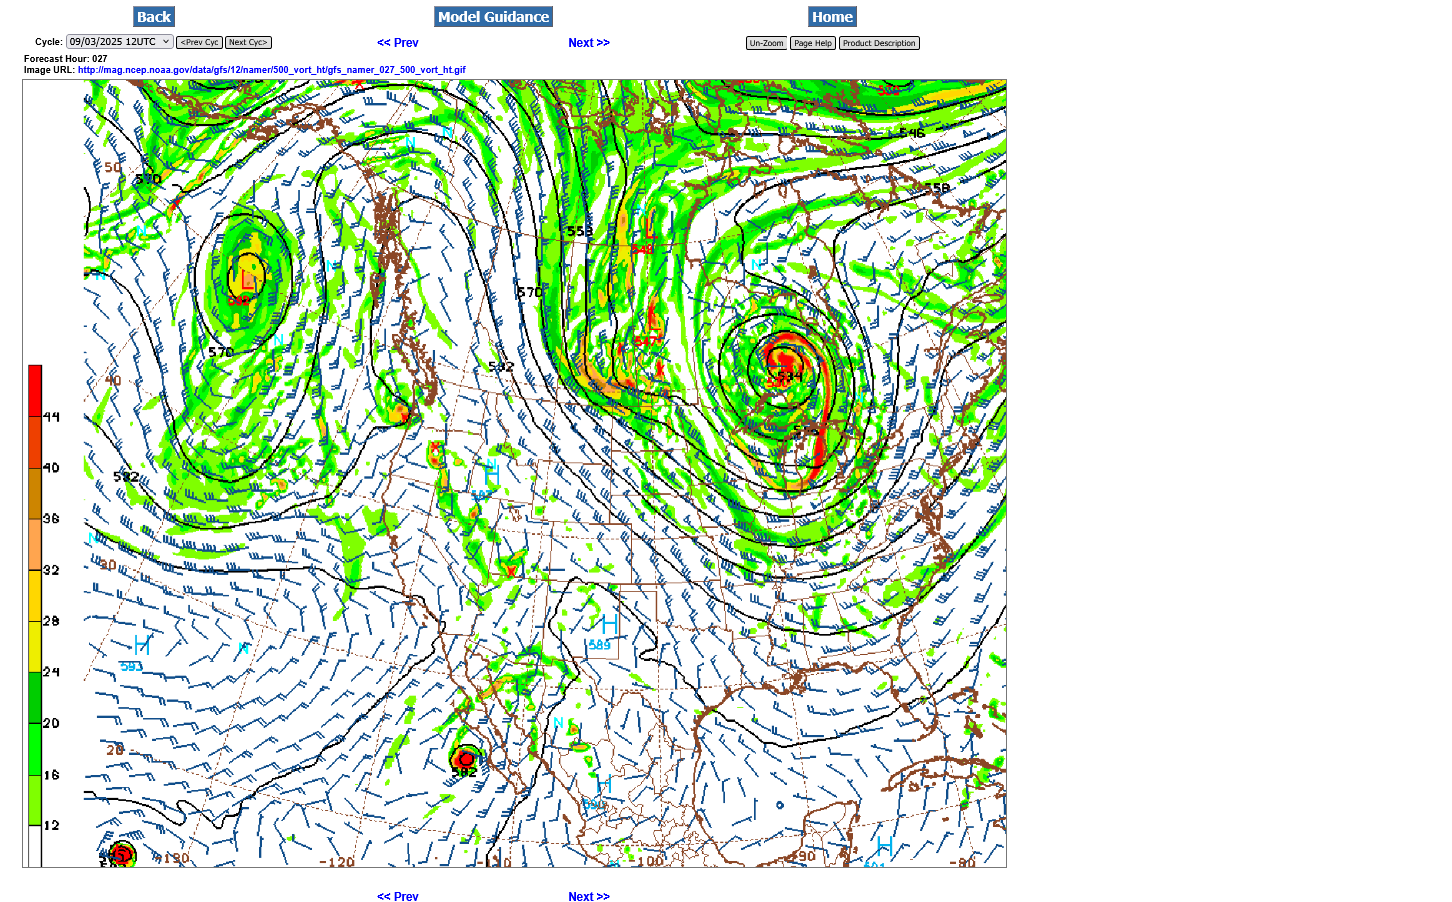
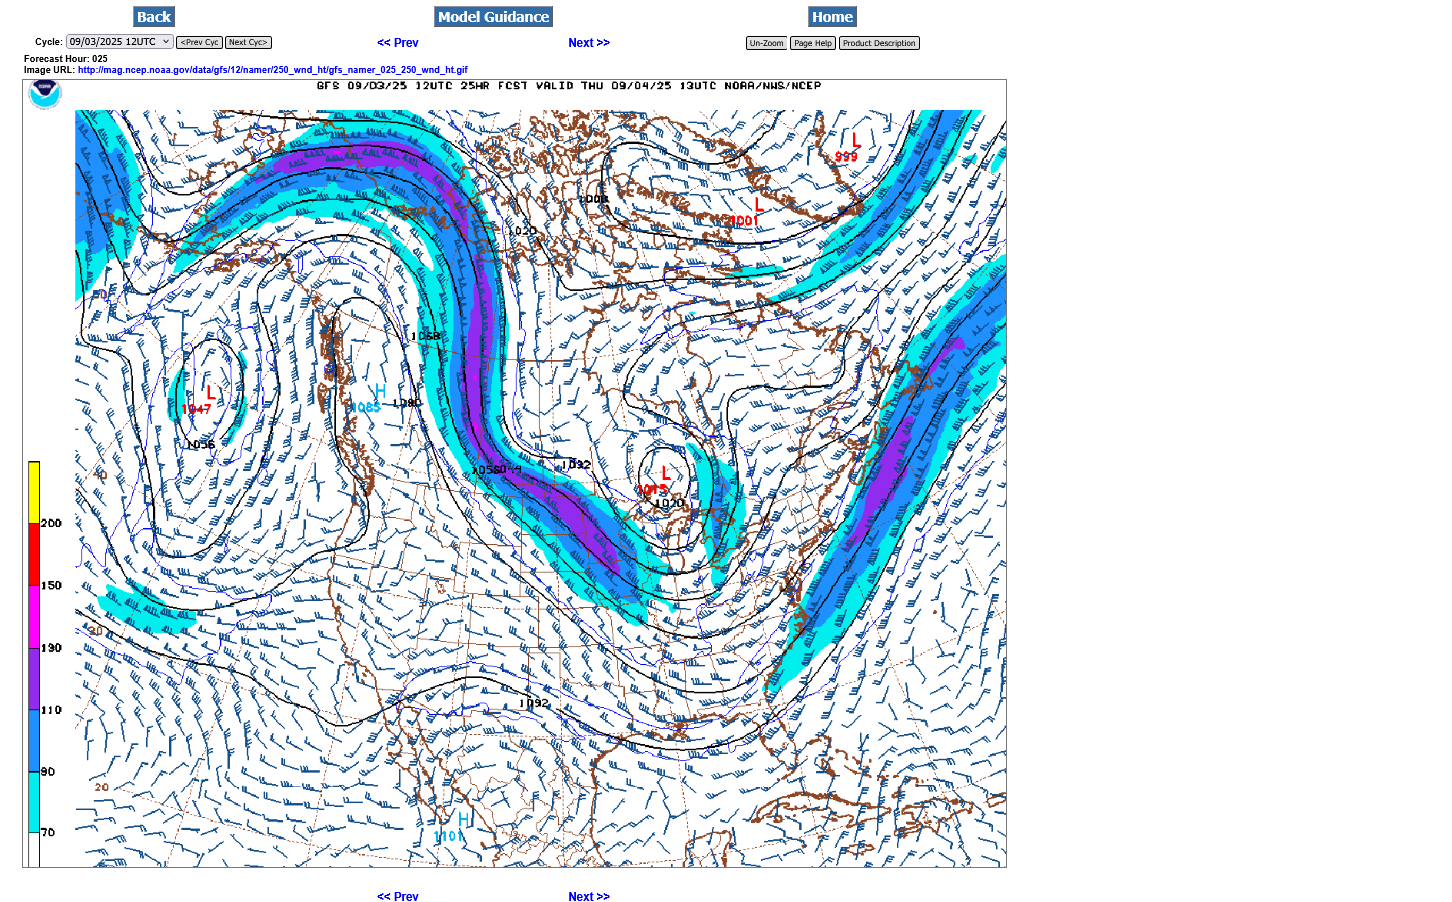
By metmike - Sept. 3, 2025, 3:48 p.m.
The map below is from the last 12z GFS operational model at 500 mb (18,00 feet) for Thursday morning. That deep low just north of Lake Superior is a huge piece of THE POLAR VORTEX!
We can see a huge kink in the lines, along the ND border with Canada from a strong perturbation/reinforcing wave with the colors representing powerful, positive vorticity(spin) associated with it. It's a strong reinforcement of this very chilly air that is rotating around the backside of the main/parent Low just north of Lake Superior.
This is more like a Winter pattern.
Here's the 250 jet stream(33,000 feet). Note it diving straight south/southeast, transporting air from much higher latitudes/the Arctic to the mid latitudes. The small pink color embedded within the jet stream represents a 150 mph jet streak!!
The piece of polar vortex at this level is also seen just north of Lake Superior.
A jet stream like this in 3+ months means brutally cold temps and a major Winter storm east of the trough line and/or associated with the lift from the jet stream dynamics. We can make out that kink in the isoheights that is northwest of the 500mb level, now much higher up, around the Alberta/ Saskatchewan border in Canada!
++++++++++++
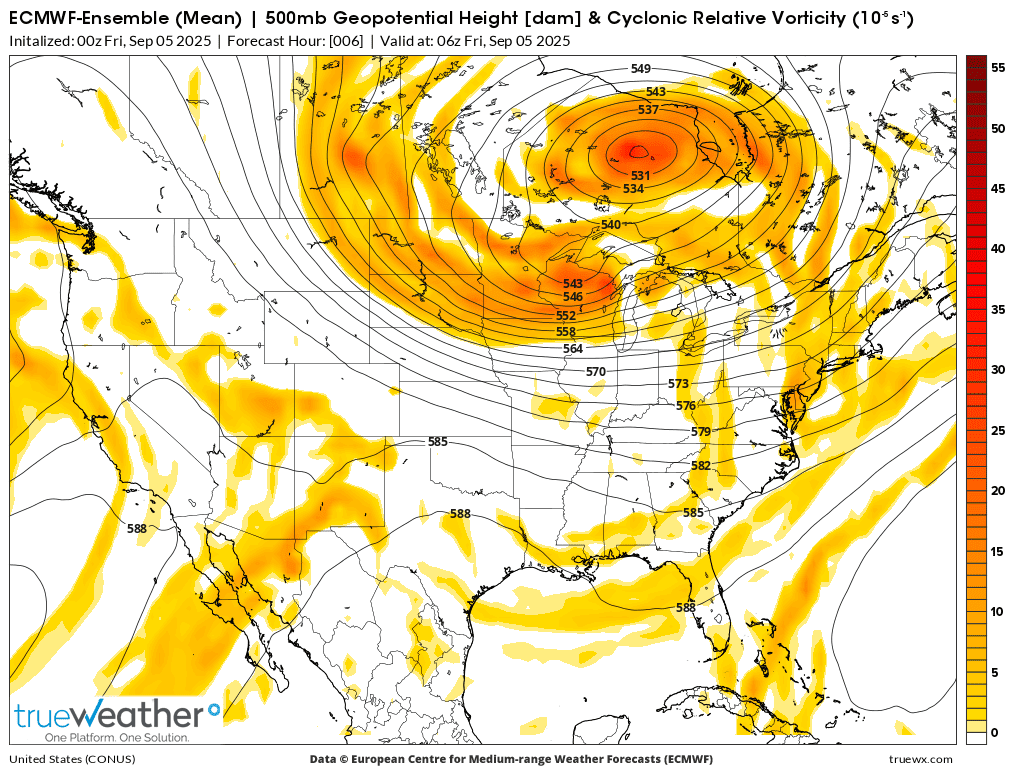
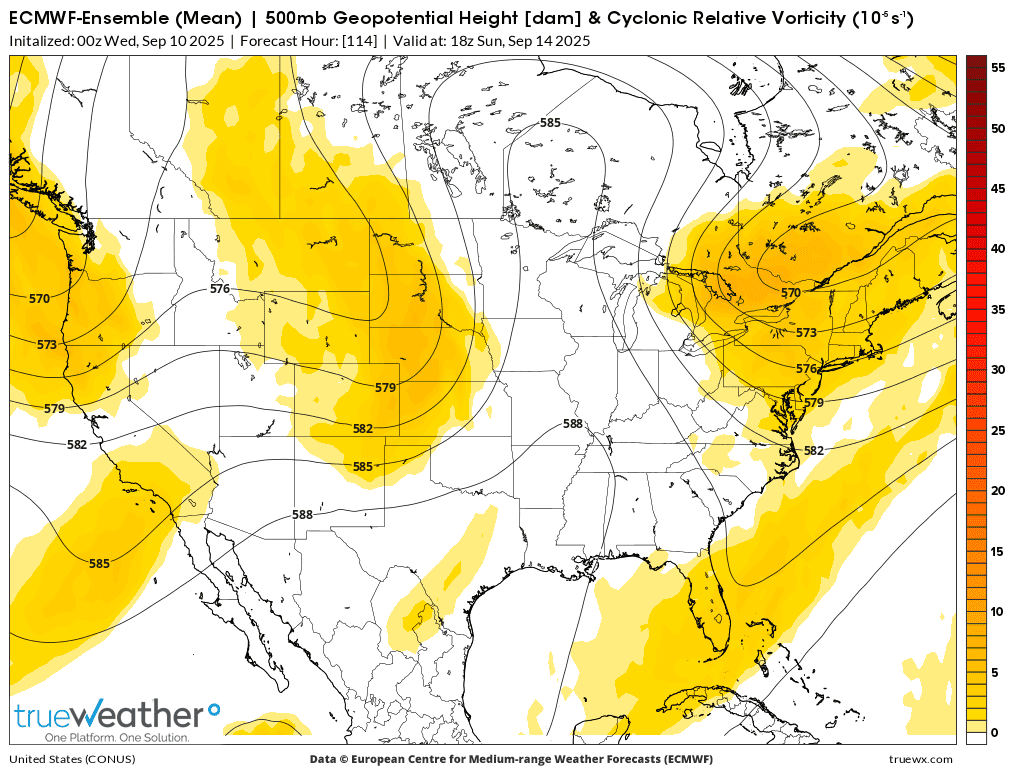
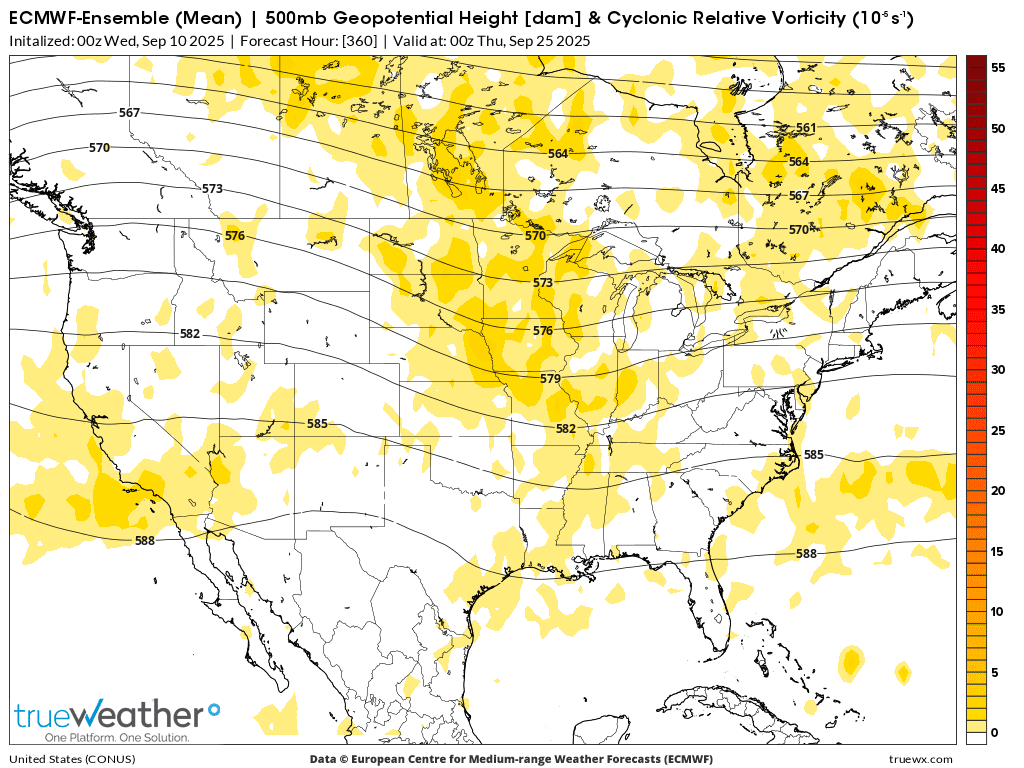
Here's the European Ensemble model at 500 mb.
1. Vorticity/spin. Spokes of vorticity rotating around the backside of the DEEP Low(north of Lake Superior) are a reinforcement of this near record ARCTIC cold.
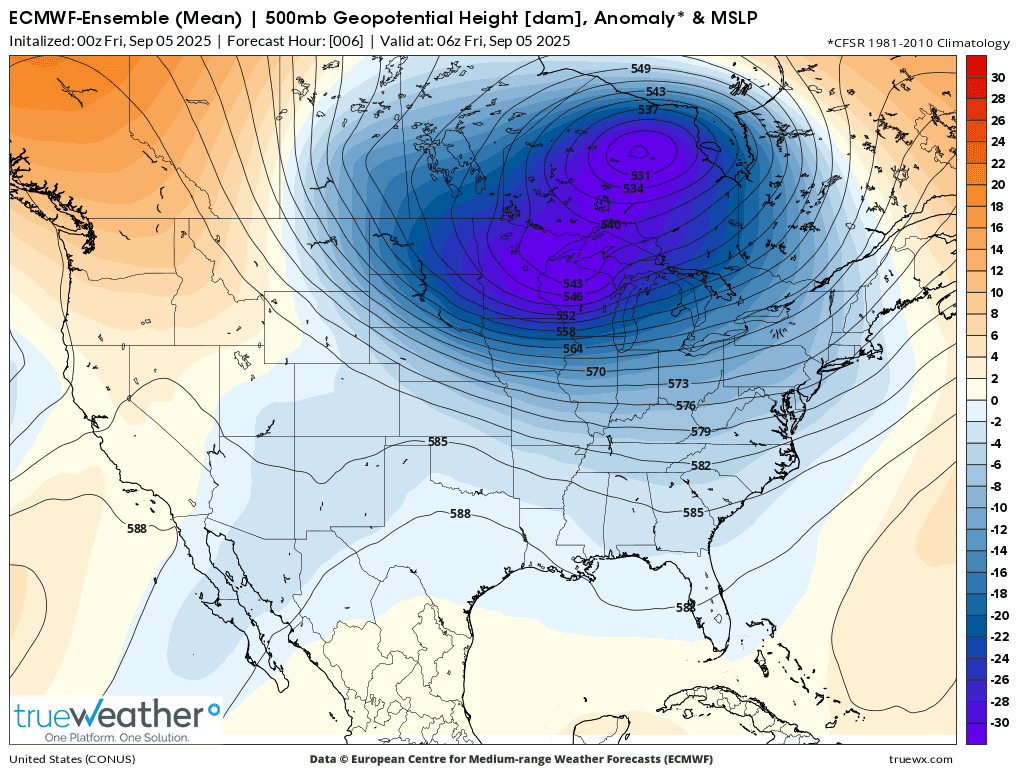
2. Departure from average for September 5th. This is a COLD SEASON pattern with the polar vortex displaced extremely far south!
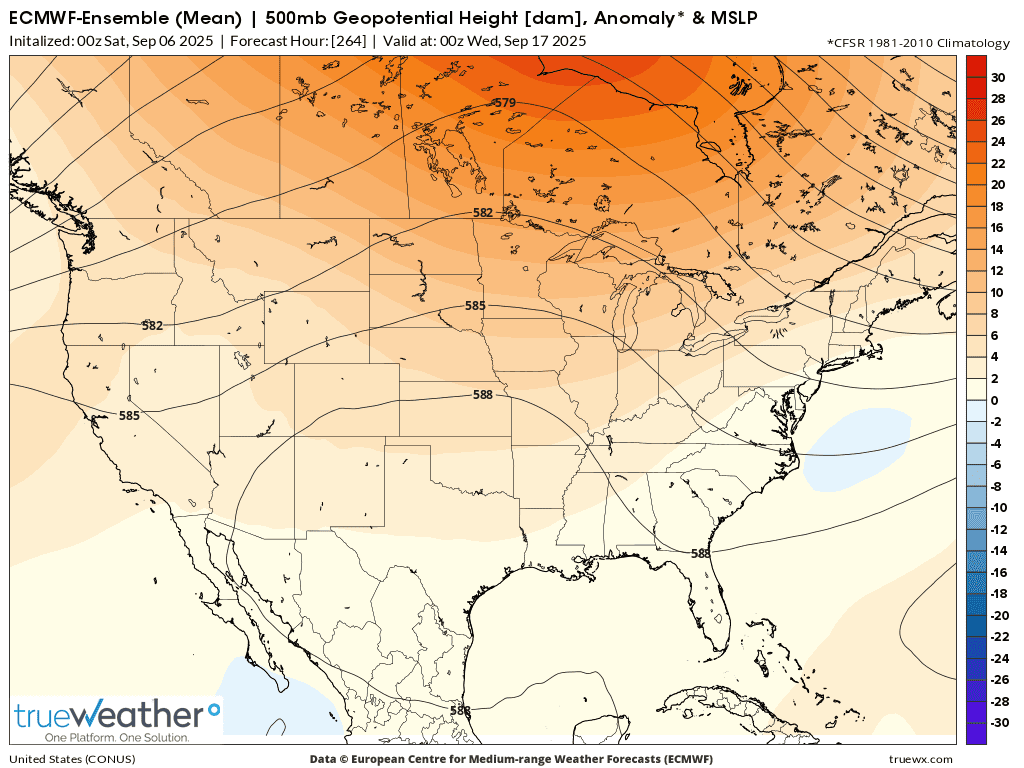
3. 11 days later. The same map. WOW!!!
++++++++++++++++++++++
4. GEFS 850 temperature departures. A huge chunk/blob of Arctic air has been displaced/transported far southward!
5. Same map. Forecast for 10 days.
Day 11, 500 mb forecast from the same model above: Massive upper level High pressure ridge replacing the massive upper level/deep Low.
Current temp anomalies GEFS
Day 10 temp anomalies below GEFS-complete opposite of the current temps above
Re: Re: Re: Re: Re: Weather May 2022
By metmike - April 30, 2022, 8:46 p.m.
Soilmoisture anomaly:
These maps sometimes take a day to catch up to incorporate the latest data(the bottom map is only updated once a week).
https://www.cpc.ncep.noaa.gov/products/Soilmst_Monitoring/US/Soilmst/Soilmst.shtml#
![]()
NEW LINK:
https://www.drought.gov/current-conditions
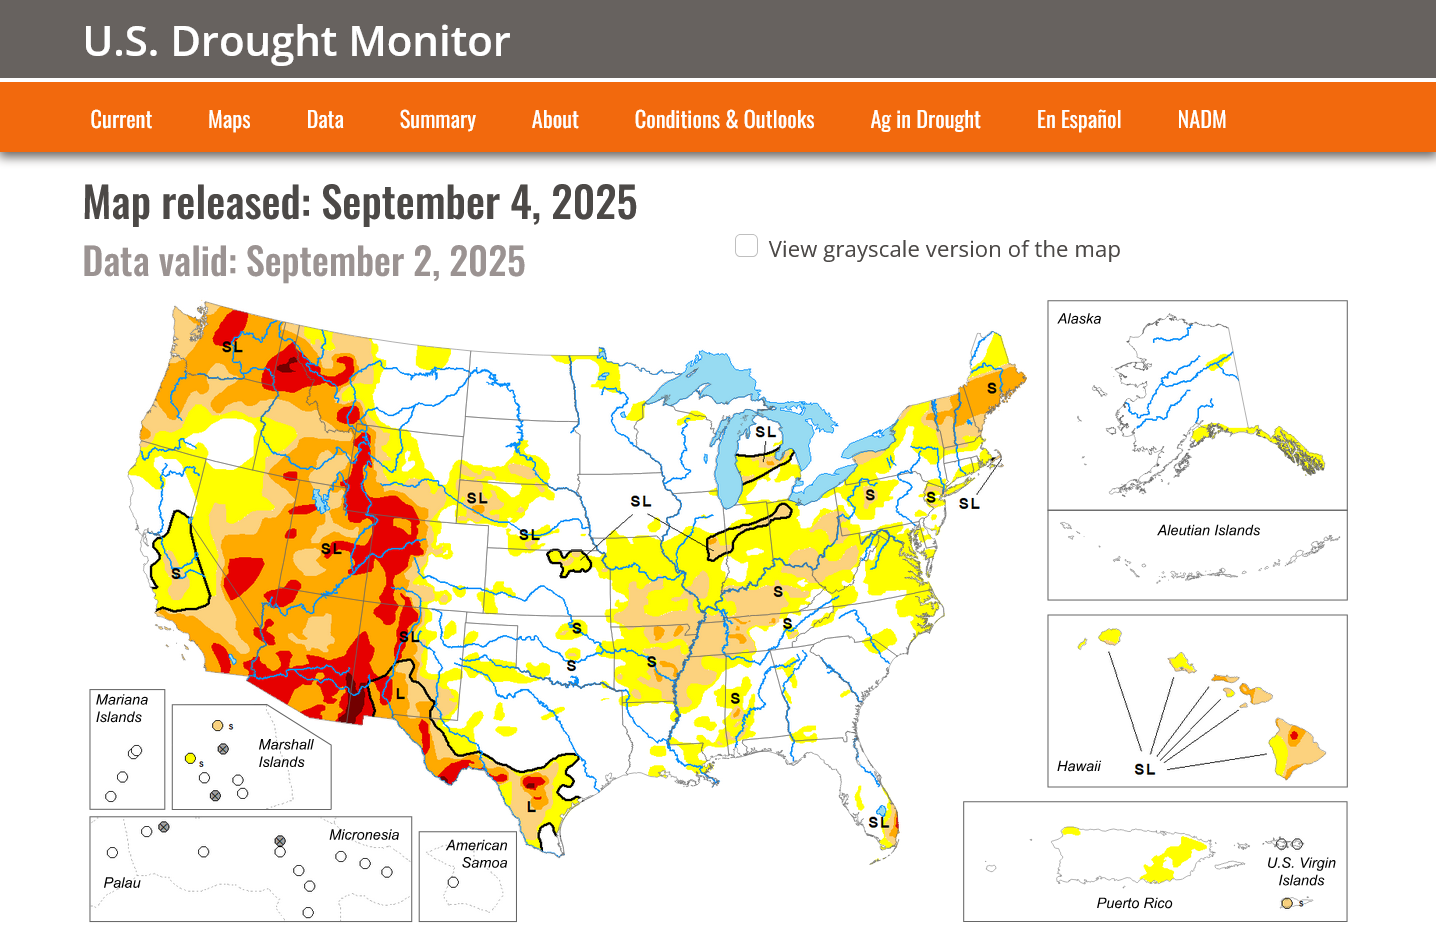
August 27, 2025 - September 2, 2025
FLASH DROUGHT!!!!
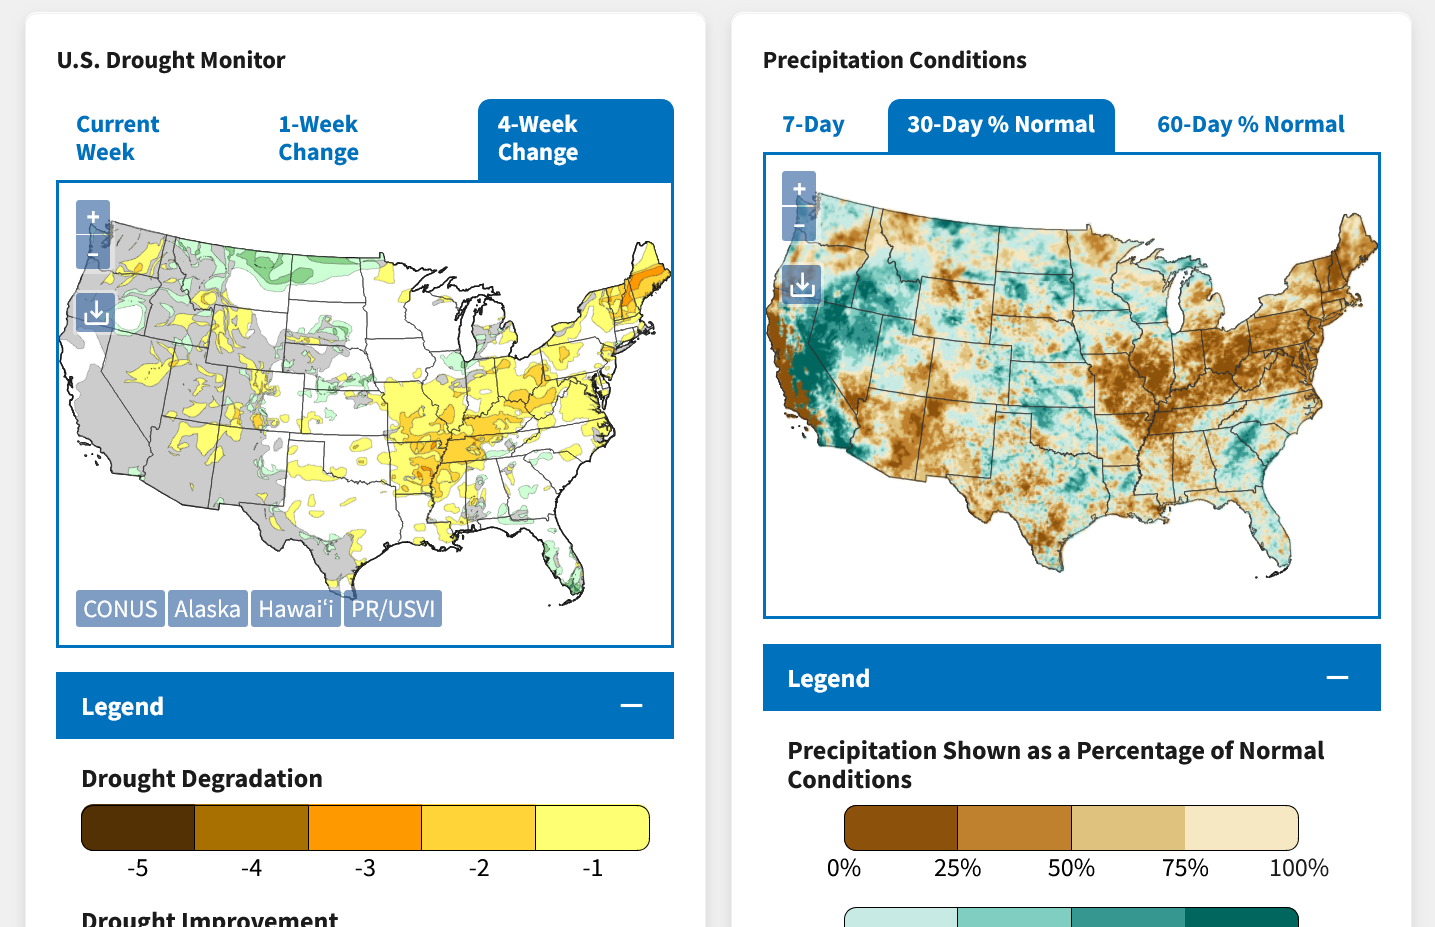
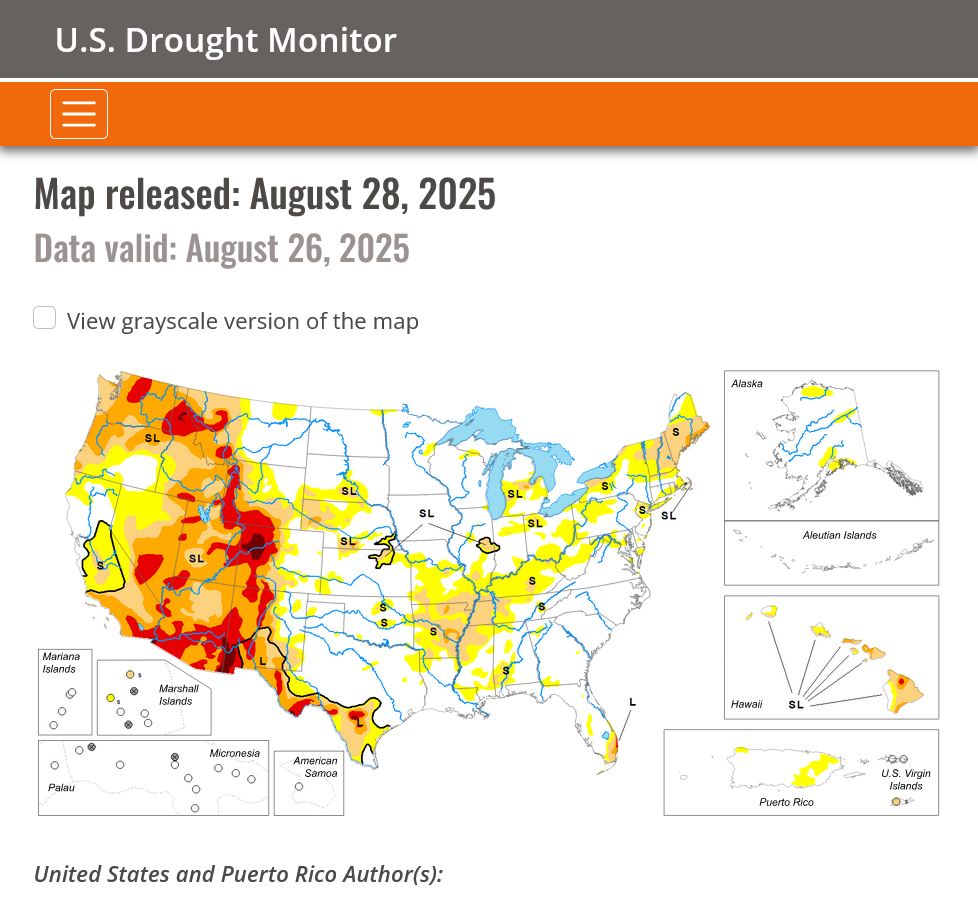
DROUGHT MONITOR
https://droughtmonitor.unl.edu/
Flash Drought has spread rapidly!
FLASH DROUGHT!!
(Flash?) drought returning!
Drought area in the Cornbelt has been almost completely eliminated!!!
This is not much area in drought compared to many years and compared to earlier this year/last Fall. Scroll down to see the massive improvement! This is much less than predicted earlier this Spring!!!
Soil moisture replenished in the Eastern Cornbelt!
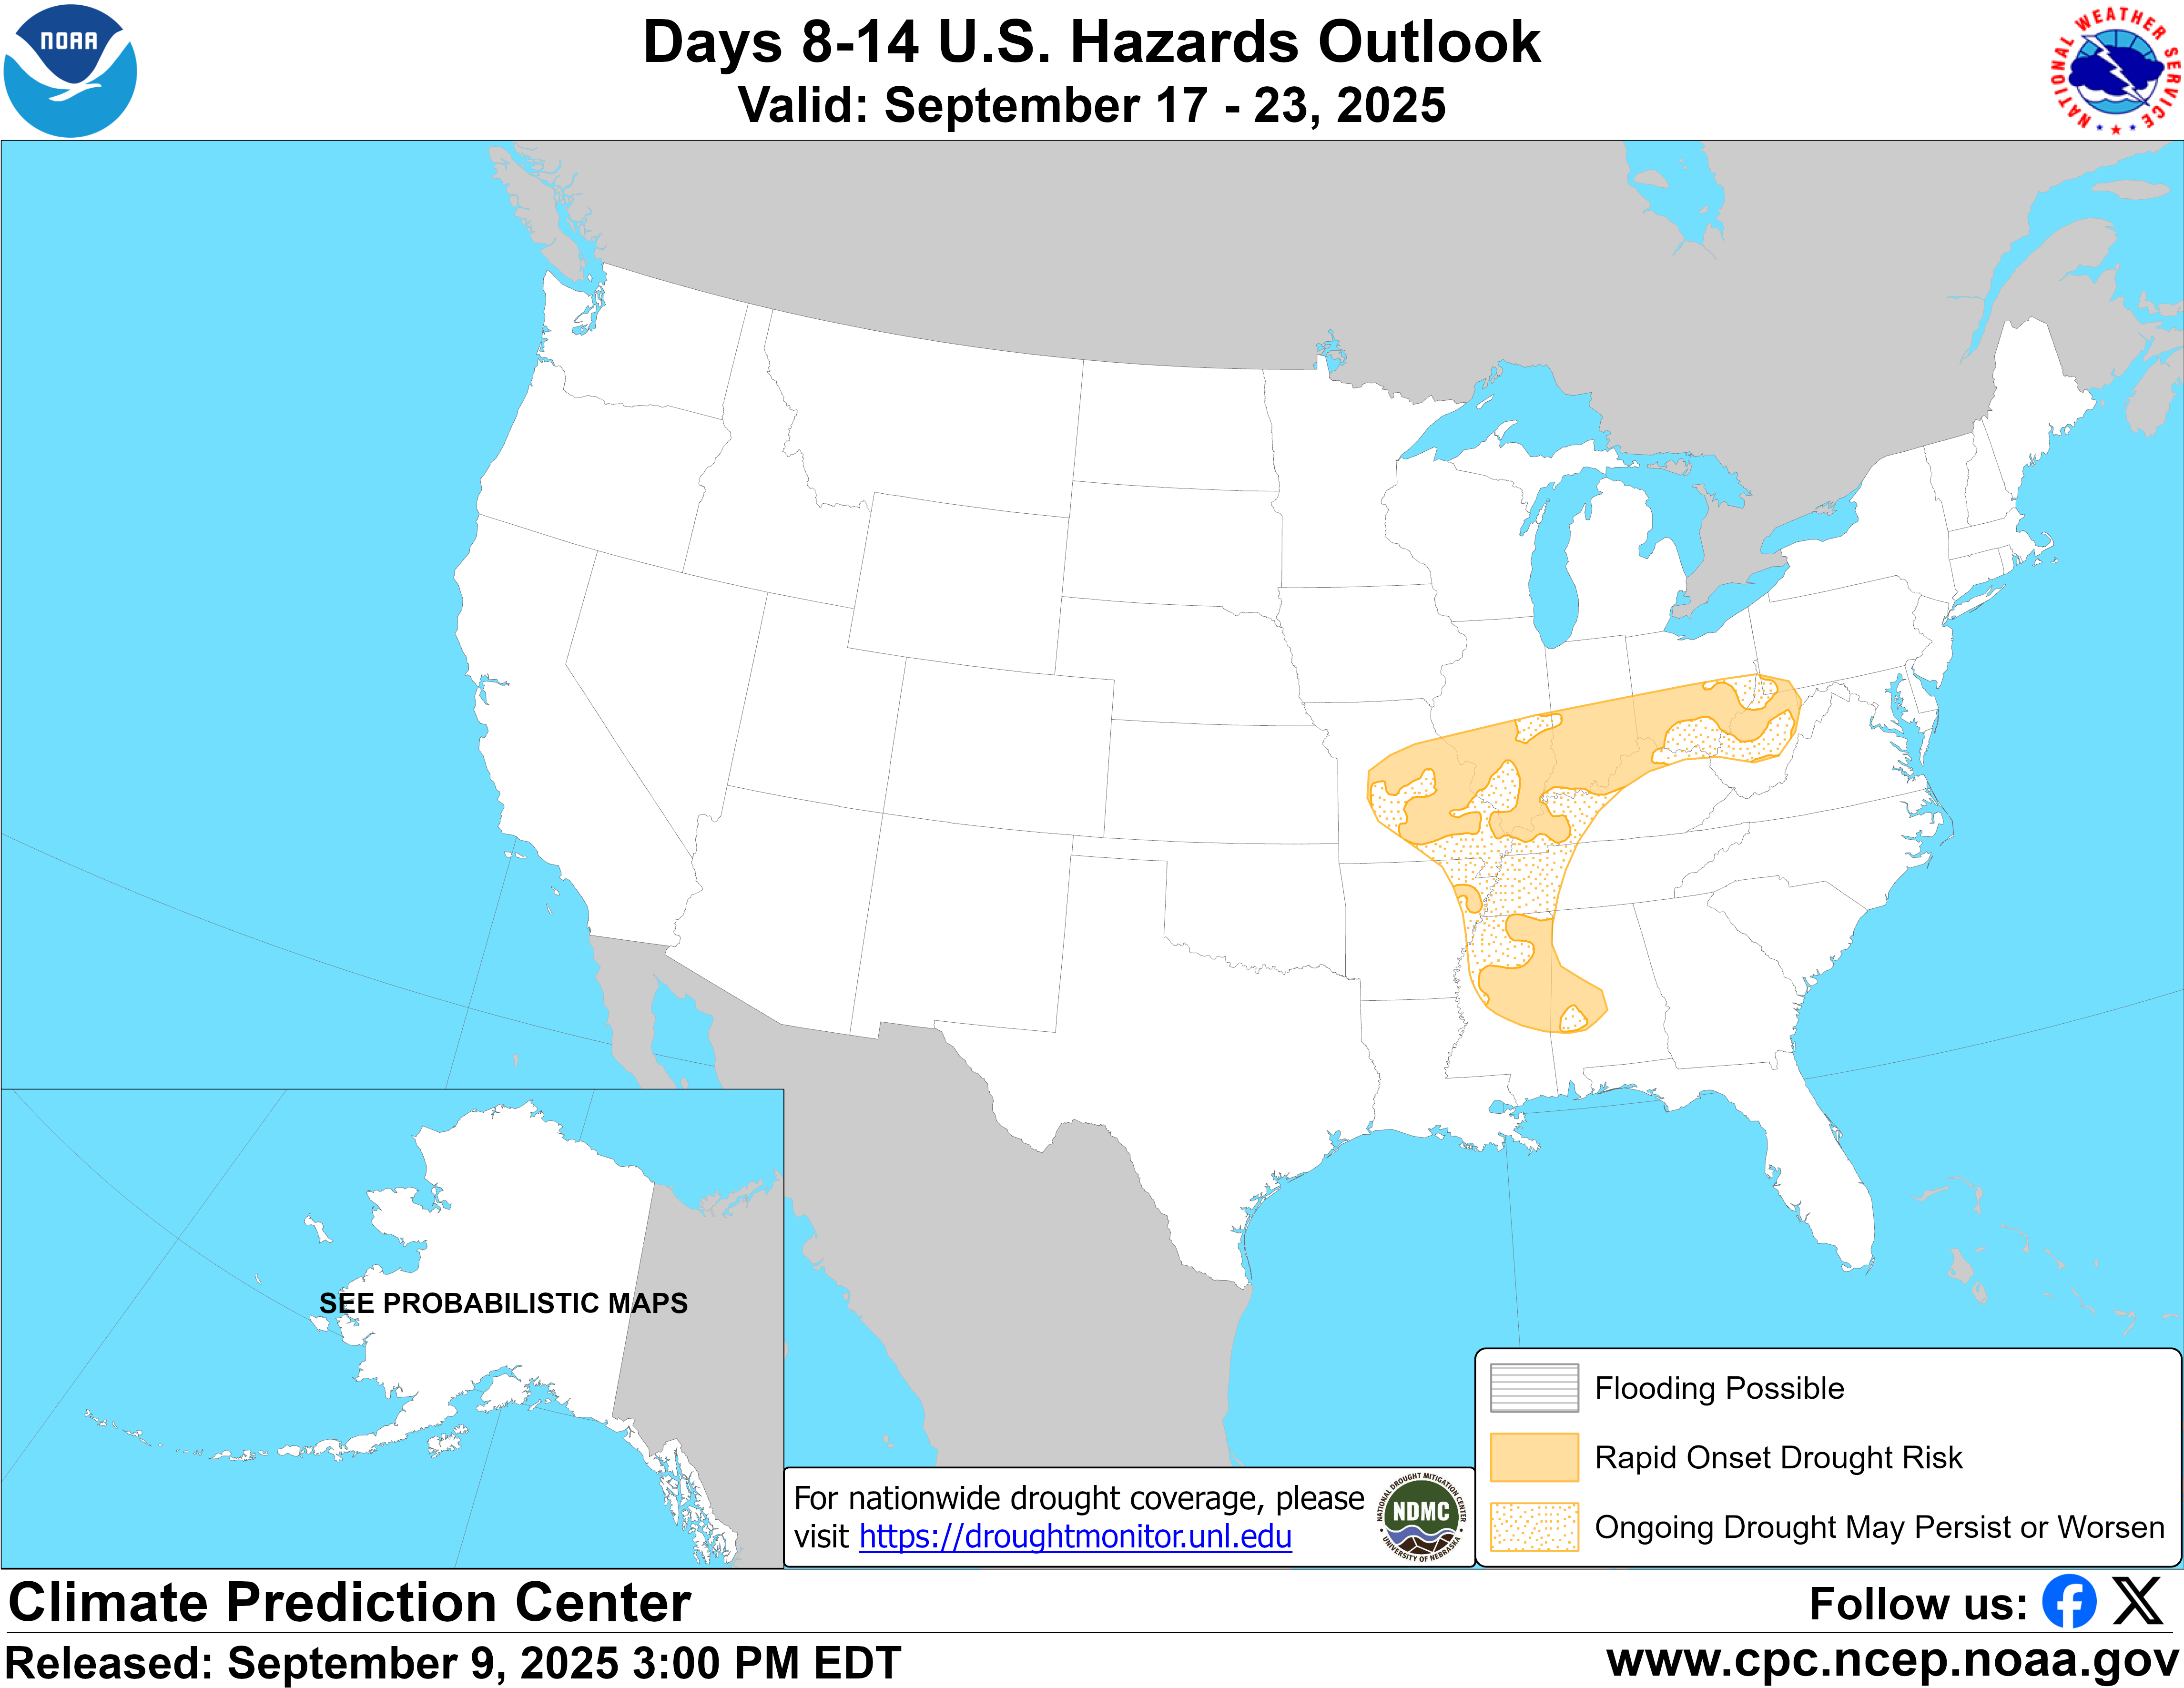
https://www.cpc.ncep.noaa.gov/products/predictions/threats/hazards_d8_14_contours.png

Earth to NWS, earth to NWS, have you looked at the soil moisture and weather closely the past month??
+++++++++++++++++++++++++
NEW LINK:
https://www.drought.gov/current-conditions
August 27, 2025 - September 2, 2025
FLASH DROUGHT!!!!
DROUGHT MONITOR
https://droughtmonitor.unl.edu/
Flash Drought has spread rapidly!
+++++++++++++
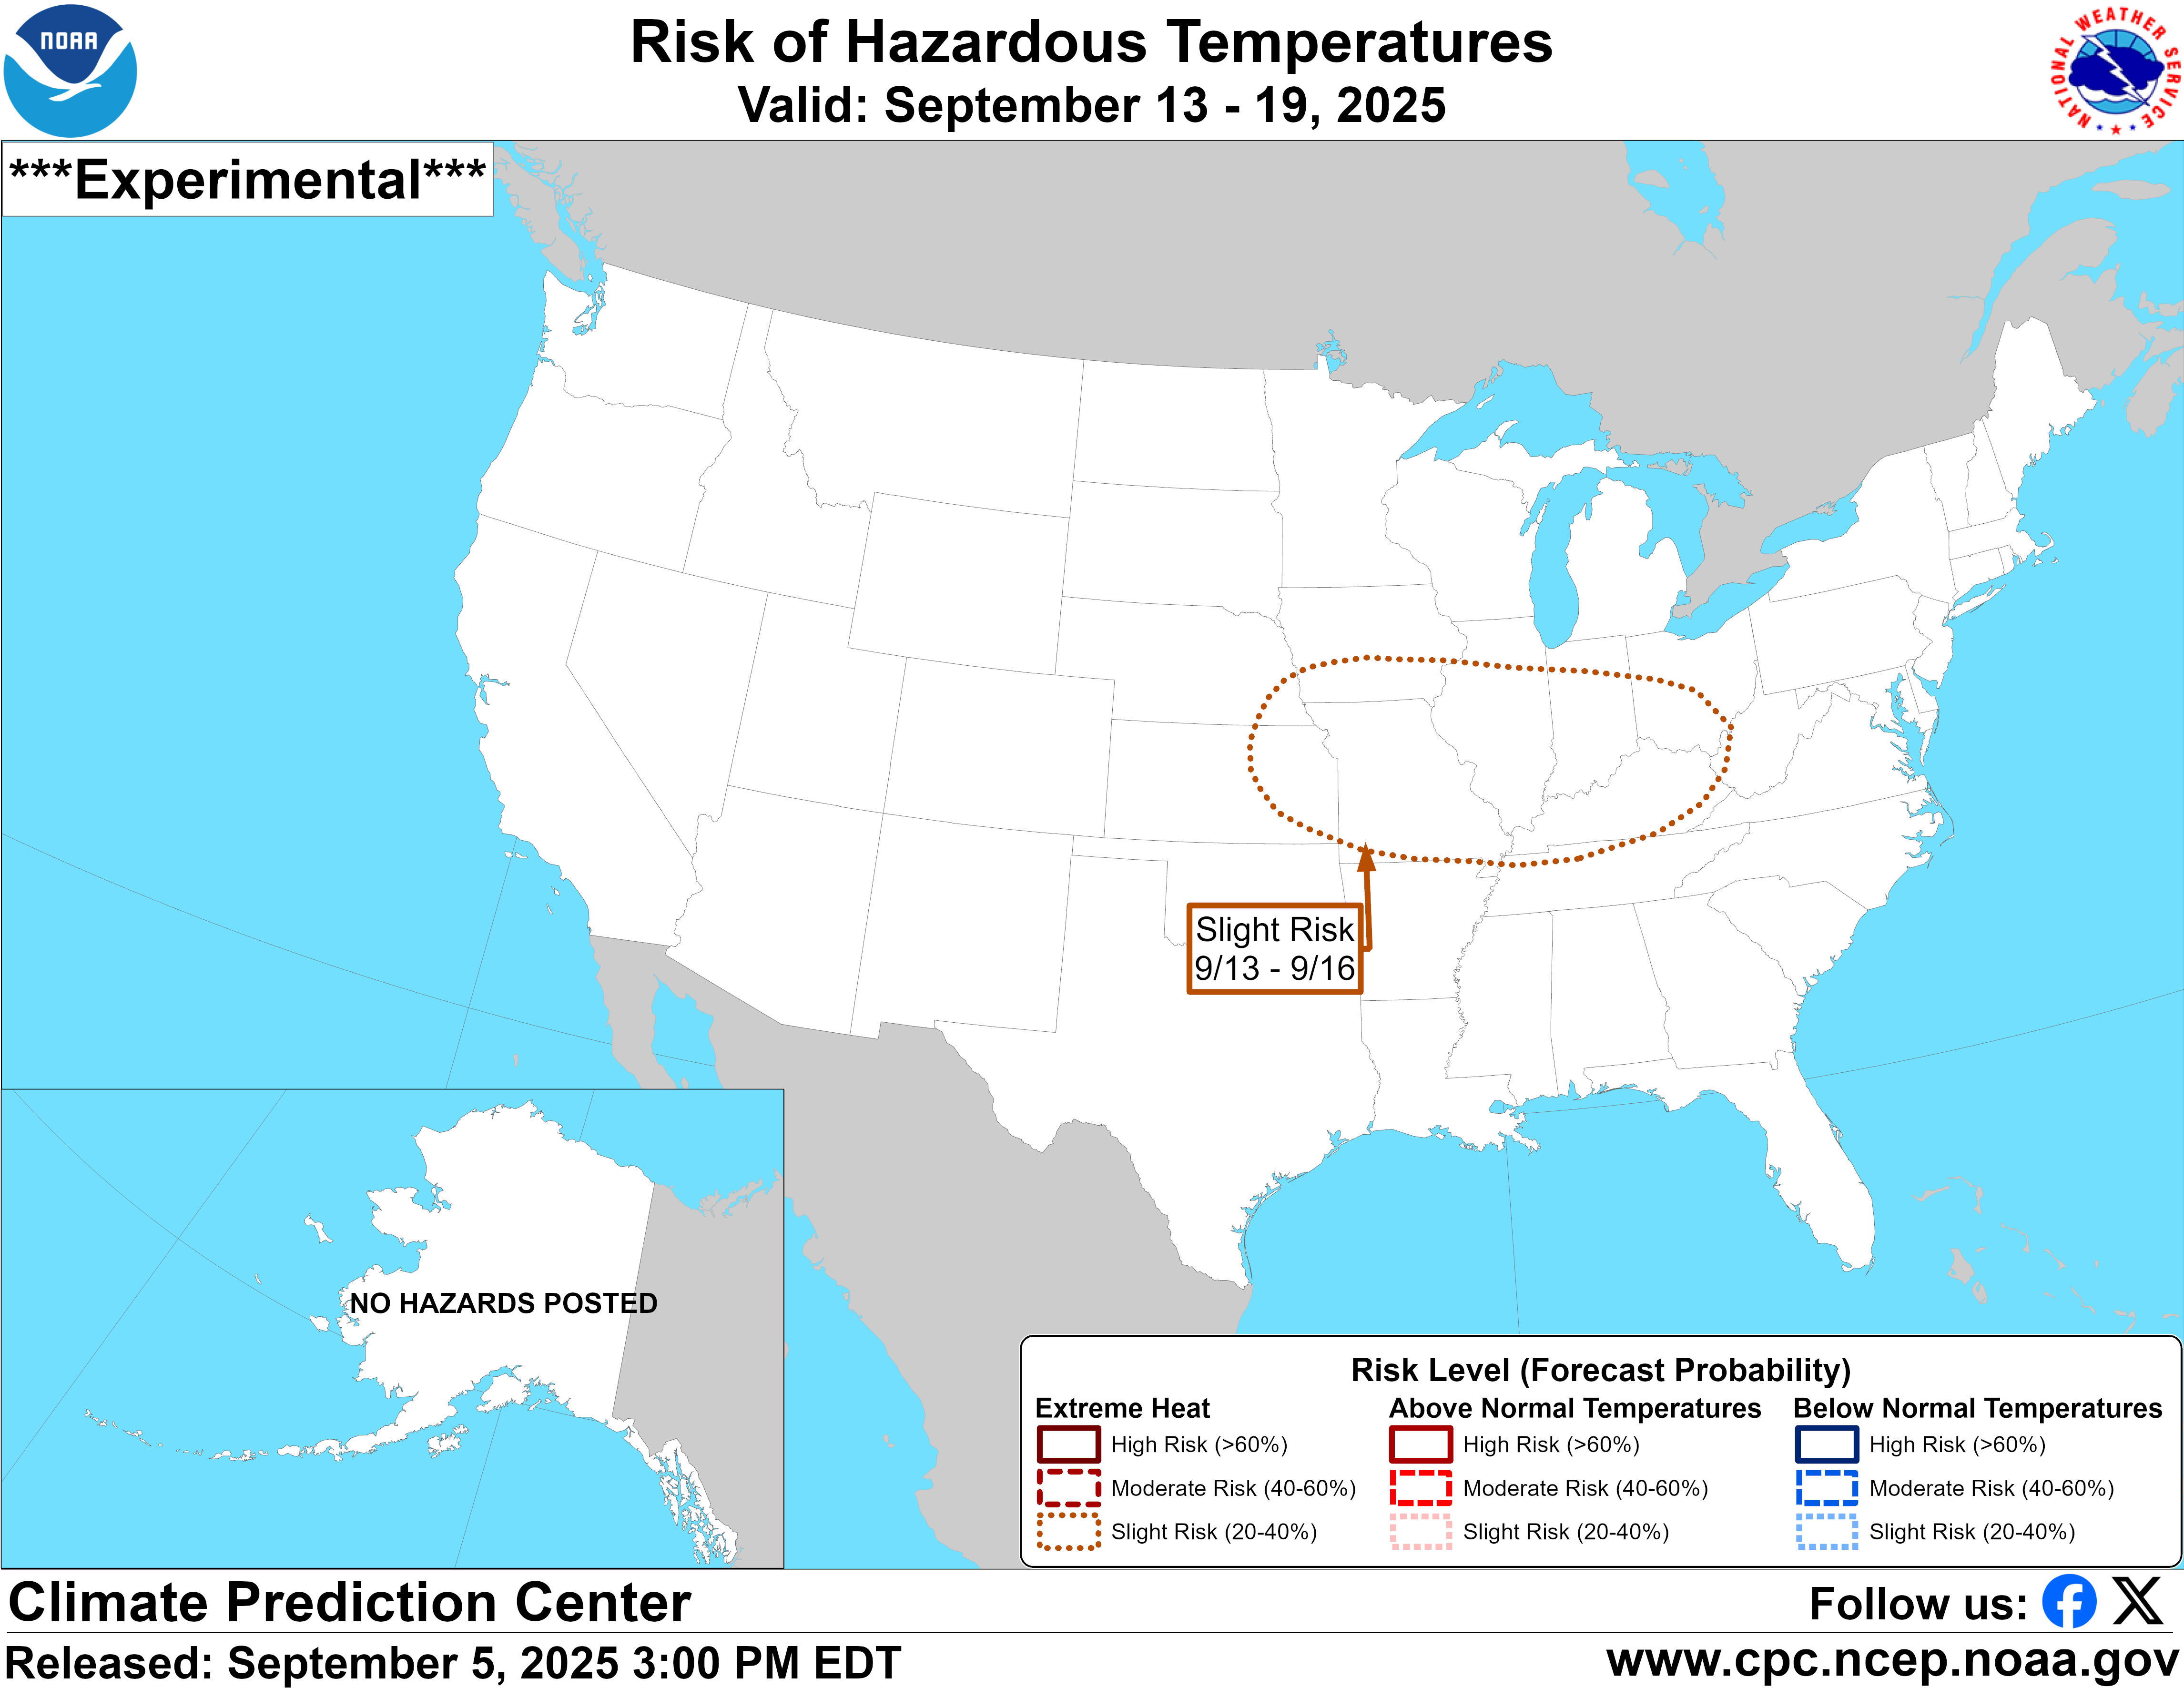
https://www.cpc.ncep.noaa.gov/products/predictions/threats/temp_probhazards_d8_14_contours.png

A brief window with rain chances along the Ohio River late today/tonight, then dry for a LONG time.
New radar product below
Go to: "Select View" then "Local Radar"
Hit the purple circle to see that local radar site
+++++++++++++++++++++++
This link below provides some great data. After going to the link, hit "Mesoanalysis" then, the center of any box for the area that you want, then go to observation on the far left, then surface observations to get constantly updated surface observations or hit another of the dozens of choices.

Found a great new link/site that shows us how much precip fell(from 1 hr to 72 hours) for different periods to share with you.
https://www.iweathernet.com/total-rainfall-map-24-hours-to-72-hours
Data Update Cycle: The 1-hr mosaic is updated every 5 min (approx). All other mosaics are now updated hourly, including the 48h and 72h maps.
The site does not allow me to copy the actual images/data here, as we do with all the other links above..........so just go to the link!
By metmike - April 30, 2022, 8:33 p.m.
1. Weather map now.
2. In 24 hours and
3. In 48 hours.
https://www.wpc.ncep.noaa.gov/#
+++++++++++++++++++++++++++++++++++++++++++++++++
Surface Weather maps for days 3-7 below:
https://www.wpc.ncep.noaa.gov/medr/medr.shtml
+++++++++++++++++++++++++++++++++++++++++++
The latest 7 day precip forecasts are below.
Day 1 below:
http://www.wpc.ncep.noaa.gov/qpf/fill_94qwbg.gif?1526306199054
Day 2 below:
http://www.wpc.ncep.noaa.gov/qpf/fill_98qwbg.gif?1528293750112
Day 3 below:
http://www.wpc.ncep.noaa.gov/qpf/fill_99qwbg.gif?1528293842764
Days 4-5 below:
http://www.wpc.ncep.noaa.gov/qpf/95ep48iwbg_fill.gif?1526306162
Days 6-7 below:
http://www.wpc.ncep.noaa.gov/qpf/97ep48iwbg_fill.gif?1526306162
7 Day Total precipitation below:
http://www.wpc.ncep.noaa.govcdx /qpf/p168i.gif?1530796126
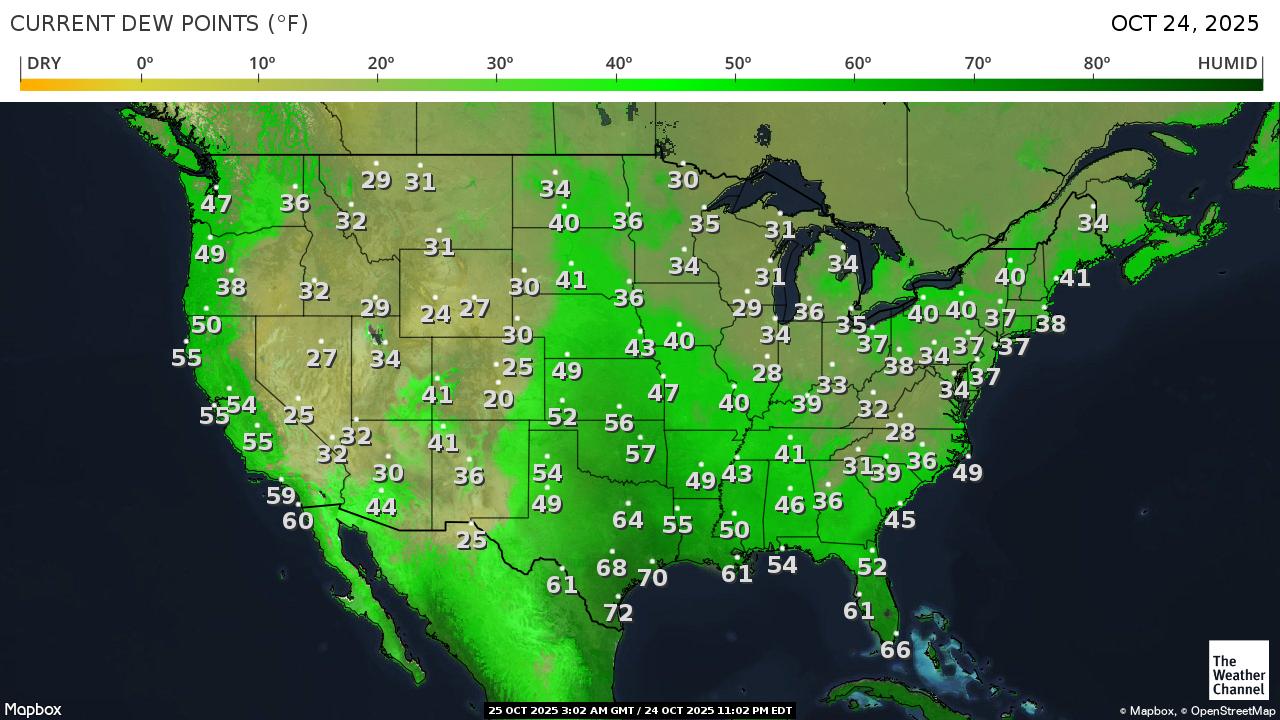
The really humid air/moisture is barely making it up to the Ohio River right now. North of that, its extremely dry which is why this approaching system won't have the moisture it needs in most of IL/IN.
https://thermastor.com/dew-point-and-weather-maps/
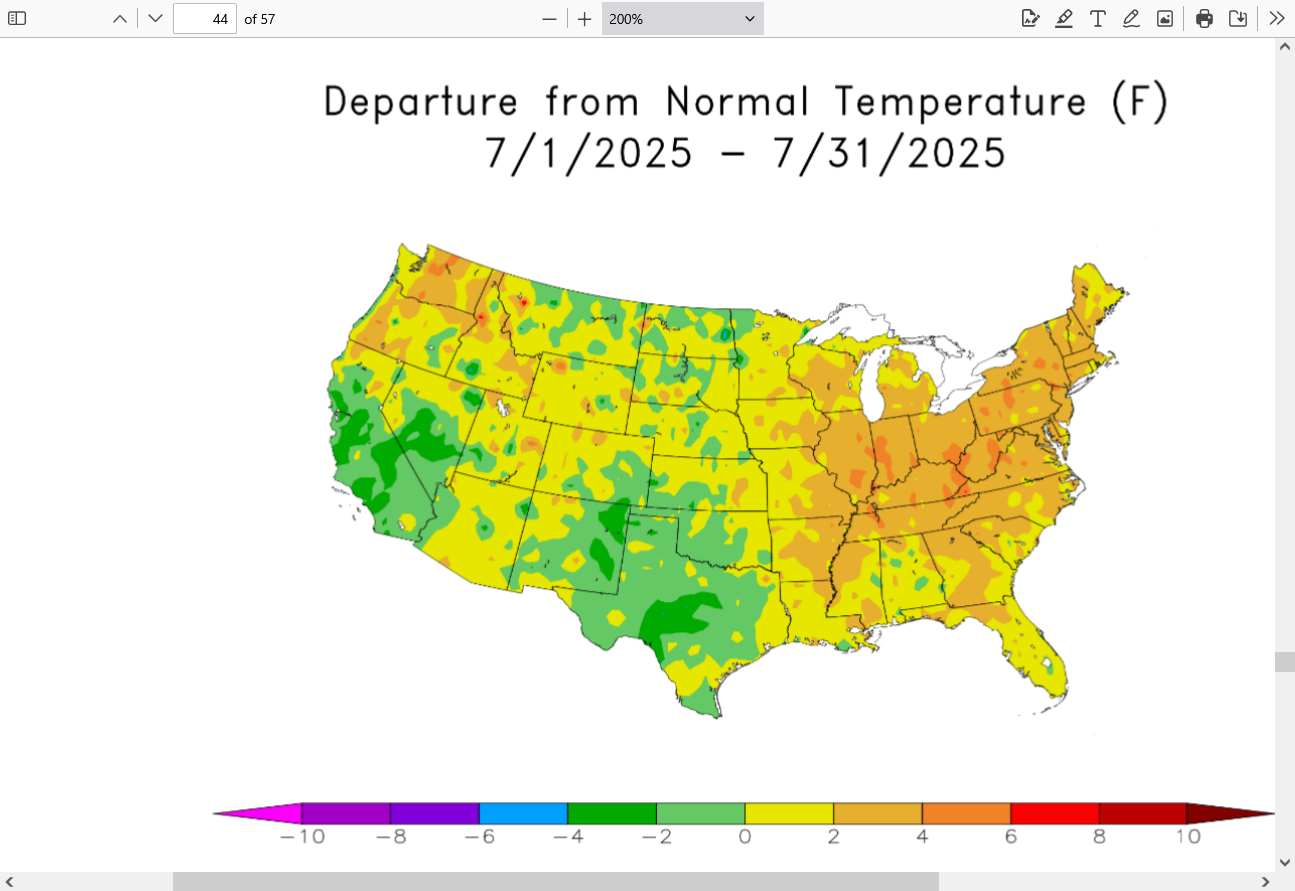
Looks at the incredible temperature contrast for September 5th!! This map includes the "feels like" temps.
Near 100 degrees south of the cold front!
40's around Lake Superior to the far north, deep into the cold air!!
https://www.mesonet.org/weather/air-temperature/national-wind-chill-heat-index
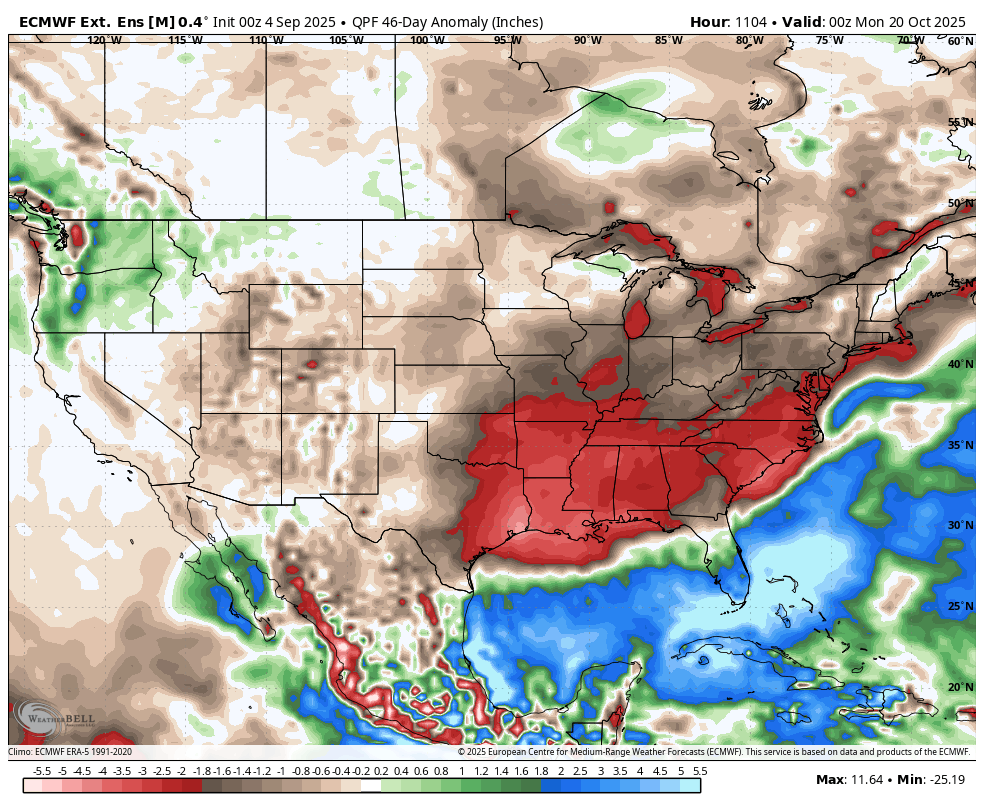
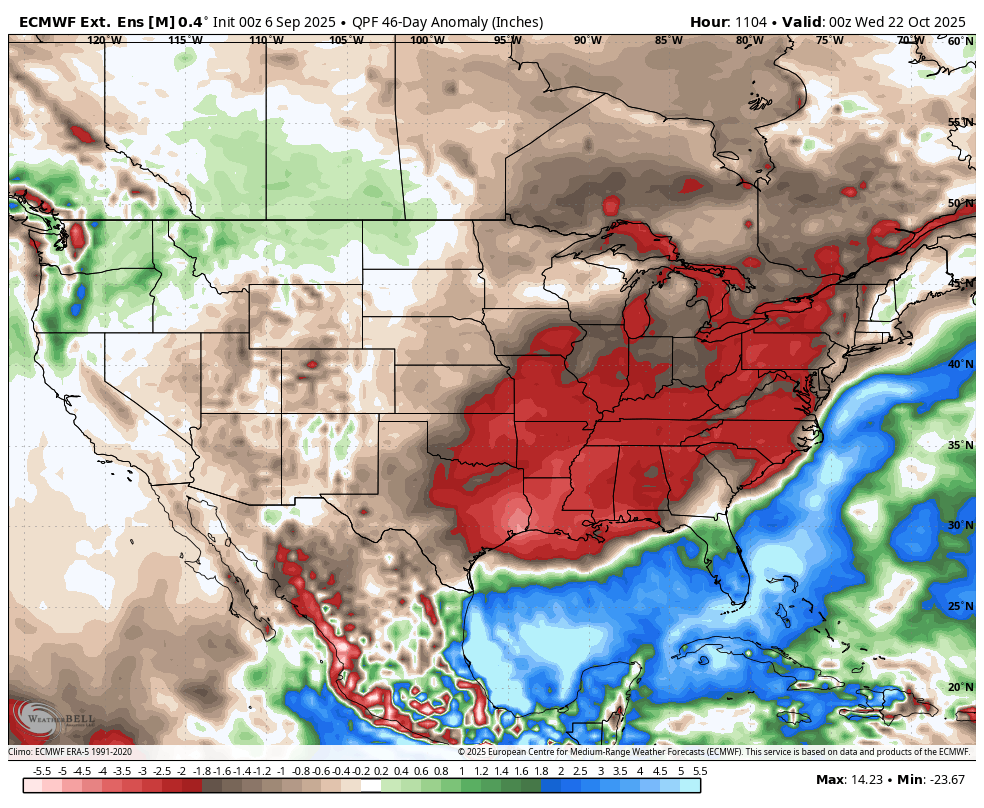
This was the 46 day rainfall anomaly from the latest European Ensemble mean.
Flash drought will be WIDESPREAD over a huge area by early October, especially considering this area will see above temps/drying rates starting next week!
The dry finish to the corn/beans growing season has lowered yields by a couple of bushels compared the records predicted by the USDA in August.
This dry finish and heat will cause rapid maturity and bean producers will want to harvest quickly to avoid excessive dry down that results in bean pods cracking and yield losses. Also from low moisture(reduced delivery weights).
So expected harvest pressure from this massive crop is already pressuring prices!
This exact same thing happened last year(2024)!!
https://www.canr.msu.edu/news/harvest_considerations_for_overly_dry_soybeans
Eric Anderson, Michigan State University Extension -
If these predictions hold true, soybeans will finish and dry down rapidly, and moisture levels can easily drop below 10%. Reports from local elevators have come in already of beans arriving at 9% moisture. This increases the potential for shatter losses, higher discounts due to split beans and reduced delivery weight. When moisture levels fall below 10%, producers will need to decide if they should harvest the overly dry soybeans or wait for rain to add some moisture back into the beans. This is an individual decision. This article will provide information that should help guide this decision.
Advantages of continuing to harvest overly dry soybeans:
The main advantage of delaying harvest and waiting for rain is that the net value of each bushel harvested may be increased (see Table 1). However, there is some risk associated with this strategy. Harvest losses may increase as soybean pods typically become more brittle with each wetting and drying cycle. Today’s varieties are more resistant to shattering, but the risk increases with repeated wetting and drying cycles.
Corn dry down in the field has a bit different considerations!
The biggest risk is that corn stalks will weaken with time and are vulnerable to high winds events that can flatten them. High winds are more likely the deeper into the cold season we get, although any strong thunderstorm can cause 50+ mph gusts at any time of year.
Regardless, the drying rates will be elevated, starting next week and the corn crop is likely to dry down quickly and harvest early. So expected harvest pressure from this massive crop is already pressuring prices!
https://www.agry.purdue.edu/ext/corn/news/timeless/graindrying.html
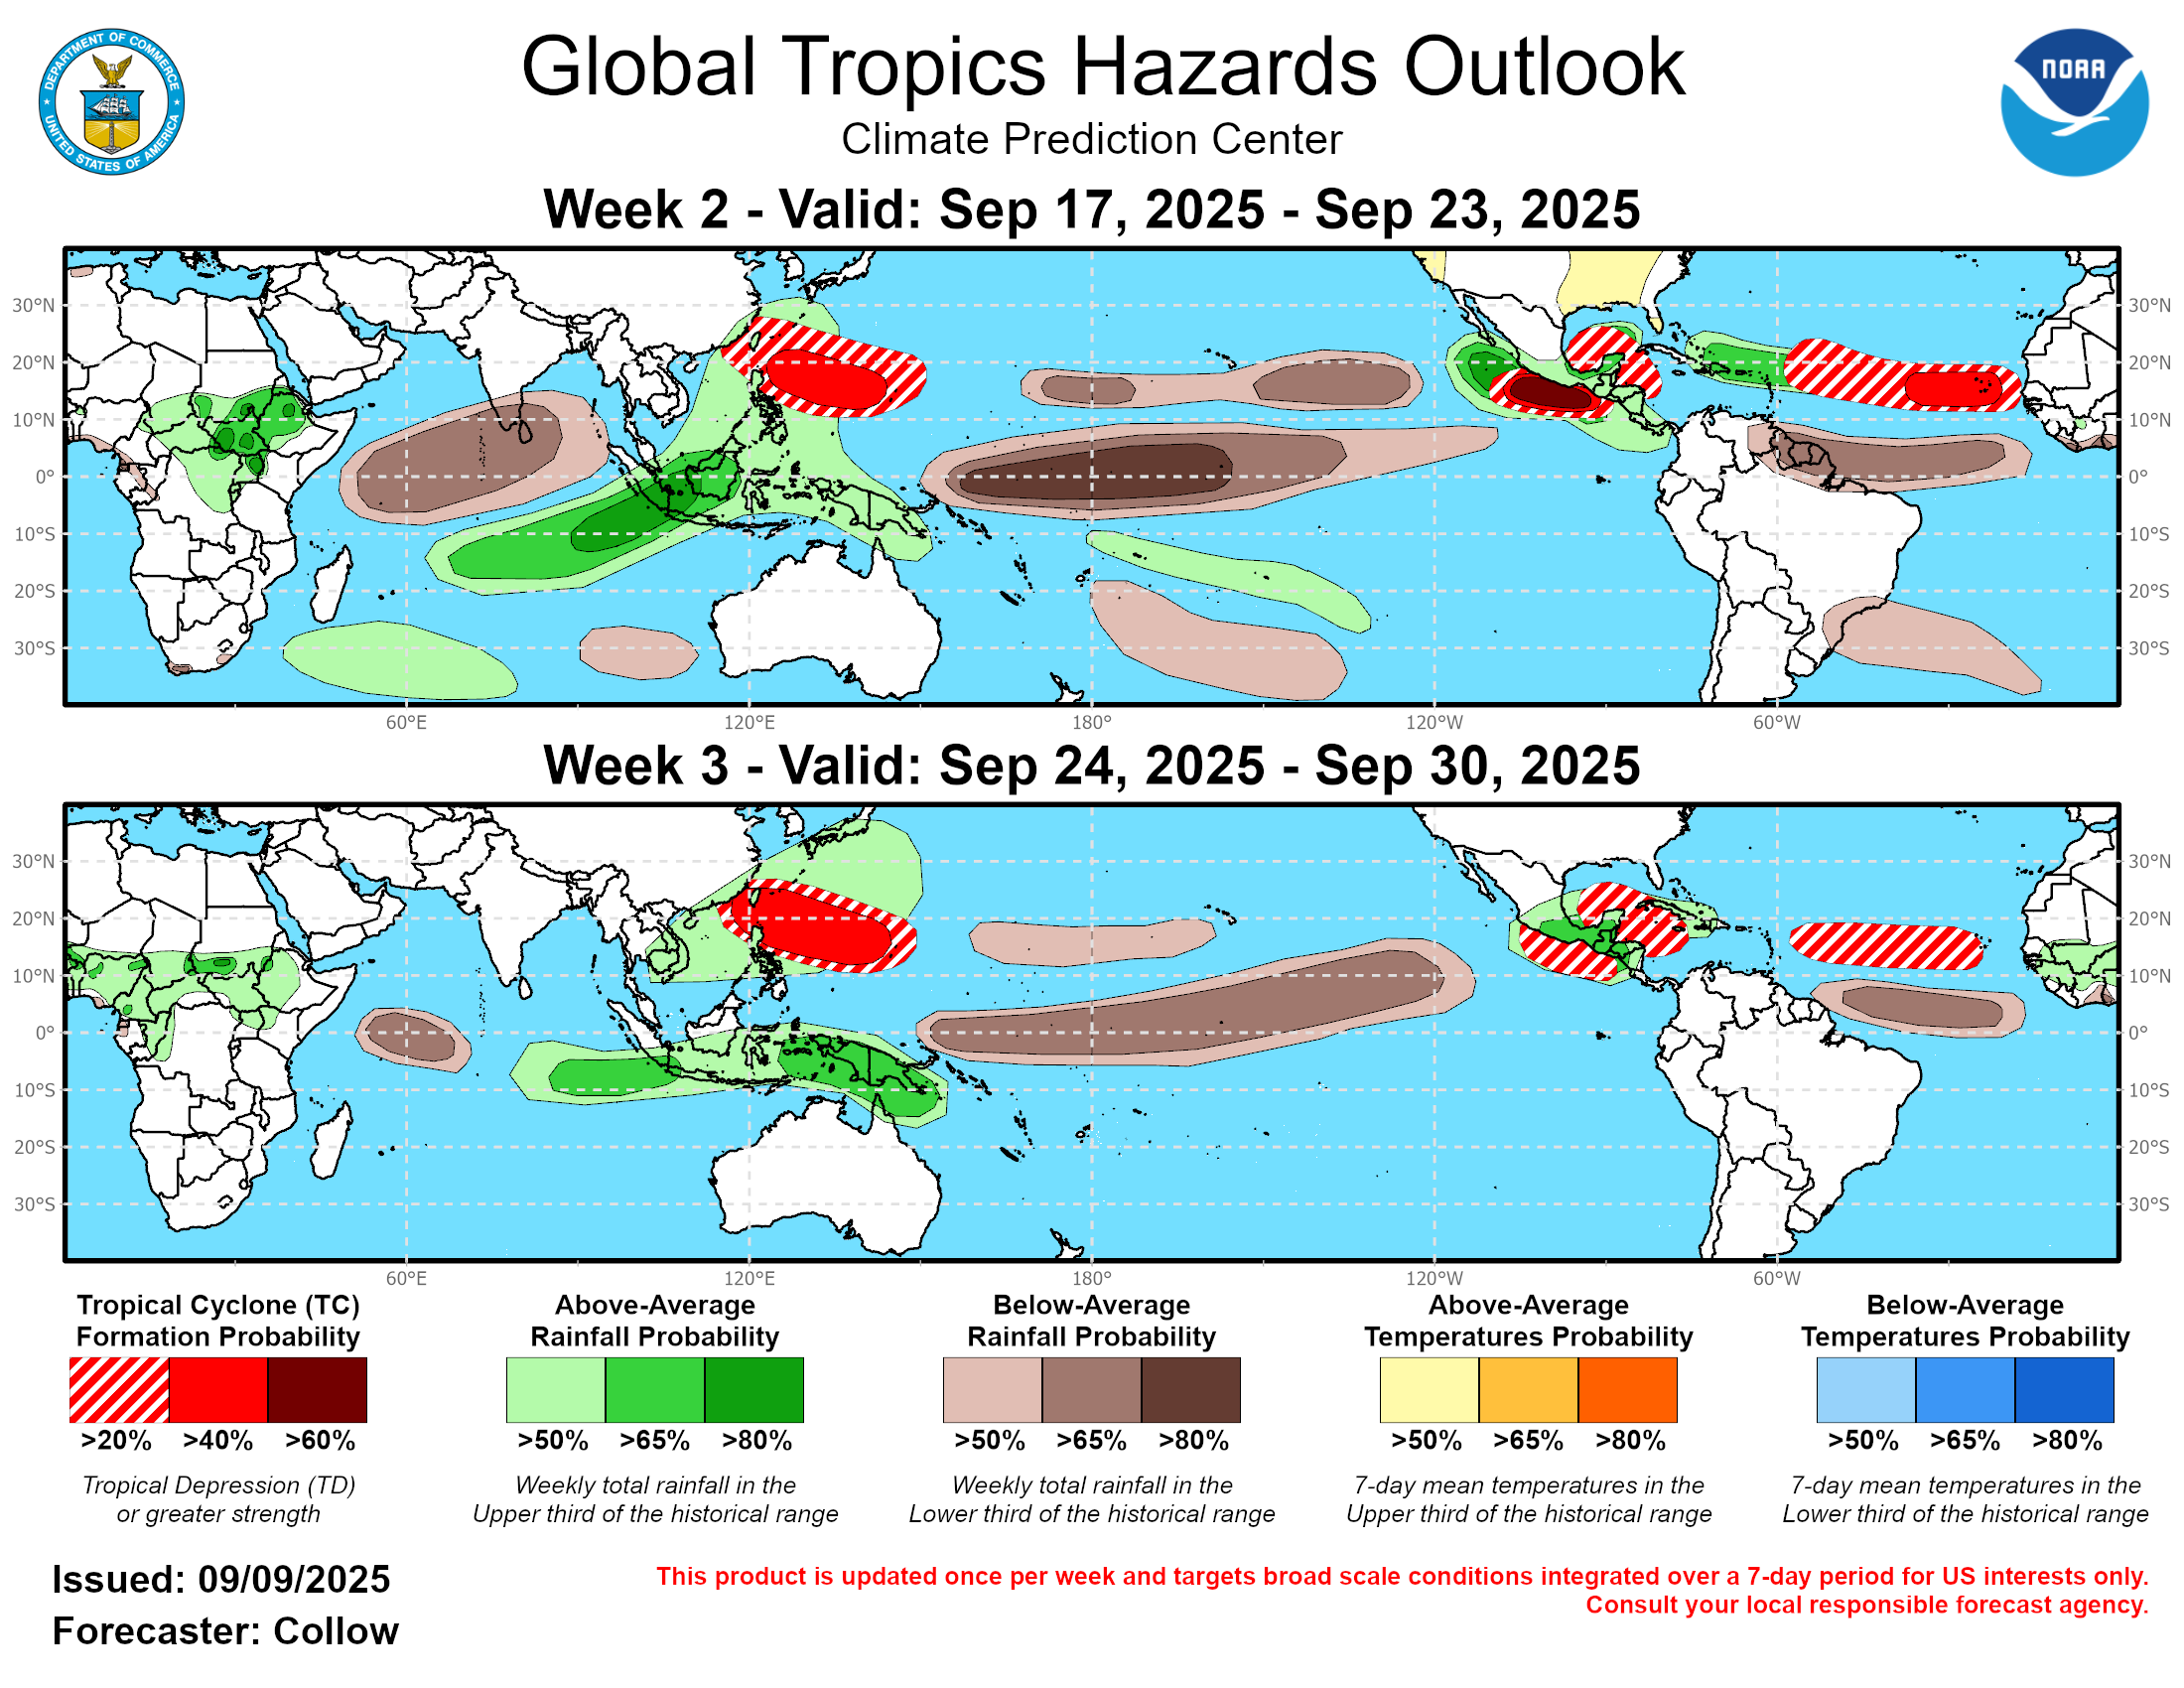
The upcoming very dry pattern is likely to last into early October...........along with heat!
https://www.cpc.ncep.noaa.gov/products/predictions/WK34/
We got a few hundreds an hour ago which is slightly better than nothing.
Rains will be sweeping southeast today and that will be the last event for this neck of the woods, possibly for the rest of the month.
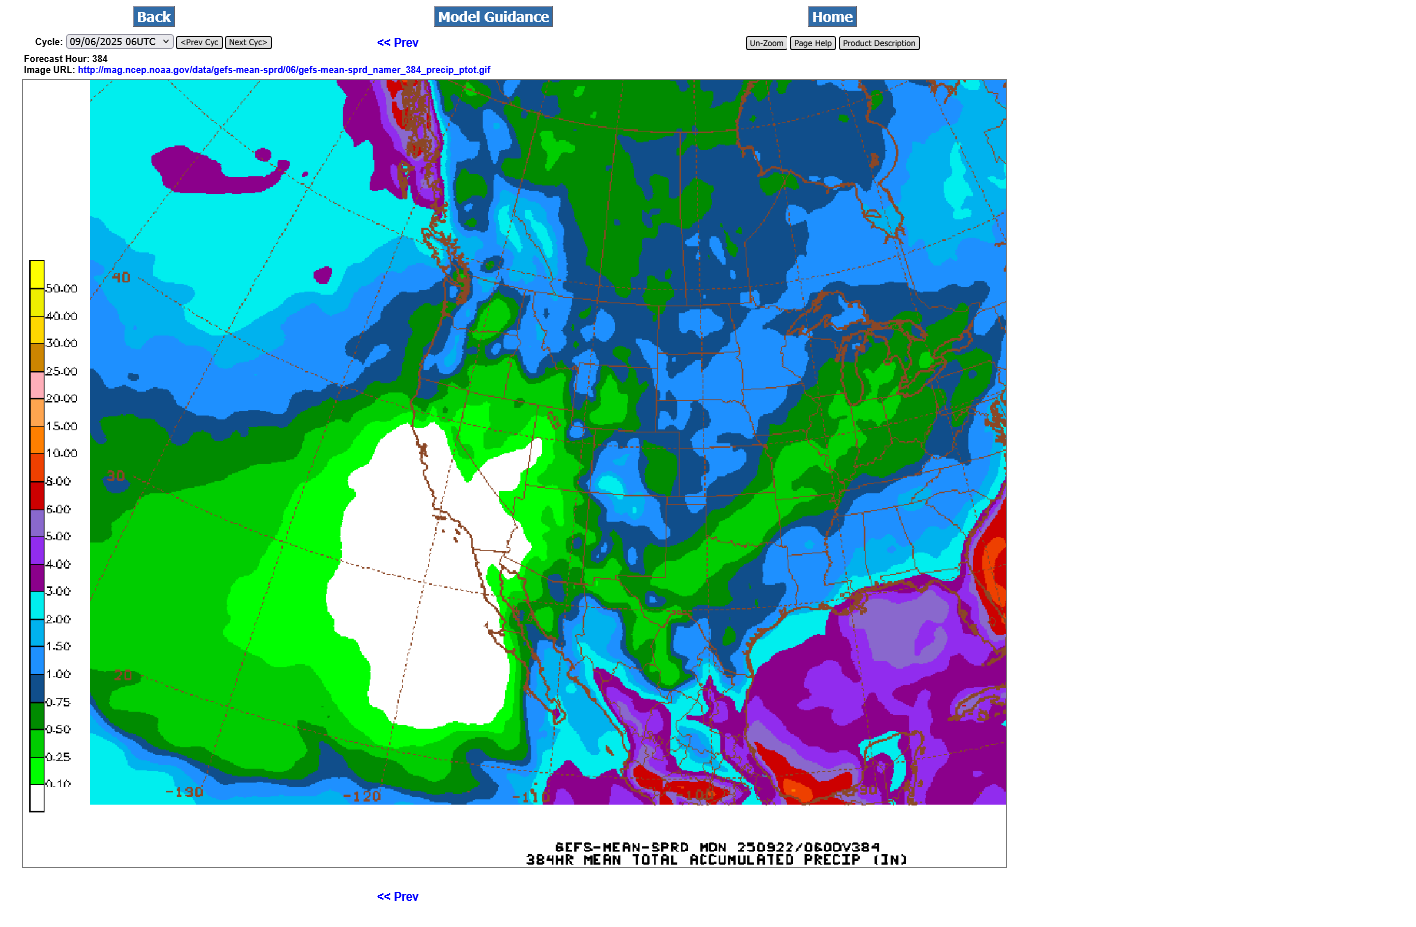
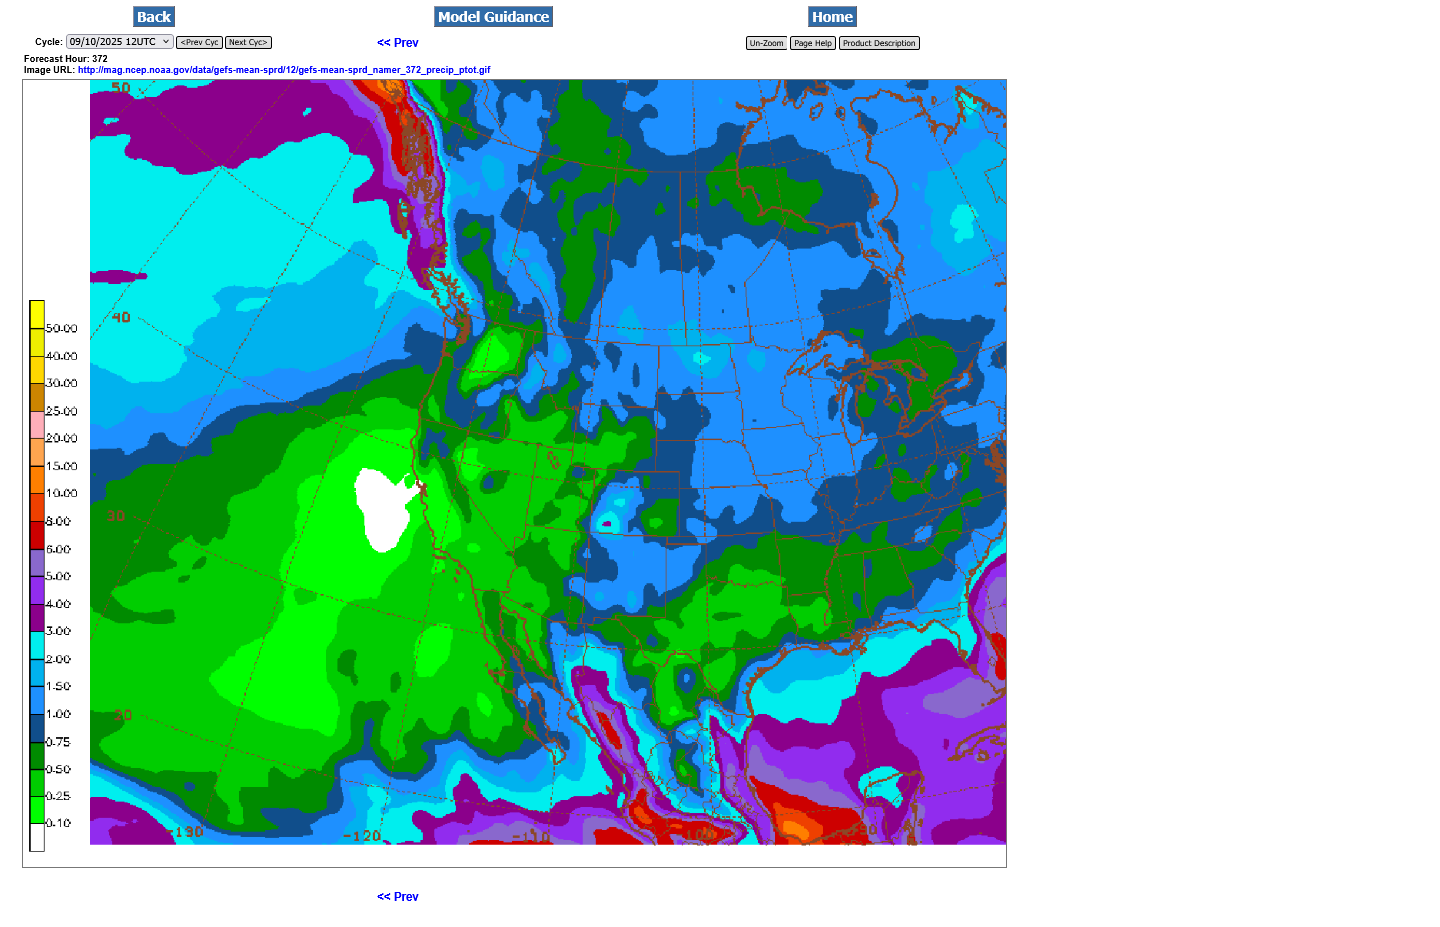
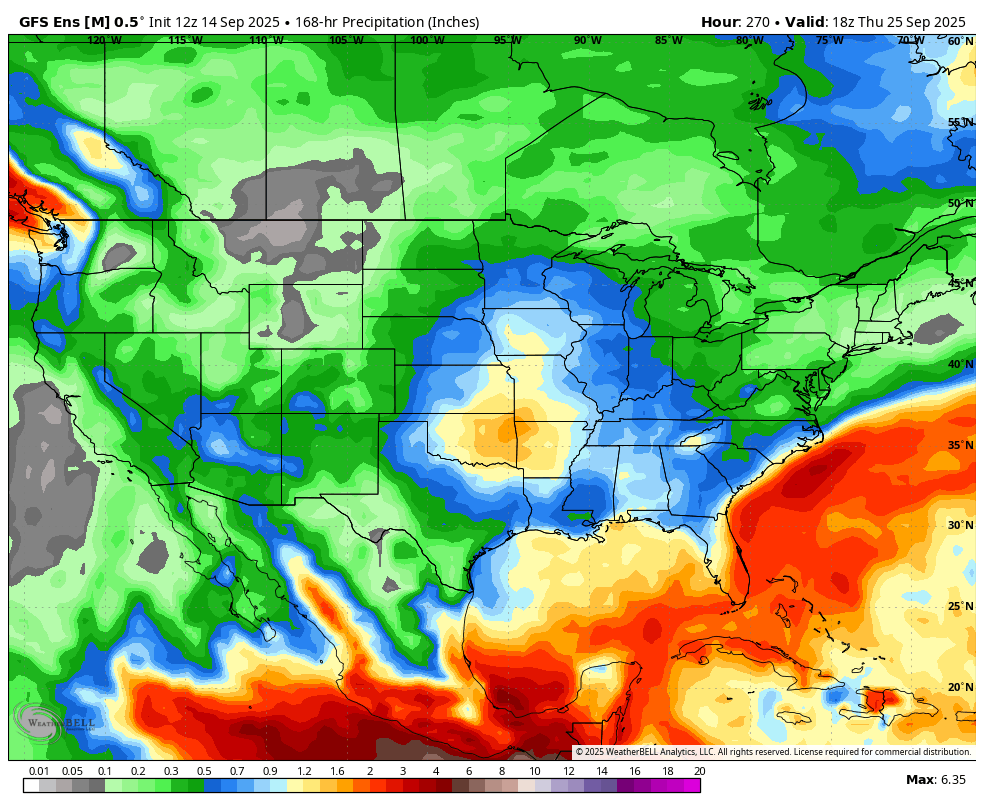
Total rains for the next 16 days from the just out 6z GEFS. This will be in addition to some unseasonably hot weather which means an expanding FLASH DROUGHT!
Excessive heat risk below:
https://www.cpc.ncep.noaa.gov/
I extremely disagree with the NWS's very small area of flash drought.
https://www.cpc.ncep.noaa.gov/products/predictions/threats/hazards_d8_14_contours.png
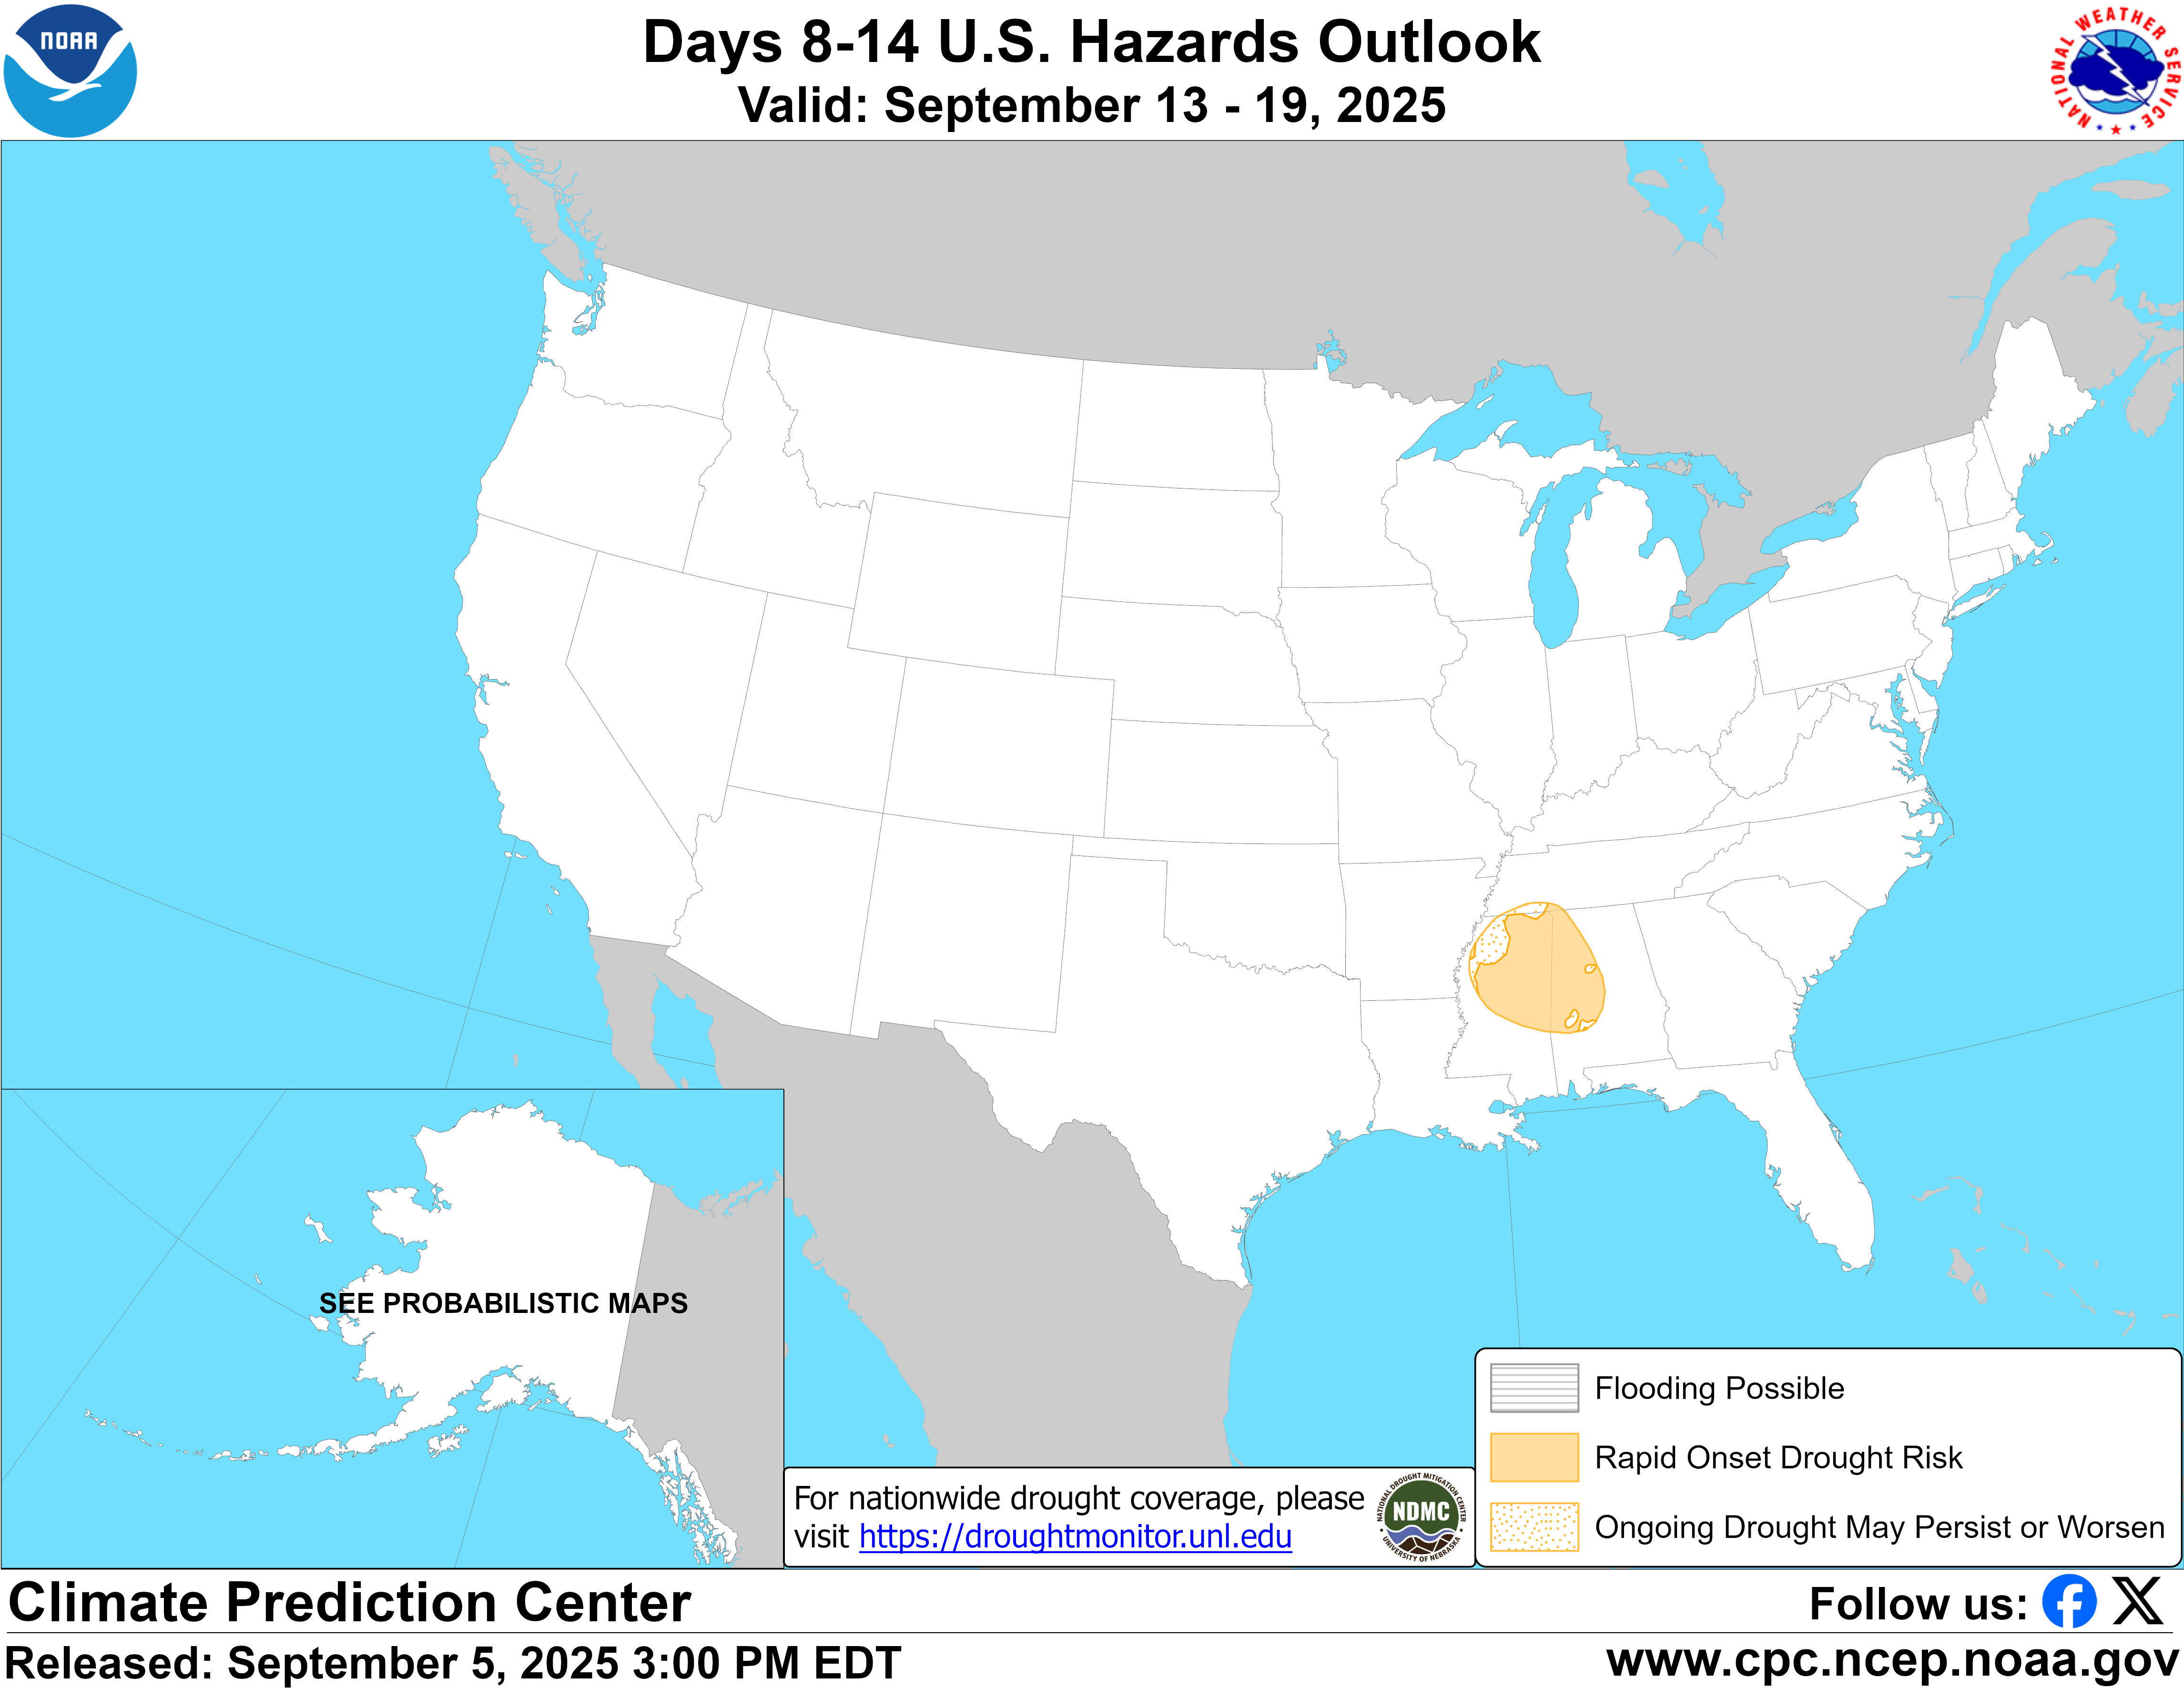
Every area in brown on the map below is at high risk for flash drought the rest of this month! That's because those areas will see:
1. Very little rain
2. Temps well above average
3. Soil moisture will be drying out fast for September(even with the suns angle dropping-which reduces evaporation/drying rates compared to the sun's angle closer to the Summer Solstice). The September 21 sun angle is the same as the March 21 sun angle. The ground/soil and water have warmed up, unlike in March when they are still pretty cold but the actually strength of the sun in September is getting pretty weak.
4. This is actually one reason to plant crops early. The power of the sun is greatest in April-May-June-July-August. It's those months when plants can maximize their ability to accesss solar energy from capturing radiation photons and turning them into chemical energy, stored in the plants from photosynthesis.
LATE planting, in June for instance that shifts the growing season into September has lost the ideal time frame because the suns power starts dropping off after June 21.
https://www.drought.gov/current-conditions
The early planted corn here had roots tapping moisture still during this long dry spell. I'm betting those yields will be huge.
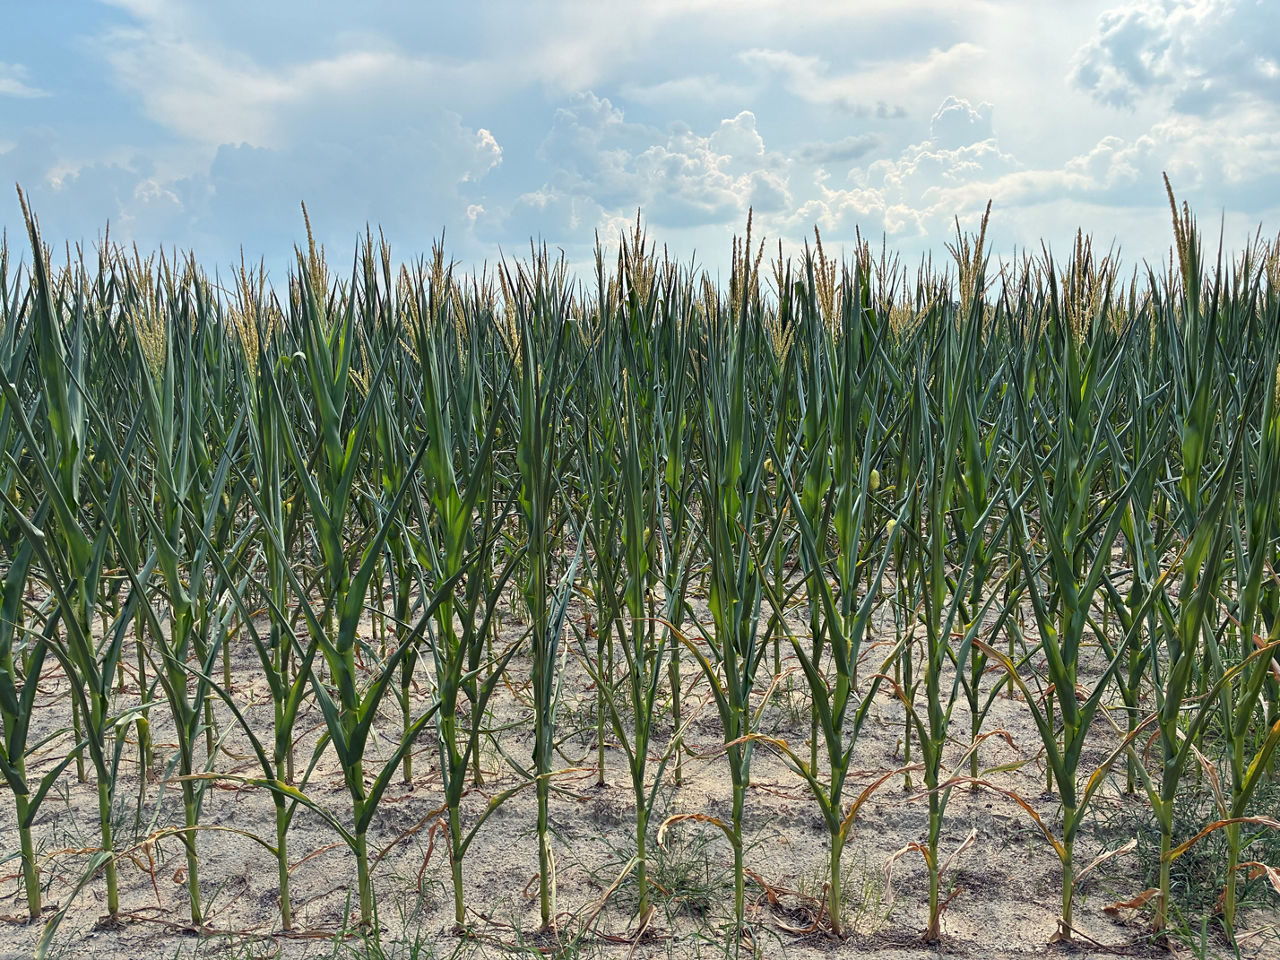
However, I pass by a few fields of late planted corn several times a week. Before this .75" inch rain here, the plants were just 5 feet high(and at their max) with leaves severely curled up.
ALMOST EXACTLY like this too, except a few weeks farther along on maturity with pollination over!
After the rain, the leaves were no longer curled up but that corn field is evidence of the risk of super late planting when soil moisture dries up in the 2nd half of the growing season. If the vertical soil moisture profile dries up to below the root zone, the plant dies out.
Early planted corn with super deep roots can extend a couple feet deeper and still tap moisture.
I think it was planted in early June.
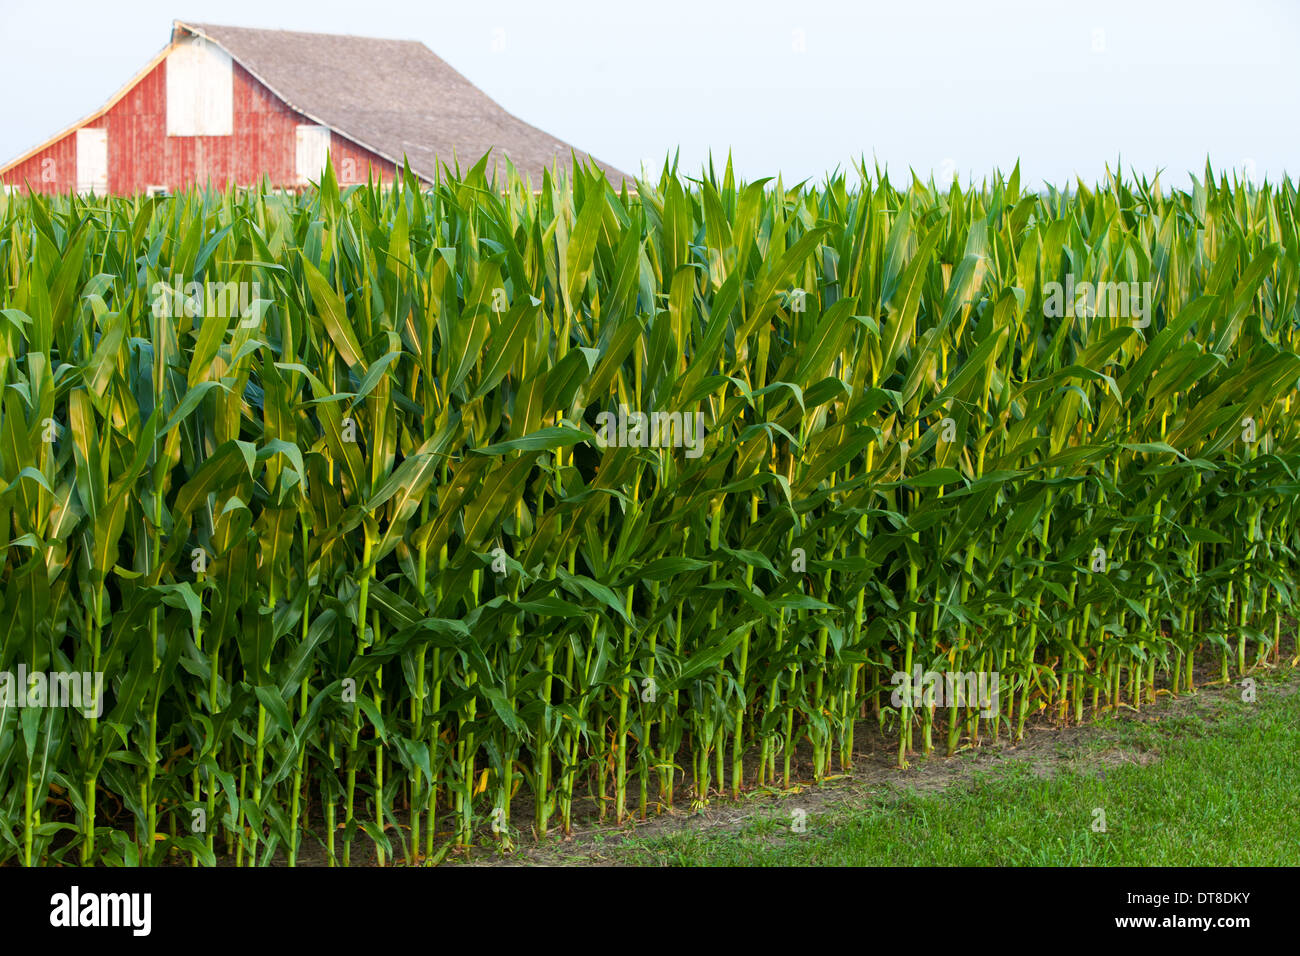
Fields planted 6+ weeks earlier(April), at the same stage looked like this below 6+ weeks ago. They are drying down and brown now and will be ready for harvest soon.
The main difference between crops that looked like the image above vs the image below, within 5 miles of my house, in an August with almost no rain was the planting dates!!!
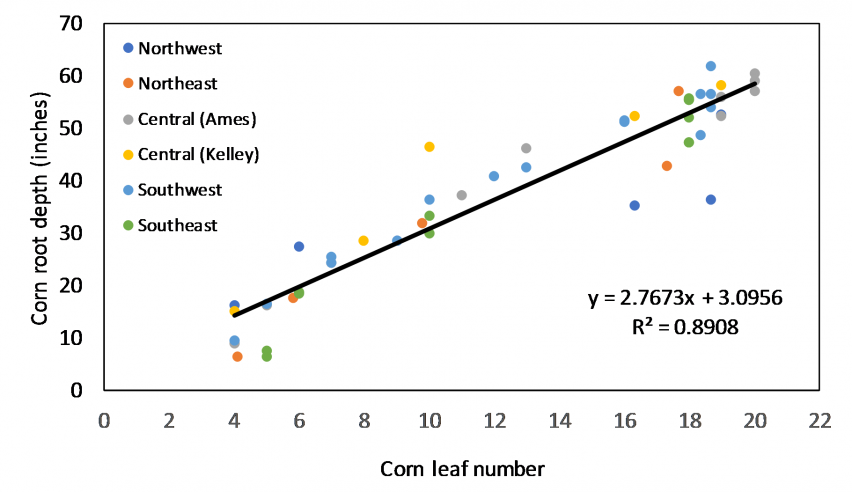
https://crops.extension.iastate.edu/cropnews/2017/06/how-fast-and-deep-do-corn-roots-grow-iowa
In 2016, the FACTS team collected root depth measurements at critical crop stages in six corn fields across Iowa. Measurements were taken on the row and at the center of two 30-inch rows. These fields had different treatments such as planting date and tile drainage. Results indicated that root depth increased over time consistently across sites and treatments. On average, corn roots grew about 2.75 inches per leaf stage to a maximum depth of 60 inches (Figure 1). Going into more specifics, corn roots initially increased at a slow rate (0.29 in./day) up to 5th-leaf and from then on with a rate of 1.22 in./day until silking stage when maximum depth is reached.
Other important findings from this work are:
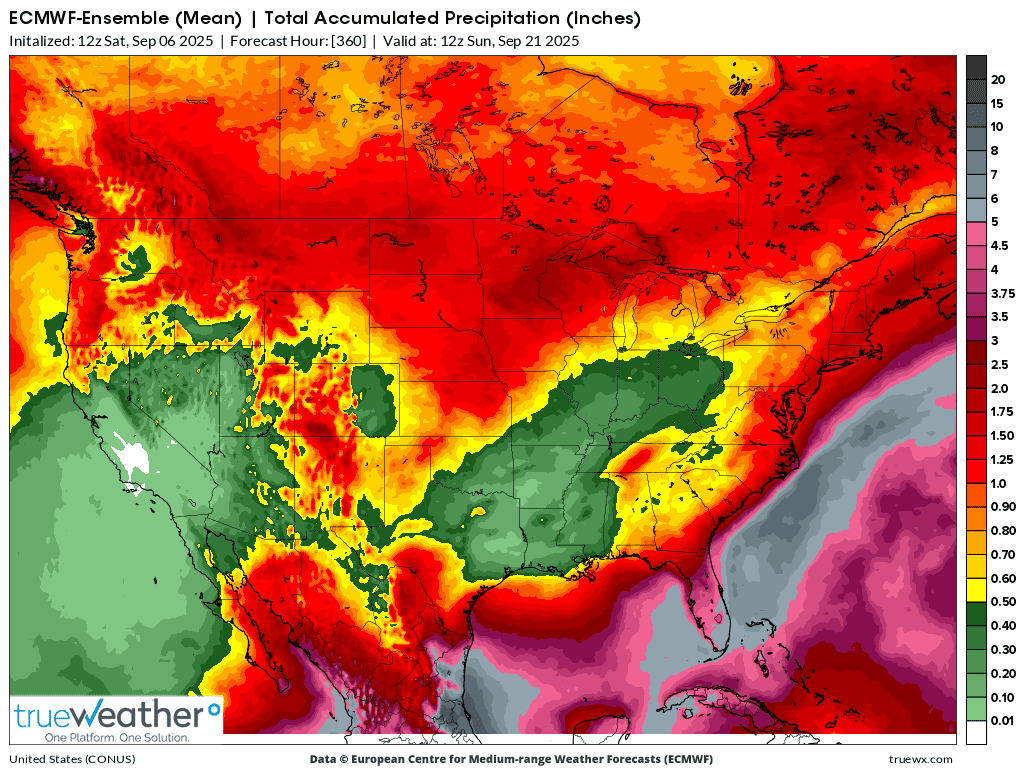
This was the rain forecast for the next 15 days from the last 12z European Ensemble model.
FLASH DROUGHT for most of the green area!
Beans that are still green in that area will probably lose a few more bushels during the last couple weeks of pod fill but its getting pretty late to matter much in that area.
Late kernel filling on late planted corn that will mature extra fast with the heat will be a minor factor.
If anything, it will dry the crops down REALLY FAST and cause early harvest to progress very fast in the FLASH DROUGHT areas.
This was the last European Ensemble model 46 day rain departure forecast. Pretty dry over the eastern half of the country.
The reds are 2"+ less than average rains which is less than 50% of the average in most cases. Some of the areas are even much drier than that. The best we can hope for to offset this is the remnants of a tropical system OR a pattern change.
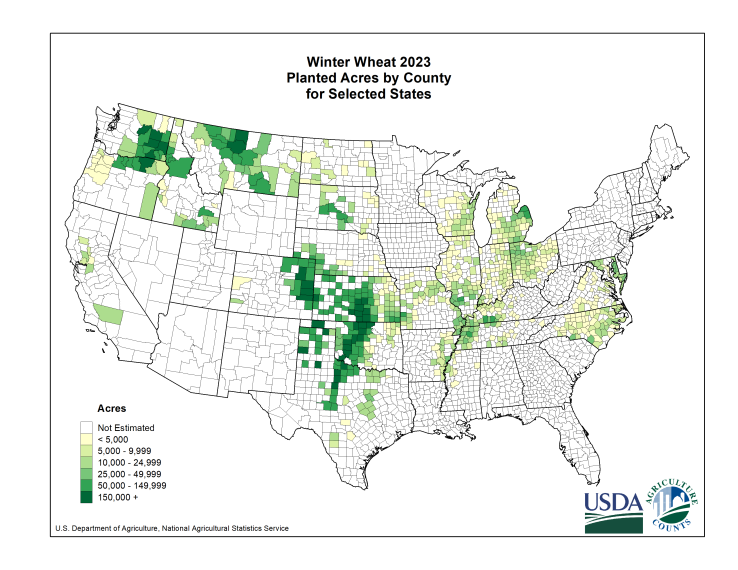
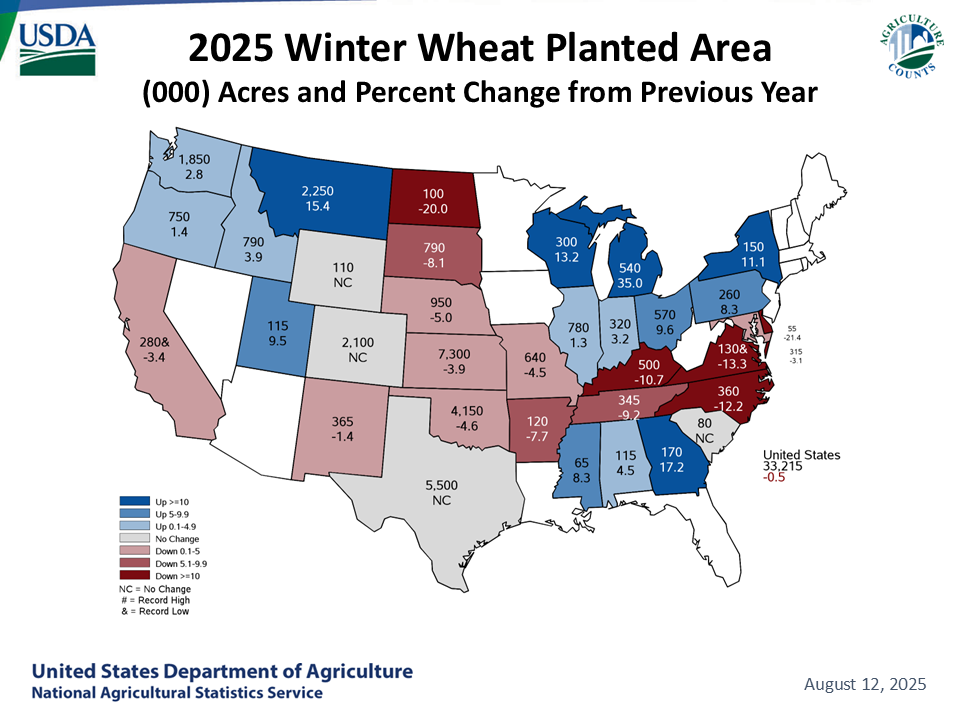
This could get pretty bullish for the SRW crop if it continued thru October. However, the current outlook could already start to have a bullish impact on trading/prices for wheat with the Winter Wheat planting season starting now in some places.
National Agricultural Statistics Service
https://www.nass.usda.gov/Charts_and_Maps/A_to_Z/in-wheat_winter.php
https://www.nass.usda.gov/Charts_and_Maps/Crops_County/ww-pl.php
https://www.nass.usda.gov/Charts_and_Maps/Field_Crops/wwacm.php
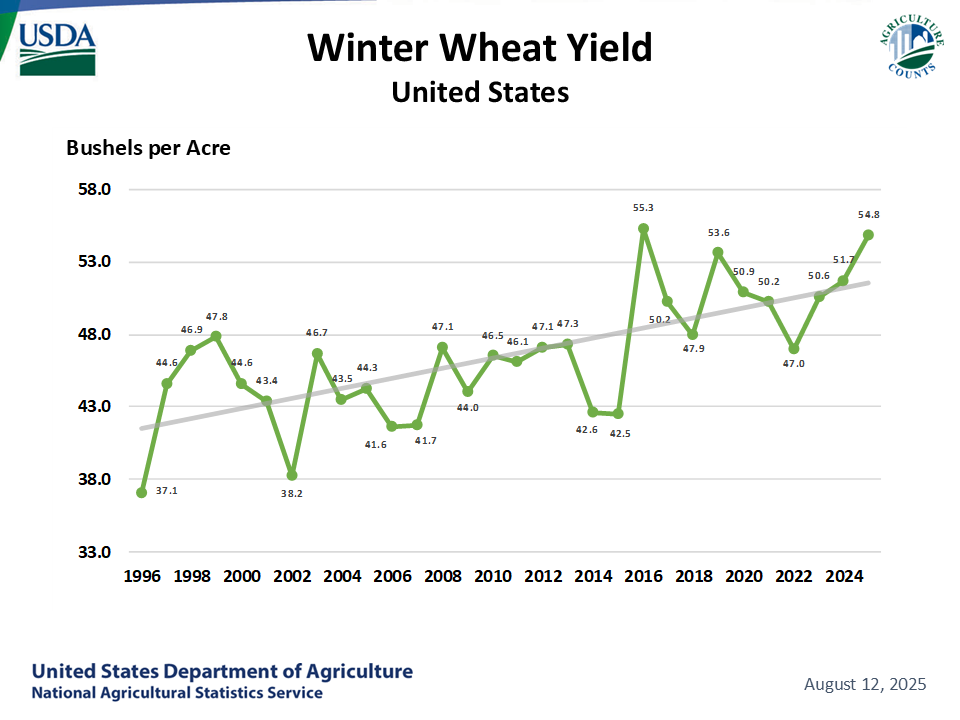
Thank you climate change, CO2, technology and producers!
https://www.nass.usda.gov/Charts_and_Maps/Field_Crops/wwyld.php
+++++++++++++
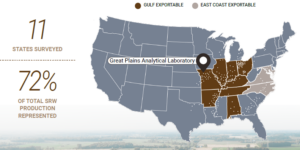
https://uswheat.org/wheatletter/first-look-another-high-quality-soft-red-winter-wheat-crop/
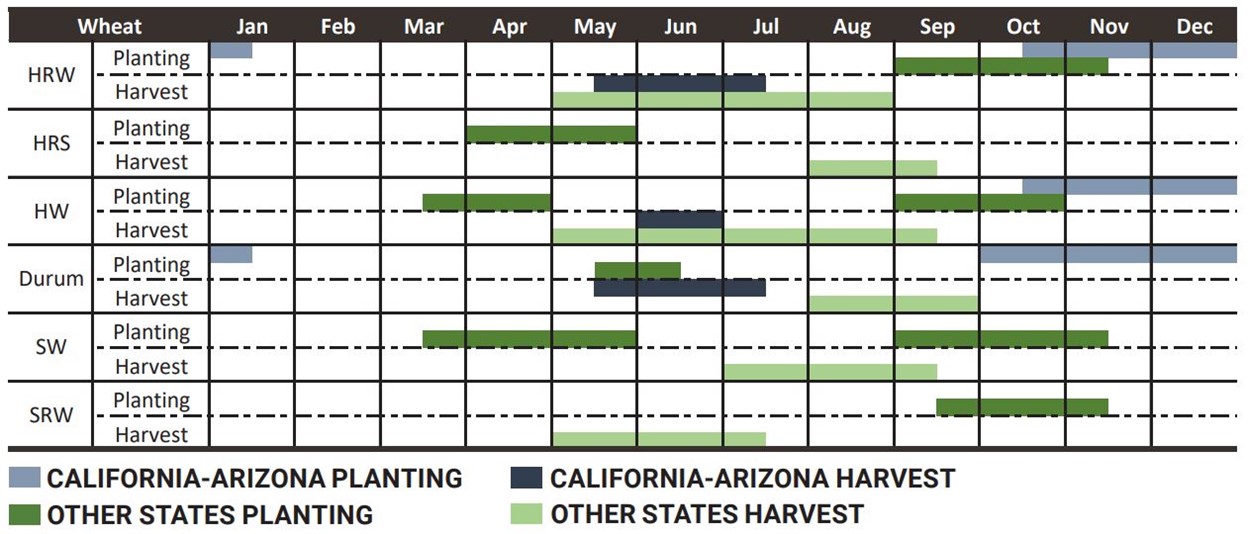
https://uswheat.org/wheatletter/u-s-wheat-seeding-involves-careful-planning-and-varietal-selection/
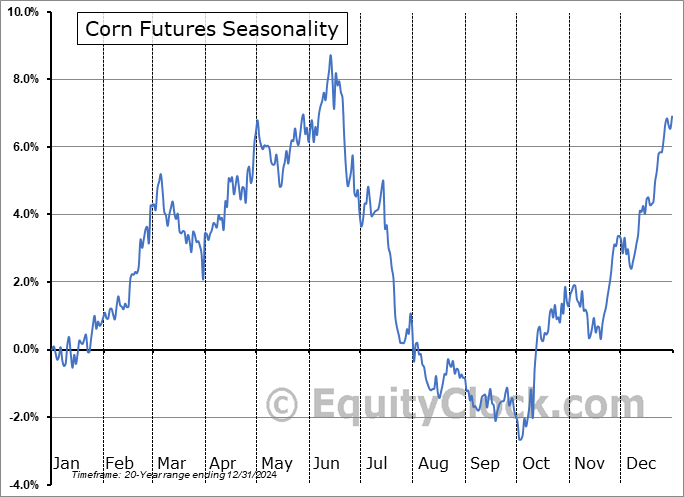
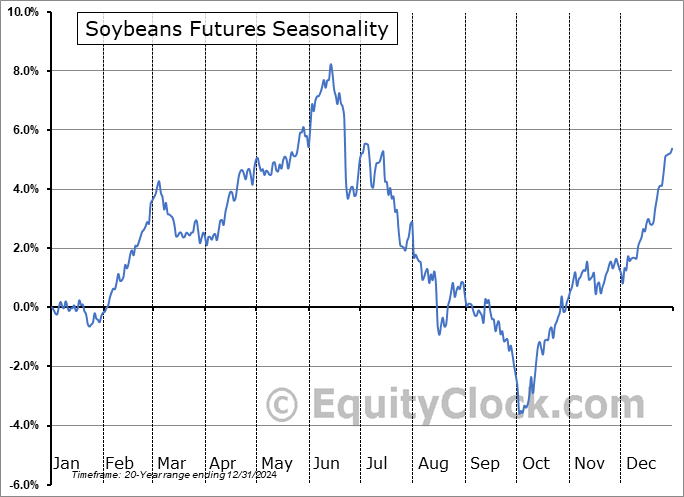
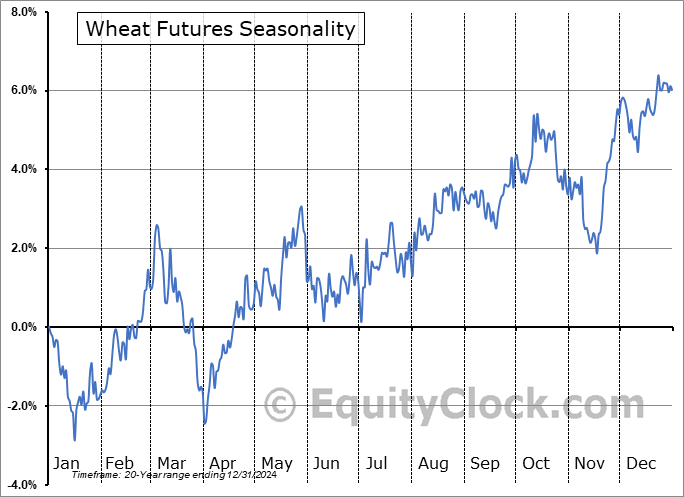
Great site for seasonals!
Strong DOWN for beans and corn until early October from harvest pressure!
Wheat often bottoms early/mid harvest during June or the start of July, then has a very strong UP seasonal signal into October.
Wheat seasonals are up, however even though prices have been very weak the past few months.
https://equityclock.com/seasonality/
https://equityclock.com/charts/
https://charts.equityclock.com/corn-futures-c-seasonal-chart
https://charts.equityclock.com/soybeans-futures-s-seasonal-chart
https://charts.equityclock.com/wheat-futures-w-seasonal-chart
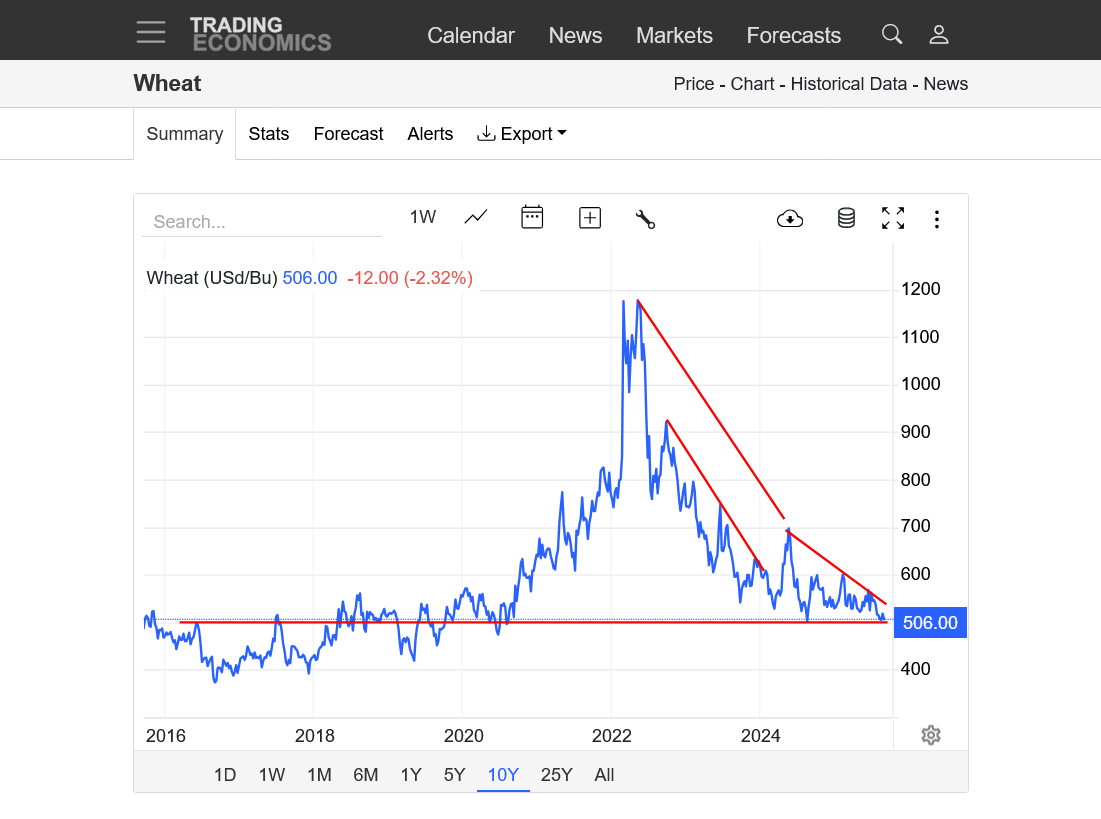
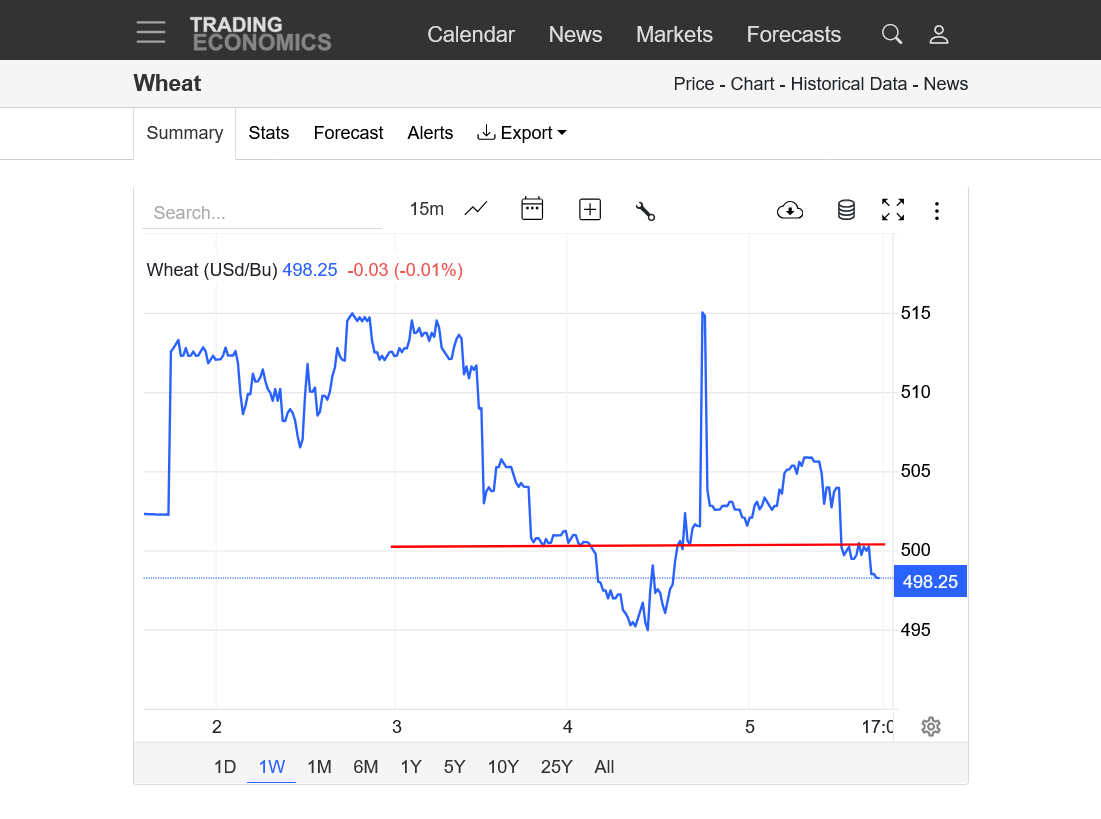
1. 10 years-MAJOR spike high in early 2022 tied to the Ukraine war and global supply concerns. Pick your favorite down trend line since then. We are at MAJOR support of $5 right now. Is the last formation a descending wedge/triange(a continuation pattern)? Or will $5(Mega support and great value for buyers) and the lowest prices since 2020 hold???
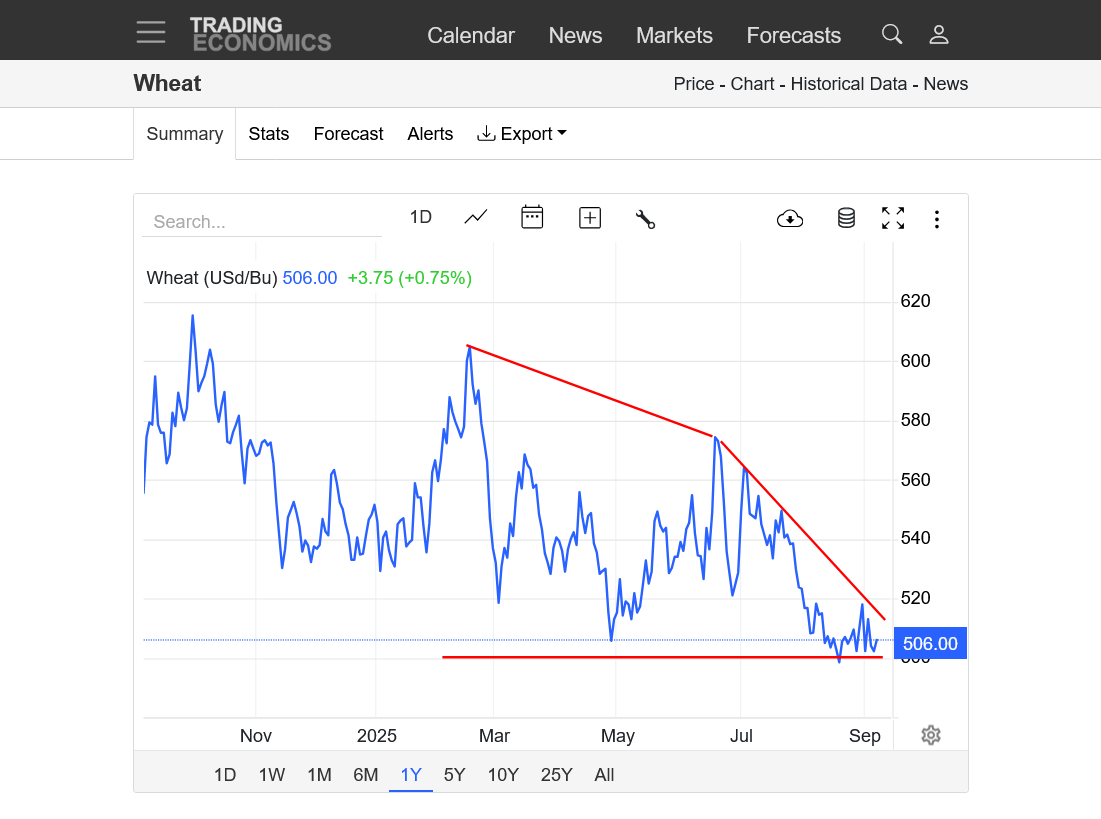
2. 1 year-Going AGAINST the normal up seasonal the past 2 months. $5 support struggling to hold??
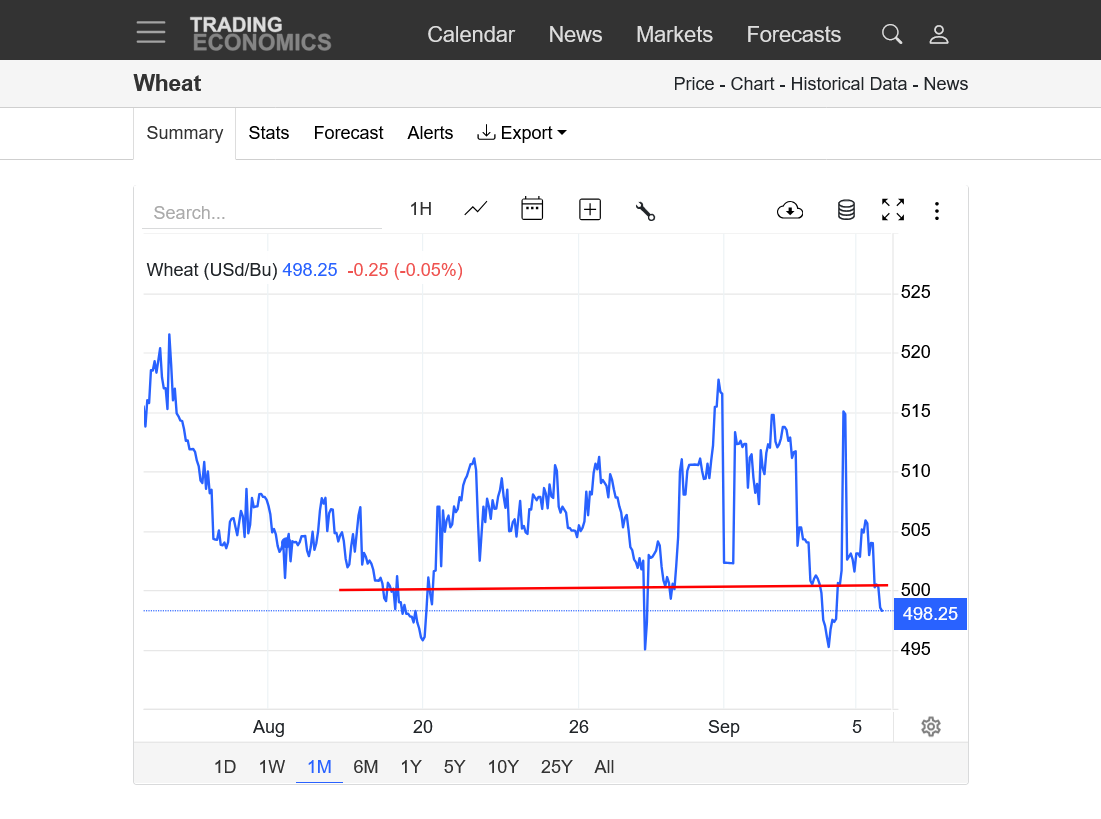
3. 1 month- Mega support of $5 is terrific value for buyers. Can it hold against all the negatives pushing prices lower this year/Summer??
4. 1 week-THIS source shows lower prices than the futures I have Sept wheat closing at $501 and December wheat closing at $519 from my trading account platform.
https://tradingeconomics.com/commodity/wheat
I can't get the HRW price from this source but the soil moisture in the Southern Plains was recharged by heavy, soaking rains in the S. Plains which has caused the HRW/KC wheat price to sink well under the SW/Chicago wheat price. +14c premium for the SRW vs the HRW on the December contract close . I don't ever remember this. It's always the other way around.
There are other things going on besides US weather but this inverted spread could widen if the SRW planting weather features no significant, widespread rain events thru October, while the HRW soil moisture is more favorable. ......AT THE MOMENT.
If this dry pattern expands farther west, it could also elevated concerns for the HRW crop planting and early establishment before going dormant(in Nov/early Dec) in KS/OK/TX.
I will speculate that the wheat trade has been spreading these 2 wheat classes, selling the HRW and buying the SRW. So even if the weather is MORE bullish the SRW, which will be in the epi center of the drought, if wheat turns bullish, any unwinding of this spread would cause the HRW to gain more than the SRW.
It depends on the dynamics. It makes sense that the spread should widen even more but HRW production in the US is much greater than SRW.
1. Last weeks upper level pattern
2. New pattern late this week
From the European Ensemble model at 500 mb.
++++++++++++++++++++++
More on the Winter wheat crop.
There is still at least 6 weeks for a wetter pattern to evolve in time for the dry soils to NOT be a major factor.
That's still plenty of time but let's say it stayed dry into November. What would happen?
1. Wheat planting acreage in the SRW belt would plunge! We wouldn't get the actual number for numerous months/next year.
2. Wheat planted into bone dry soils based on producers hoping for a big rain to germinate the seeds would have odds against it/them. With luck and a huge rain, maybe they could put on enough growth and roots/tillers to go into the Winter in ok shape.
However, germination with shallow top soil moisture won't trigger roots to develop downward into a bone dry moisture profile. They need extensive roots with 2 to 3 tillers IN THE FALL to have optimal yield potential in the Spring. Shallow roots = elevated Winter Kill with extreme cold and no protective snow cover as well as less tillering needed for good yields in the Spring.
The crop coming out of dormancy in the Spring would not be off to a good start.
If that rain never happened, its possible that it doesn't germinate. Winter wheat that doesn't germinate until the Spring will NOT vernalize and produce. Winter wheat needs 4-8 weeks of temps below 48 deg. F to vernalize and can only get that over Winter.
Spring Wheat, planted in the Spring is an entirely different plant!
Can wheat plants that have not yet emerged, or that emerged late, still produce decent yields?
https://extension.psu.edu/late-emerged-wheat-vernalization-requirements-and-yield-potential
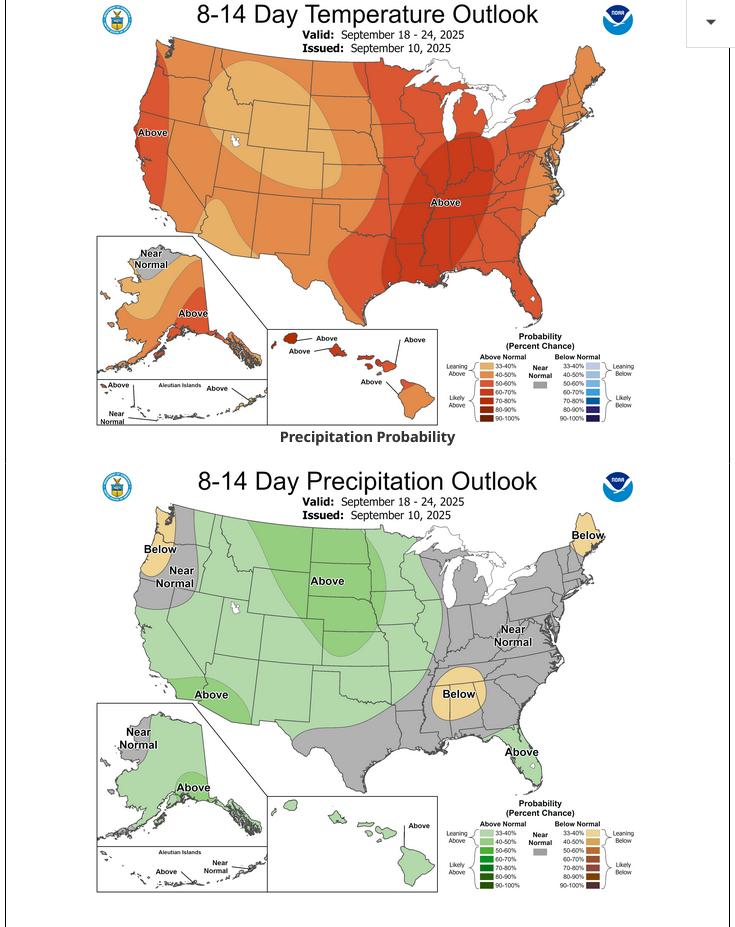
It does look like the potential for a more beneficial pattern for some badly needed rains late in week 2 into week 3. .........is slightly higher this morning.
The next week, however is high confidence dry AND HOT(near record highs! The heat REALLY kicks in midweek and continues for at least a week, probably longer.
7 Day Total precipitation below:
http://www.wpc.ncep.noaa.govcdx /qpf/p168i.gif?1530796126
Re: Re: Re: Re: Re: Weather May 2022
By metmike - April 30, 2022, 8:41 p.m.
Highs for upcoming week:
https://www.wpc.ncep.noaa.gov/medr/medr_max.shtml
Intense heat for September coming up the next week in the southern Midwest!
Dew points will not be as high as previous heat waves this Summer, so it won't FEEL as hot. That drier air will minimize any chance for convective afternoon, pop up showers from heat/humidity instability. It will also increase drying rates. At least the sun angle has dropped half way between its Summer Solstice to Winter Solstice position so that will reduce evaporation rates for ground that gets a full sun.
Also, with low dew points and increasing time at night, temps at night will drop into the 60's, instead of the 70's, which were the lows for the previous Summer heat waves.
Re: Re: Re: Re: Re: Weather May 2022
By metmike - April 30, 2022, 8:41 p.m.
Highs for upcoming week:Days 3-7
https://www.wpc.ncep.noaa.gov/medr/medr_max.shtml


+++++++++++++++++++++++++++++++++++++++++++++++
A bit better chance of rain late in week 2 but still not great. We need a Bermuda High to the East or Southeast to pump in moisture.
1. 500 mb forecast for this weekend from the European Ensemble model. Omega High in the Midwest! See below!
2. The LATE week 2 pattern looks more zonal with the potential of a system that lacks optimal moisture but looks promising. The yellow is vorticity/spin which causes lift ahead of it.
Omega blocks get their name because the upper air pattern looks like the Greek letter omega (Ω). Omega blocks are a combination of two cutoff lows with one blocking high sandwiched between them.
Because of their size, Omega blocks are often quite persistent and can lead to flooding and drought conditions, depending upon the location under the pattern. Cooler temperatures and precipitation accompany the lows, while warm and clear conditions prevail under the high.

This was the total rain forecast for the next 2 weeks from the just out 12z GEFS model. Rain amounts are going up in the flash drought area with rain chances VERY LATE in that period.
Still dry till then with a week of near record heat!
++++++++++++++=
https://www.cpc.ncep.noaa.gov/
Heat continues in week 2:

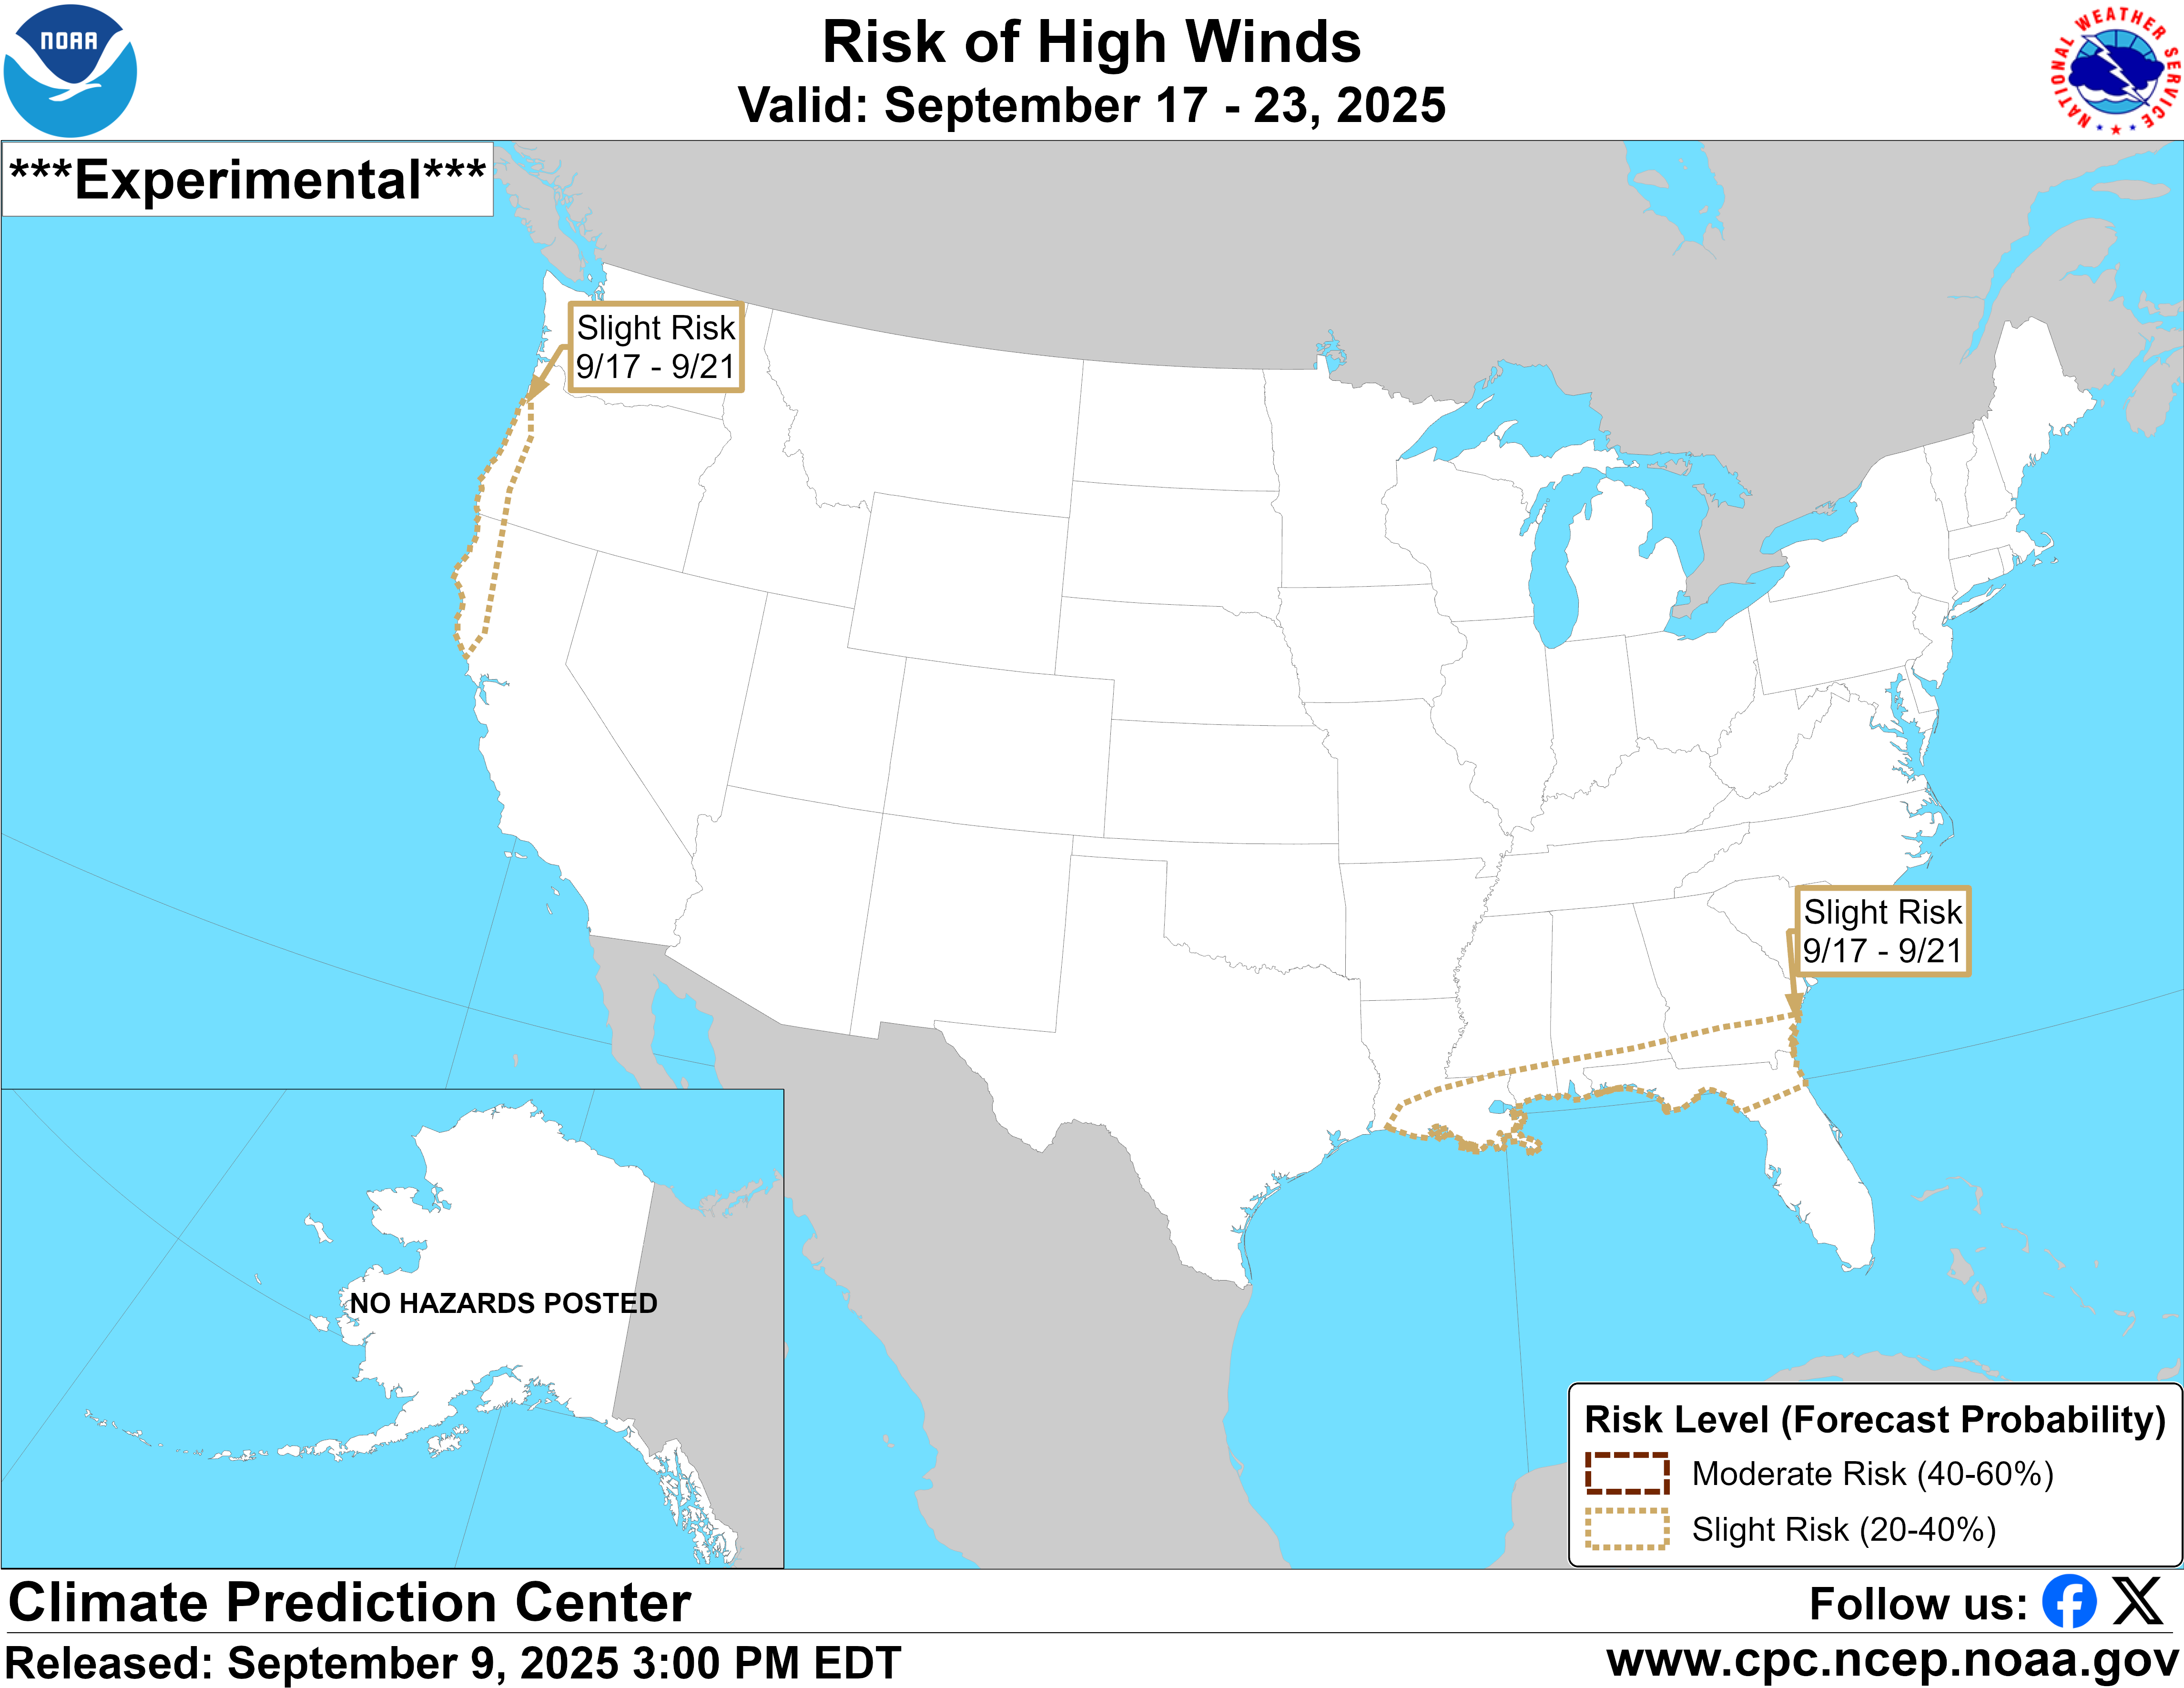
The NWS finally issued FLASH FLOOD DROUGHT hazards.
This must be from the risk of a tropical system in the Southeast! The risk is VERY slight!
9-10-25: They took away this risk today!
Rains chances continue to increase from west to east, especially very LATE in week 2. Not the best set up here in FLASH DROUGHT land but at least rain chances that might put a small dent in the drought.
https://www.marketforum.com/forum/topic/83844/#83852
+++++++++
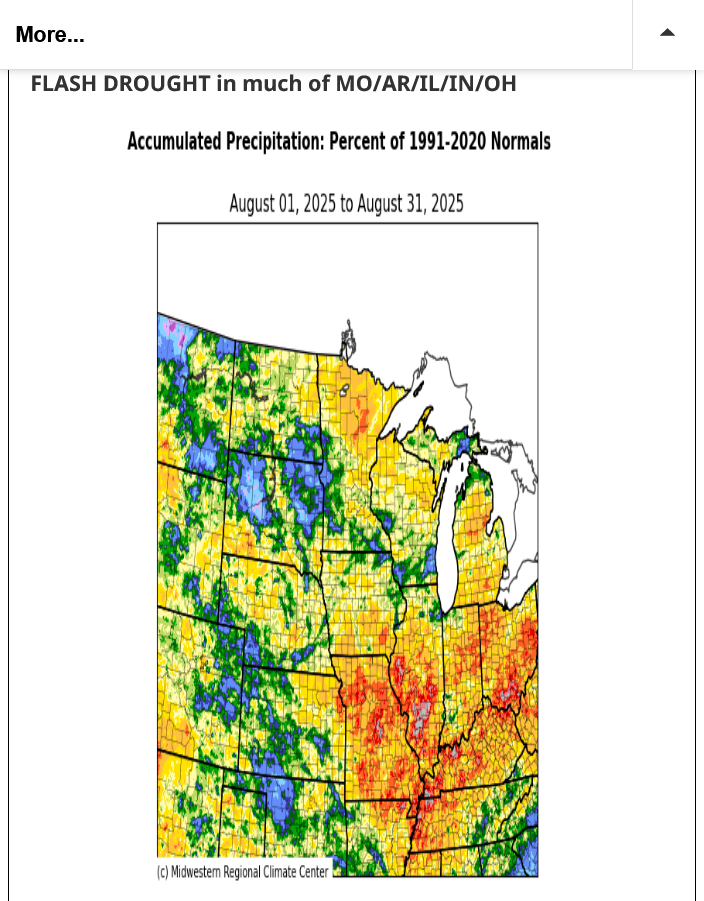
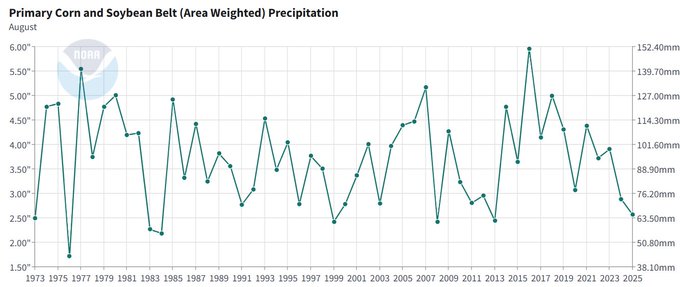
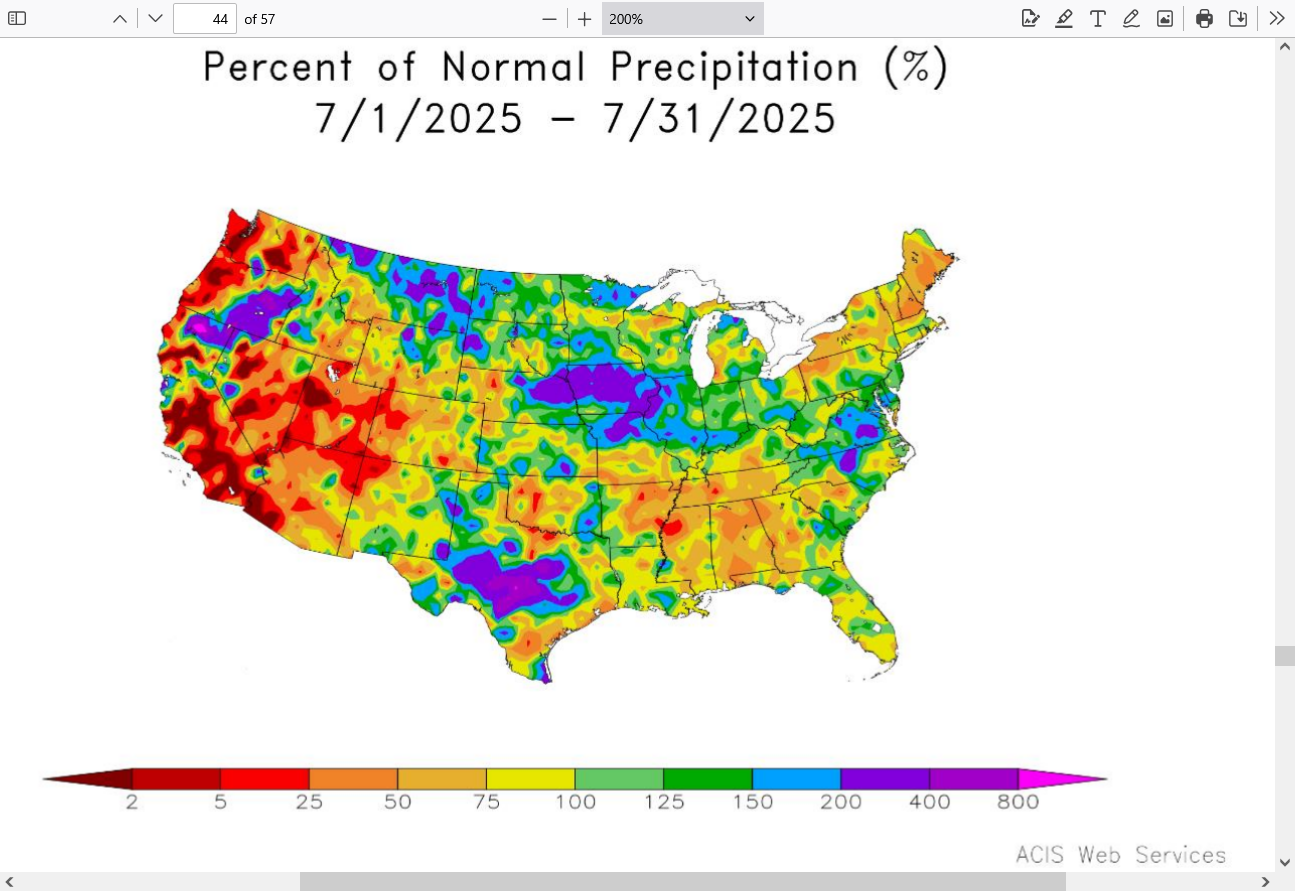
2025 marked the driest August across the U.S. corn and soybean belt since 2013.
++++++++++++++++++++
https://www.marketforum.com/forum/topic/83844/#83853
NEW LINK:
https://www.drought.gov/current-conditions
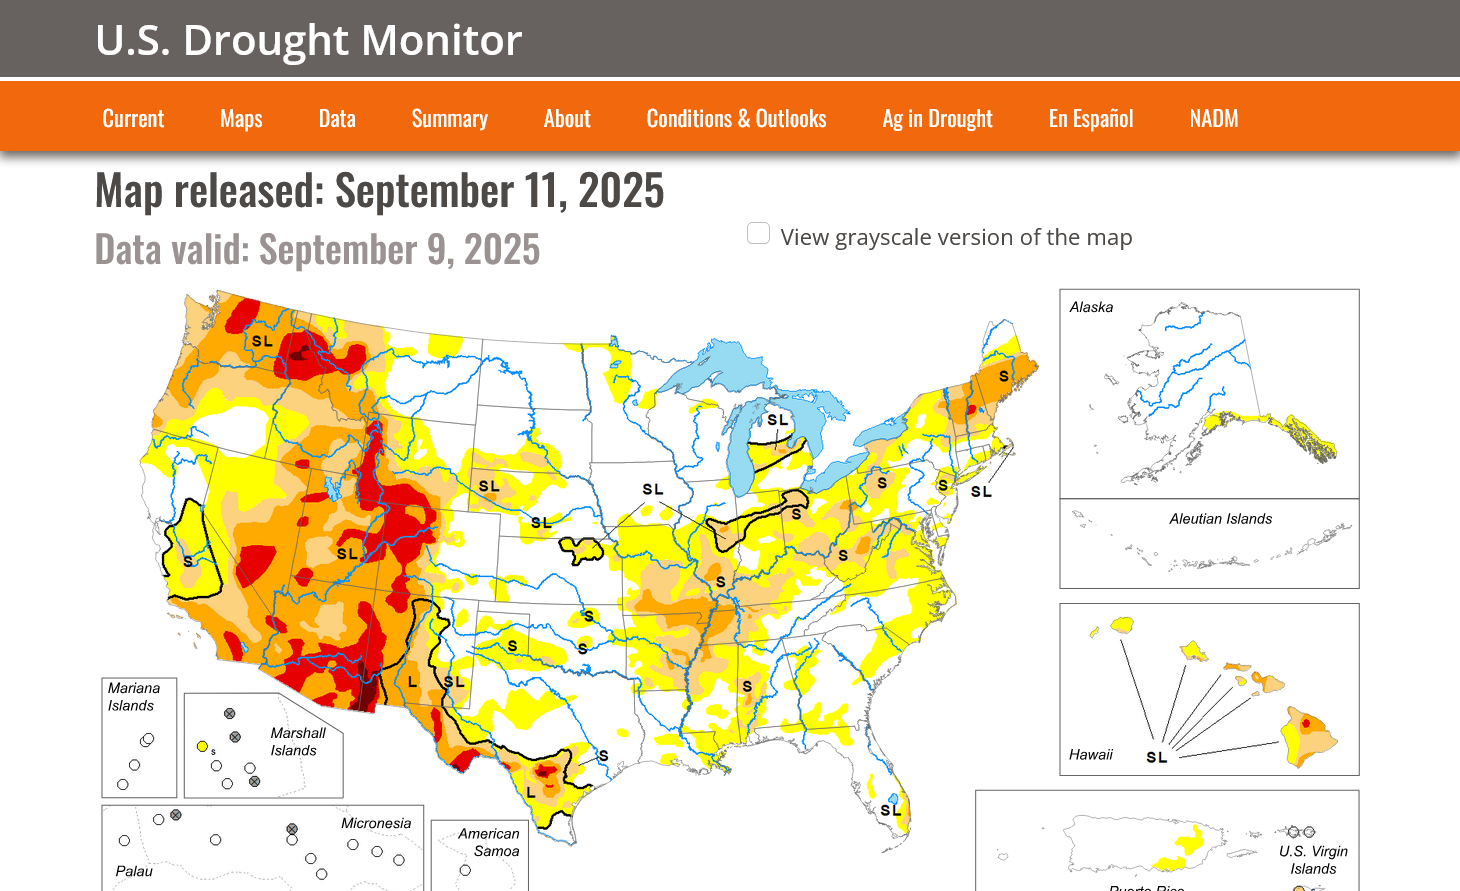
September 3, 2025 to September 9, 2025
FLASH DROUGHT!!!!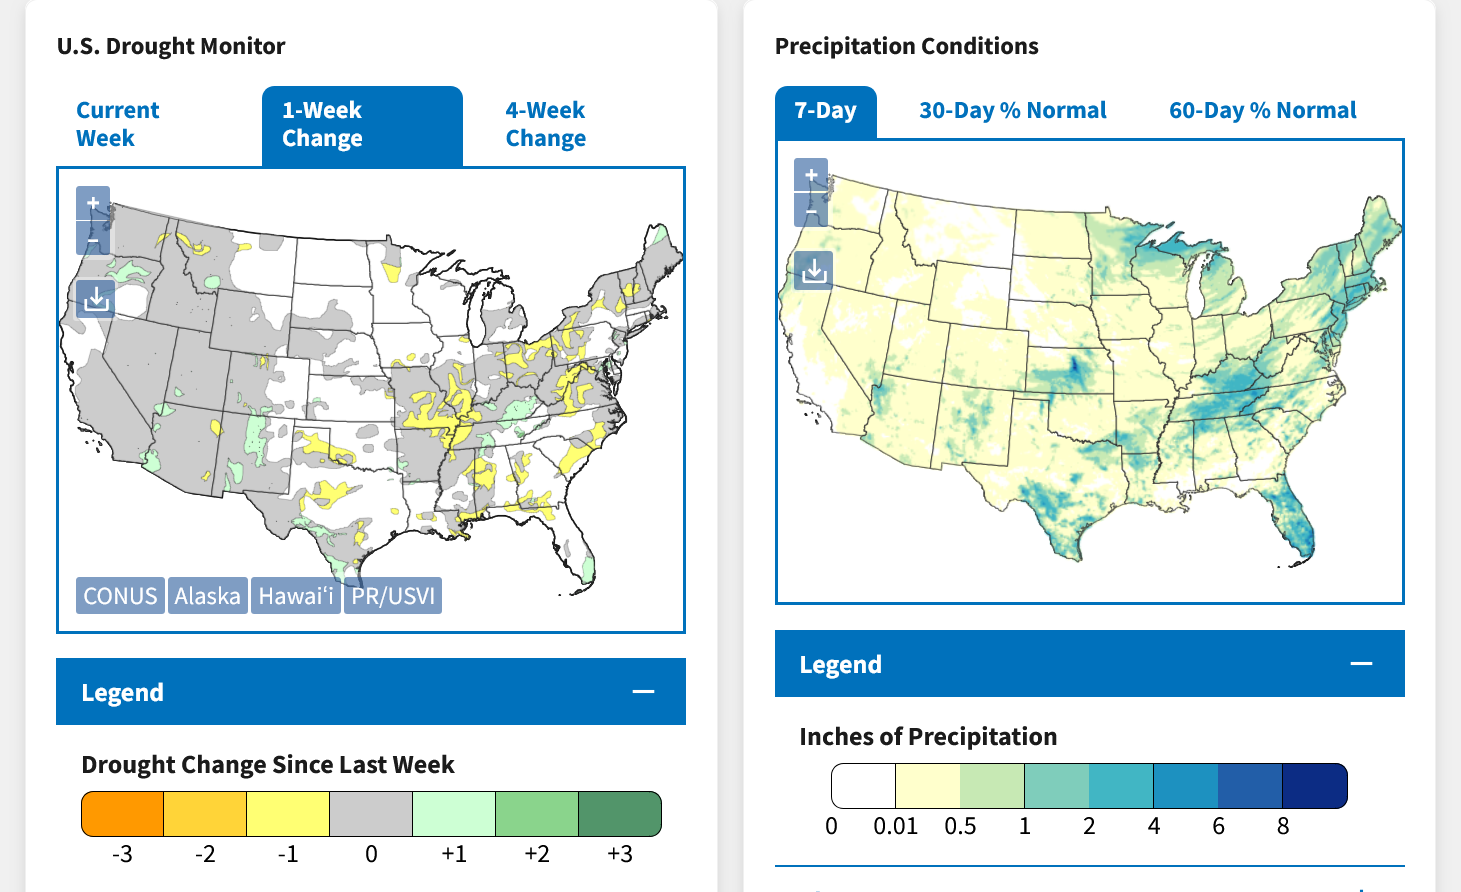
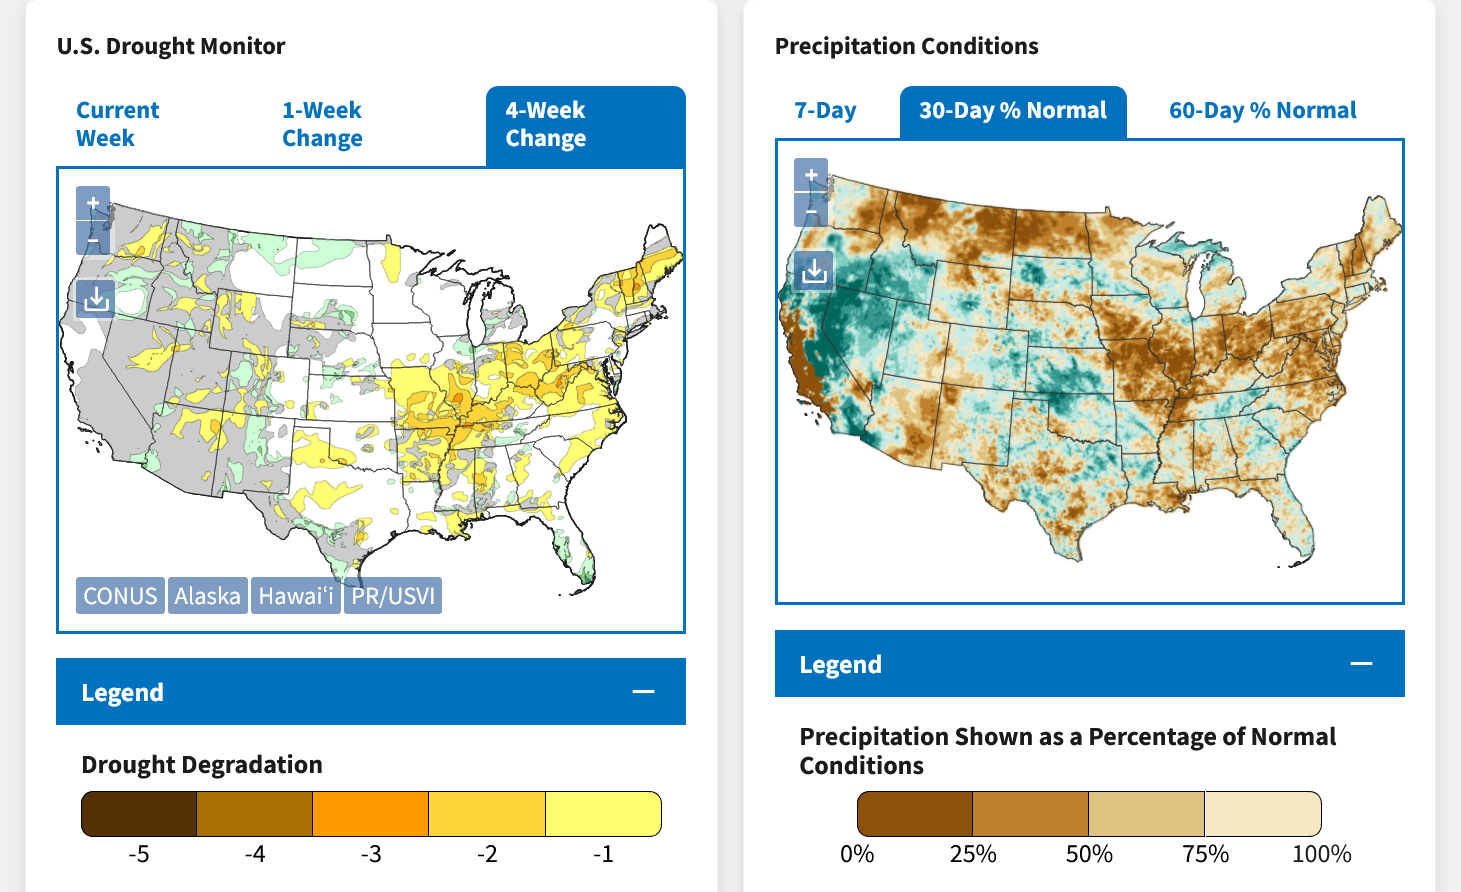
DROUGHT MONITOR
https://droughtmonitor.unl.edu/
Flash Drought has worsened!
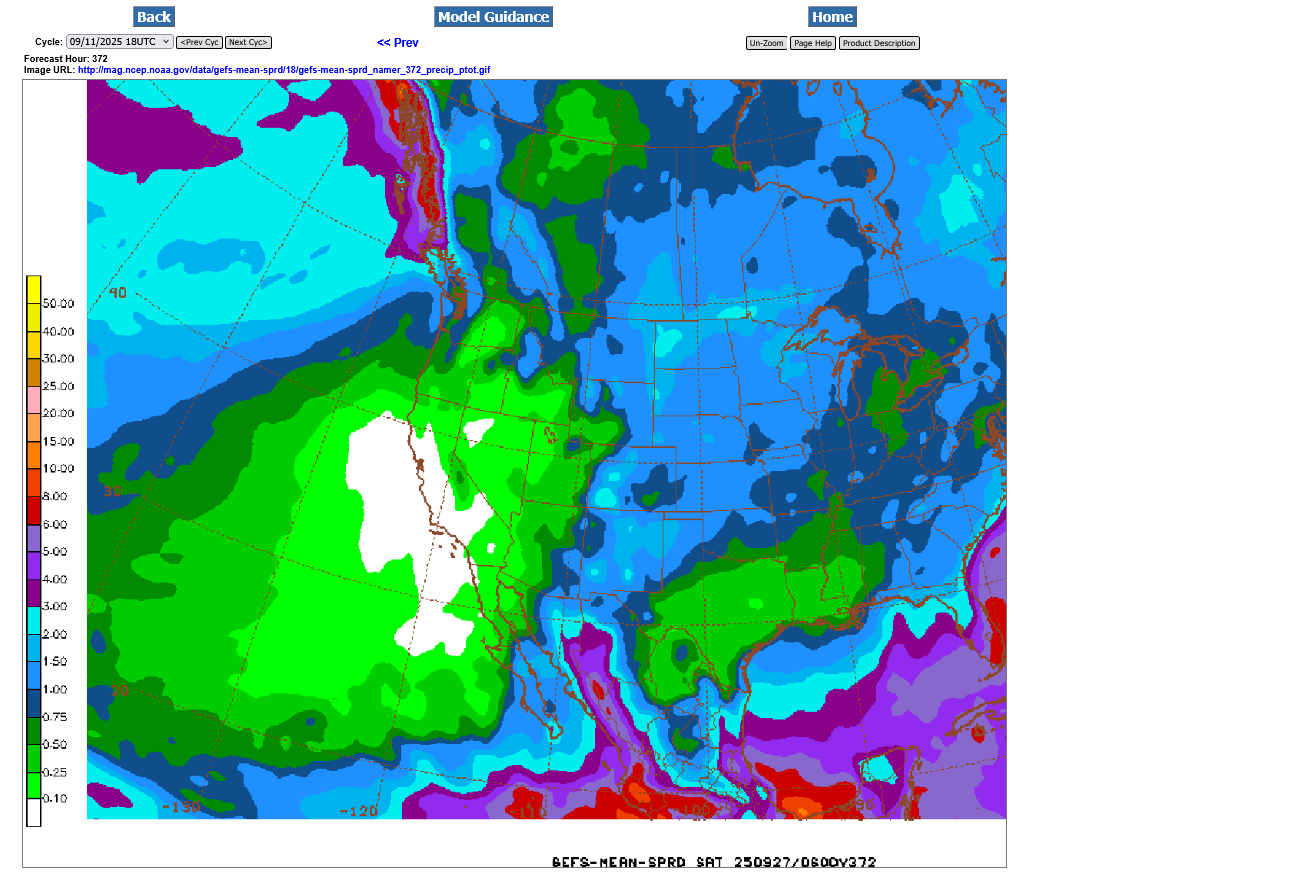
Total 2 week rains from the just out 18z GEFS. All that rain in the flash drought areas is near the end of the period and its still less than 1 inch but this is BETTER than the nothing expected the next 10 days!
I did some scouting yesterday and it looks to me that the lack of rain in August and September has drastically reduced to size of the beans on my farm. In July we were thinking a record crop, now maybe 10 bushels below average. JMHO
Thanks, cutworm!!!!!!!!!!!!!!!!!
I trust your assessment with absolute confidence!
Now, we just wait for the USDA to catch on and take 4 months, to the January 2026 crop report to tell the markets
Seriously, as you and our readers remember, that's exactly what happened last year with this same thing happening in 2024.
Not good news for early October, although the growing season is over for C and S. If this continues long enough, it will turn bullish for the SRW planting weather.
https://www.cpc.ncep.noaa.gov/products/predictions/WK34/
With a bearish report of more corn acres the market closed higher right at resistance of July 18 high.
Could traders be waking up to the lower yields from the drought in the eastern Midwest???
Thanks, cutworm.
My guess is that your guess is right!
Some unexpected but LOW rain chances the next week. It won't help the C and S crops or make much of a dent in the drought but the lucky ones who get some rain will be extraordinarily grateful!
https://www.marketforum.com/forum/topic/83844/#83848
Good rains forecast for KS and decent soil moisture in our #1 wheat producer, will likely put a lid on any bullish SRW planting weather (east of KS) spins.
Also significant rain chances are getting close and going up late in week 1.
This is the 7 day rain total for days 4-11. Sept. 17-24 from the just out 6z GEFS.
cutworm and metmike are on the southeast edge of the rains with just over .5" and going up. Those 1"+ rains in MO/IL are close enough to be hopeful!
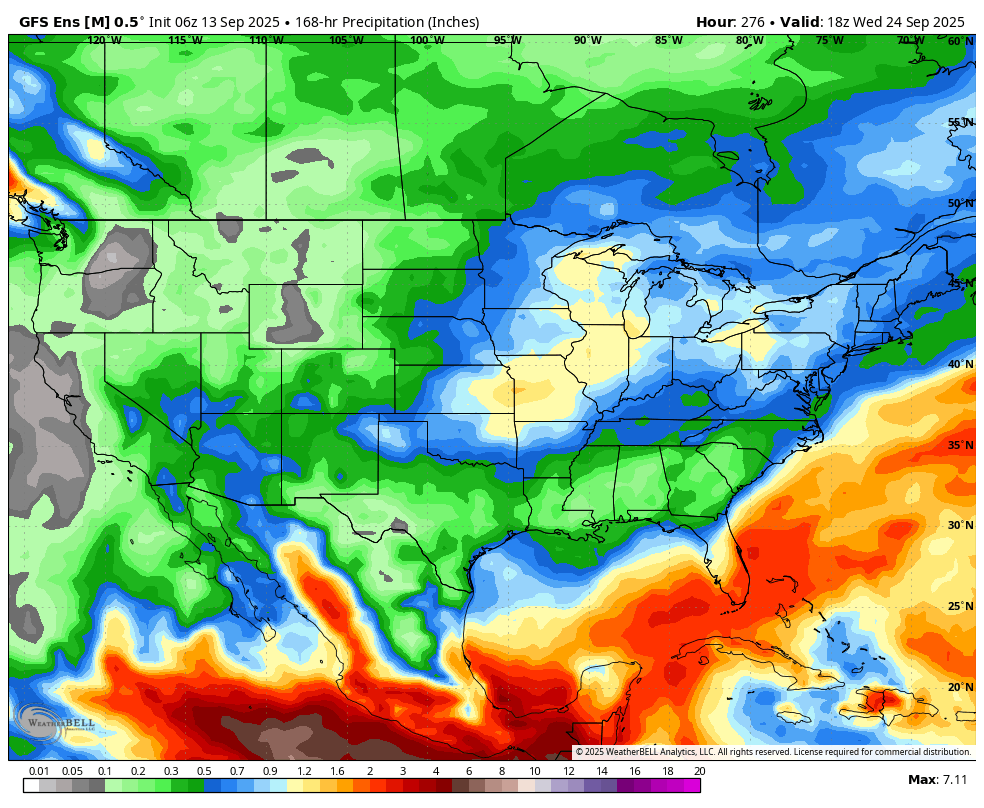
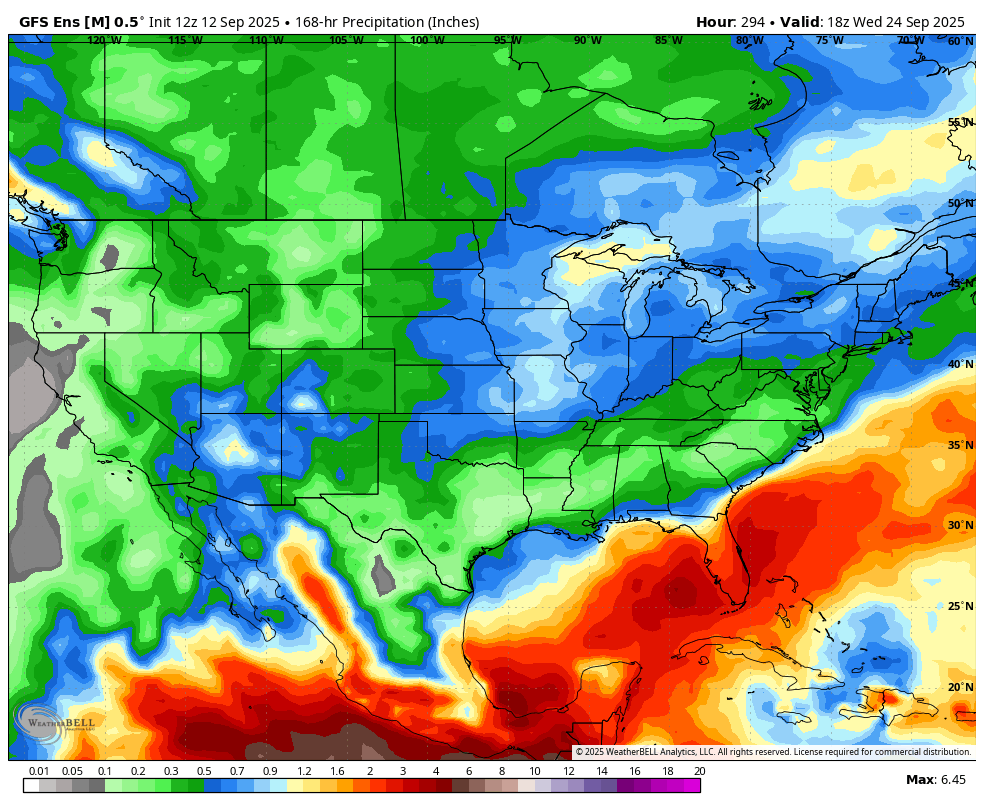
Below is the same product and time frame from Friday morning, 18 hours earlier.
Back to the last run above. The rain shield/area expands slightly to the southeast but the huge change is the robust increase in amounts above, some that hit some pretty dry areas. Things will change between now and then but this last change was positive for more rain!
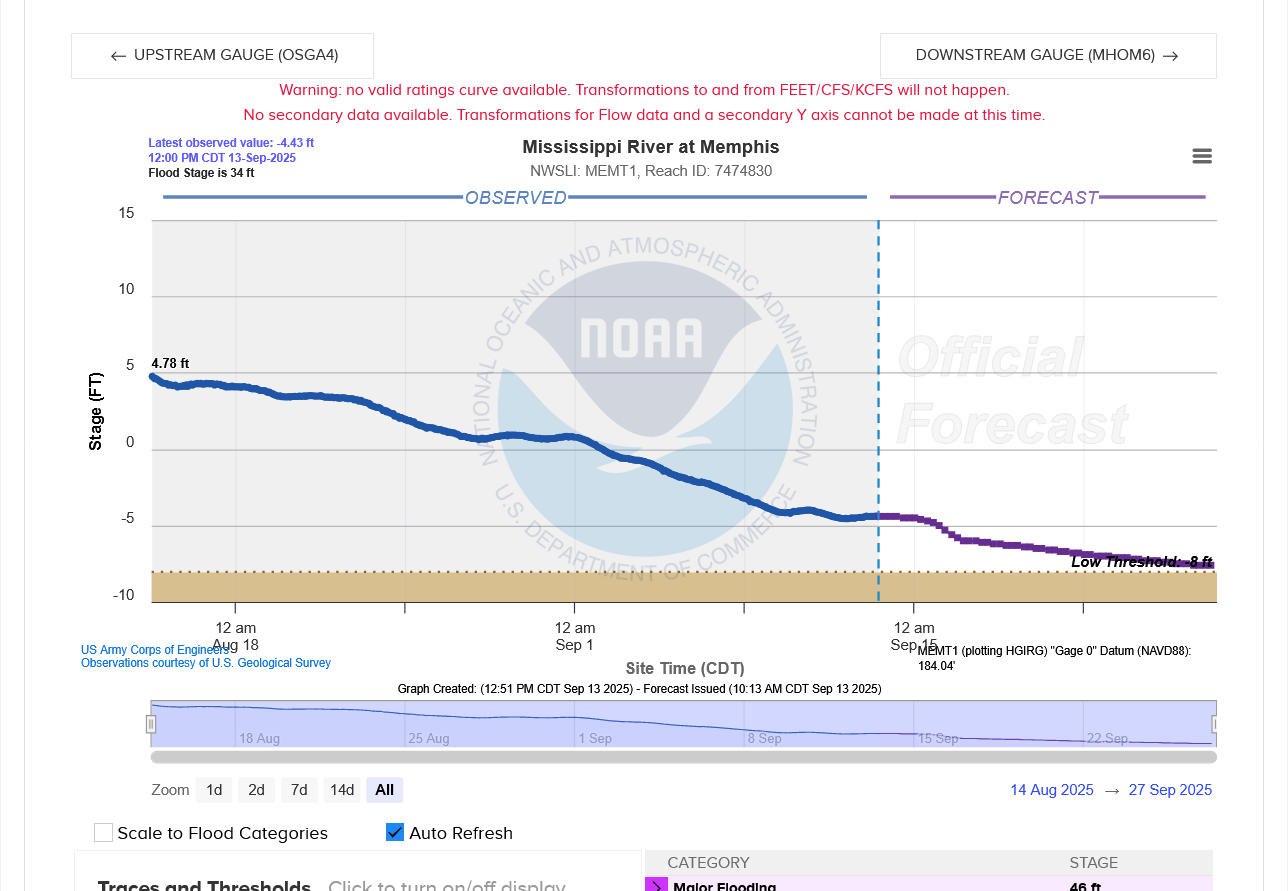
This will start to impact barge traffic if we don't get more rain.
Last updated: Sep 13, 2025, 12:50 PM CDT
NWS Saturday update: Rain chances in week 2 continue to got up!!!
The late week 1 early week 2 period continues to look promising for rain chances to expand farther east but still heaviest in the Plains HRW growing area.
This would be very timely/beneficial rains ahead of planting the Winter wheat crop to help with early establishment.
MUCH, MUCH more than this is needed for the SRW crop which is farther east of the HRW crop. We still have plenty of time but that time will start running out in late October/early November.
This is the total 1 week(168 hour rain) ending September 25. Days 4-11 in the forecast.
Rain chances, now in the days 3-10 period have shifted a bit.
Less rain for us in southwest IN 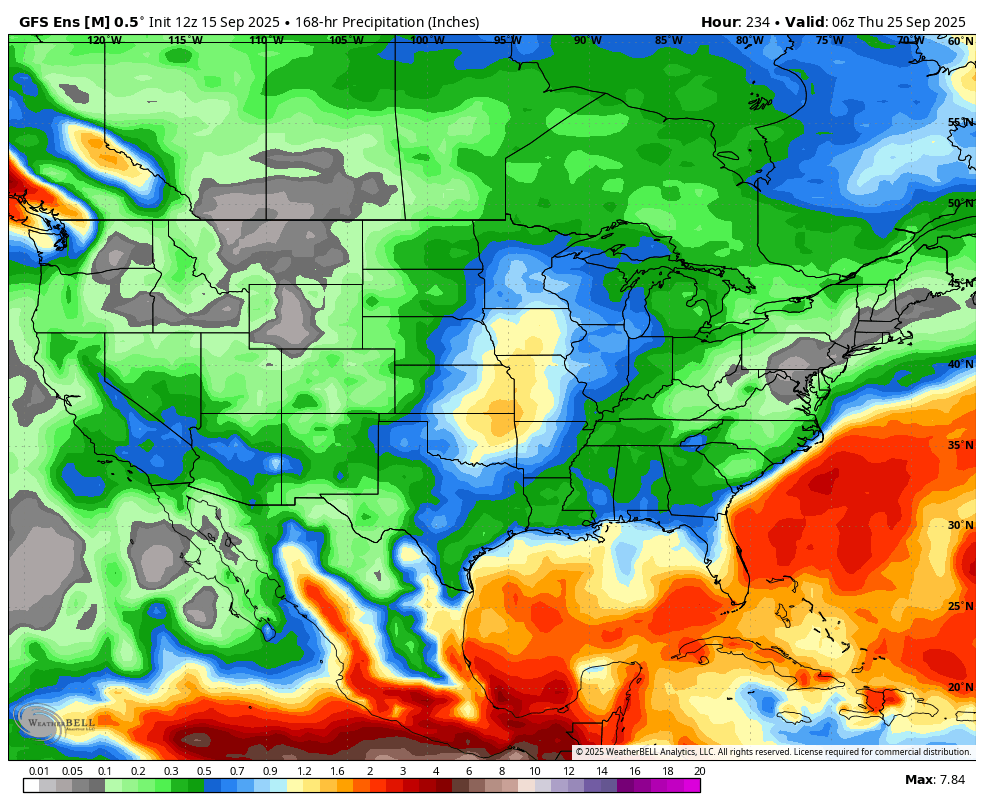
Most of the rain will stay west of IN the next week:
7 Day Total precipitation below:
http://www.wpc.ncep.noaa.govcdx /qpf/p168i.gif?1530796126
Not too thrilled with rain chances coming up for IN that have shifted slightly farther west the past 2 days(with us being on the edge). However, many areas in the center of the country will be blessed with a soaker! We really need it farther east! Hopefully that will change!
Rain chances have been going much, MUCH higher the last 3 days!
Things are now looking great for enough rain to at least make a dent in the severe drought!
7 Day Total precipitation below:
http://www.wpc.ncep.noaa.govcdx /qpf/p168i.gif?1530796126
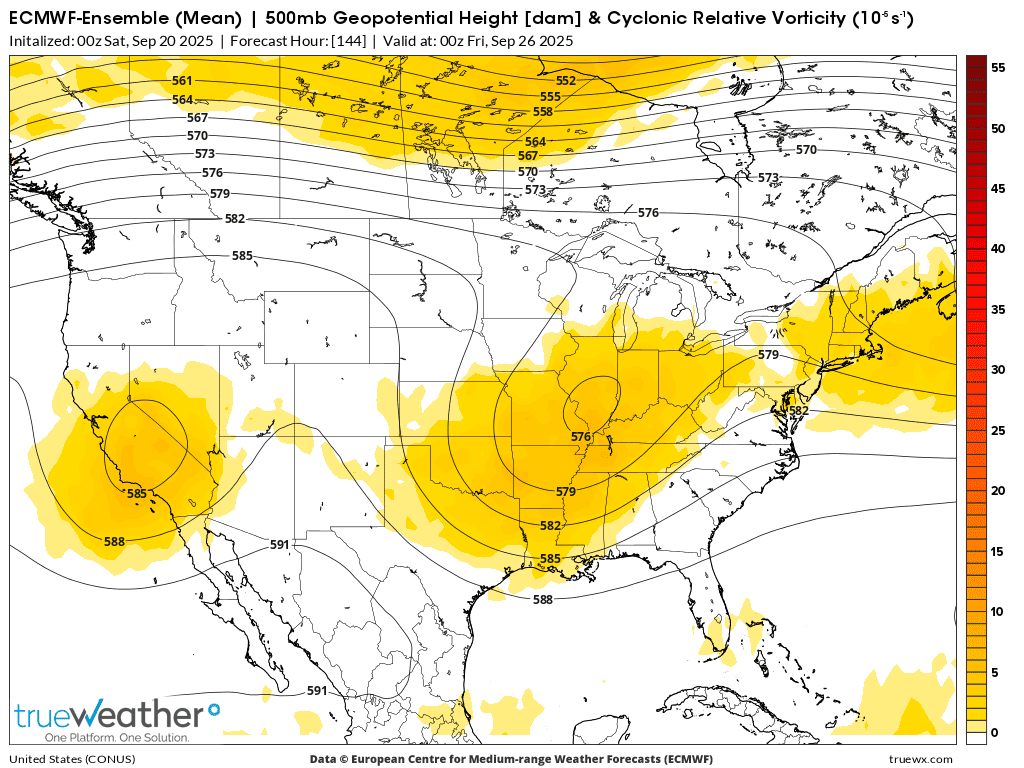
1. Potential cutoff lower stalling out in major drought areas late next week! Yellow is vorticity/spin that causes lift.
0z European Ensemble model for Friday, 9-26-25 below.
2. This is the WETTEST model compared to average:
https://www.marketforum.com/forum/topic/83844/#83853
NEW LINK:
https://www.drought.gov/current-conditions
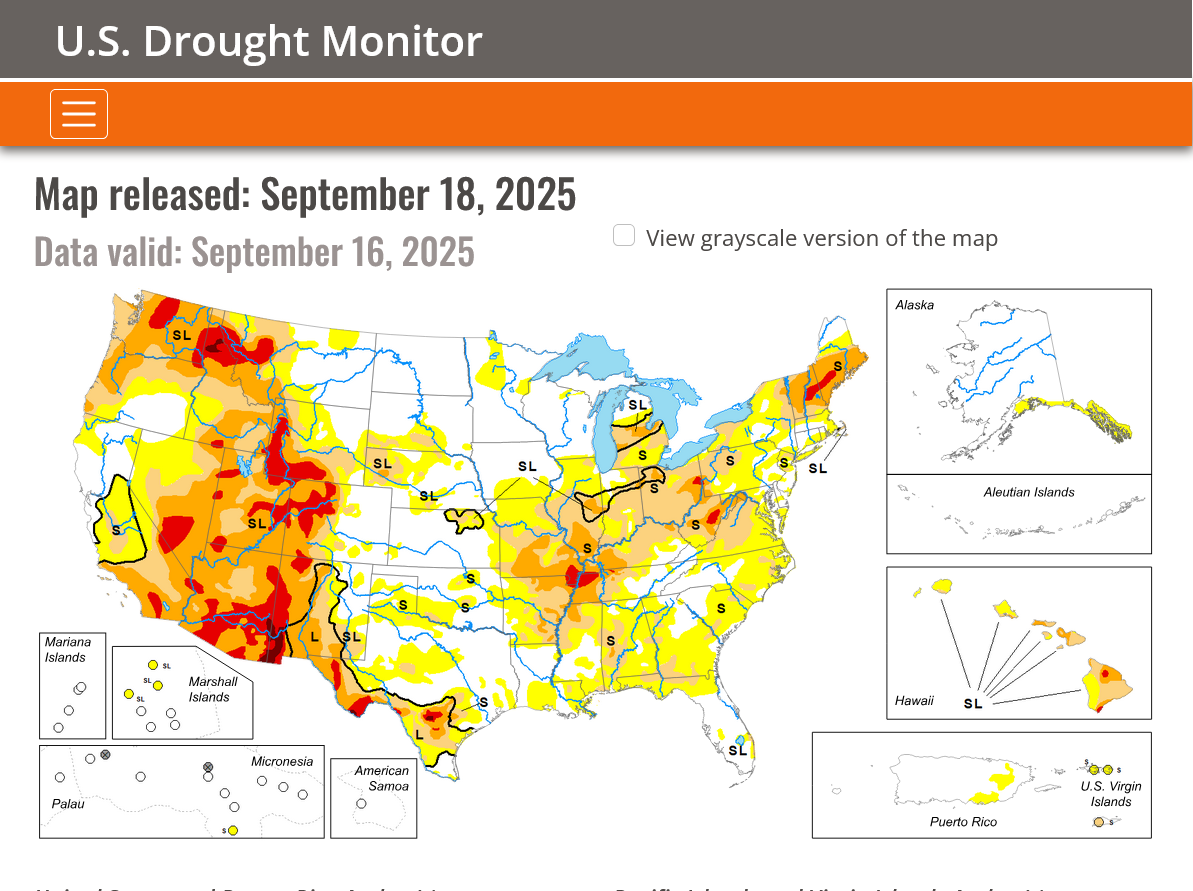
September 10, 2025 to September 16, 2025
FLASH DROUGHT!!!!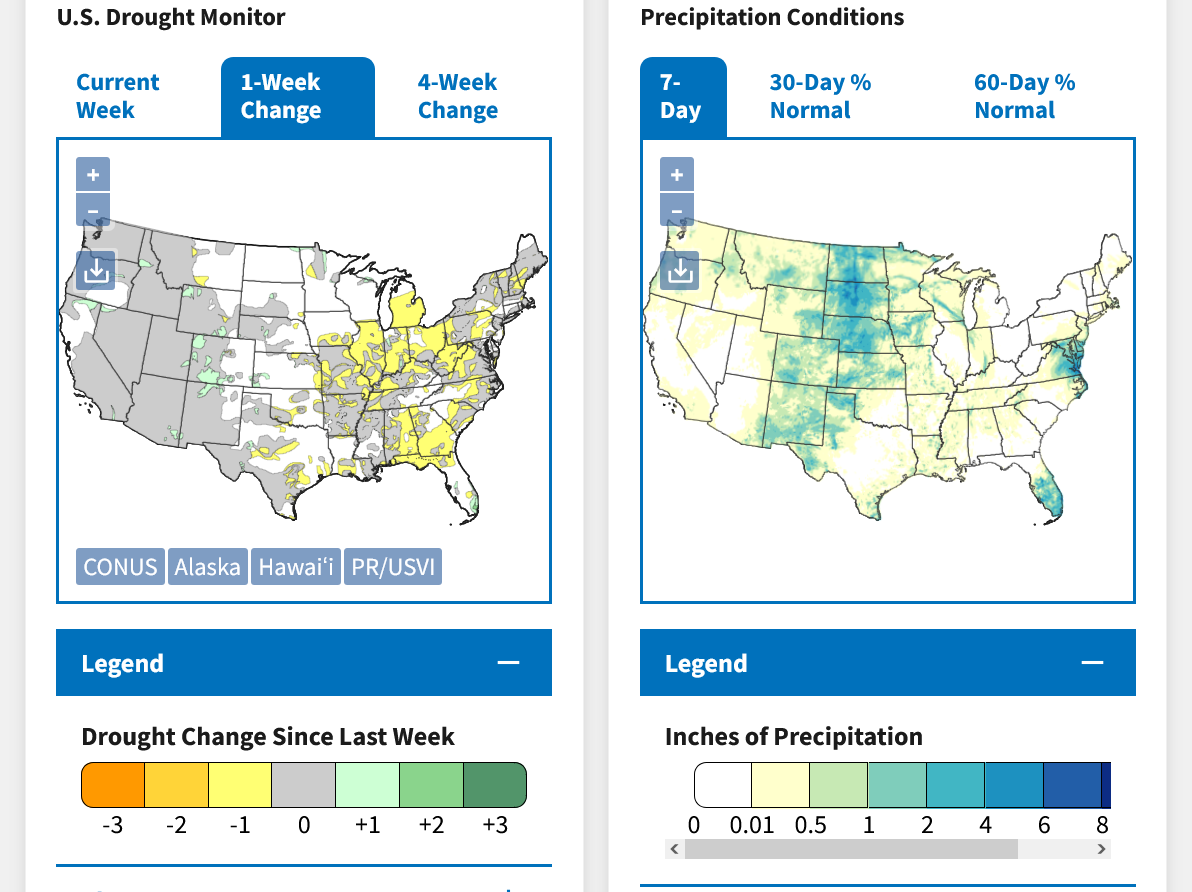
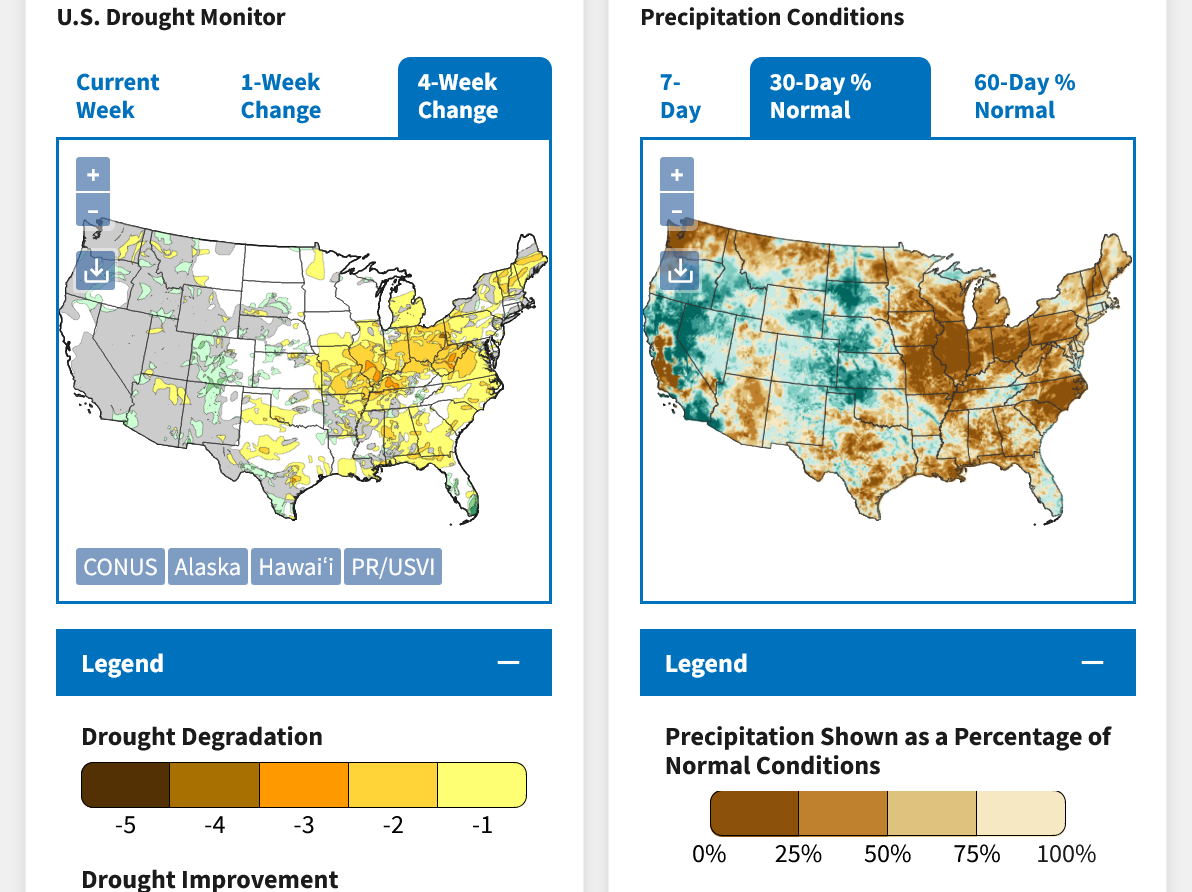
DROUGHT MONITOR
https://droughtmonitor.unl.edu/
Flash Drought has worsened!
+++++++++++++++++++
Just what the doctor ordered!!!!!!!!
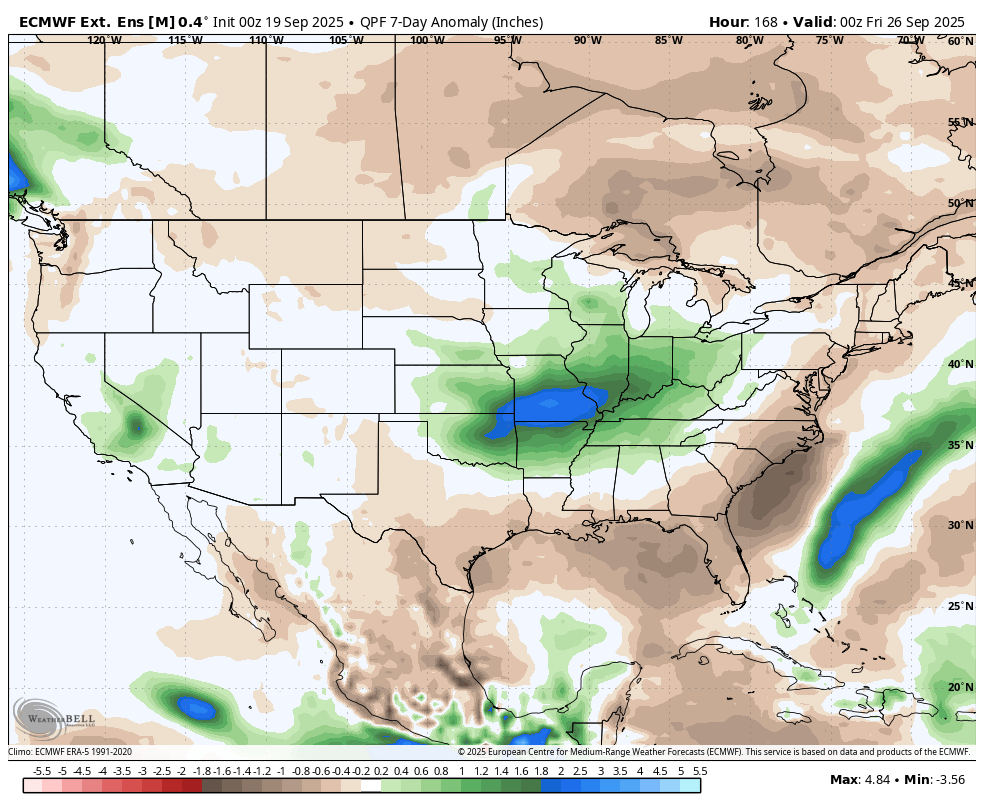
7 day rain anomalies from the just out 12z European Ensemble model:
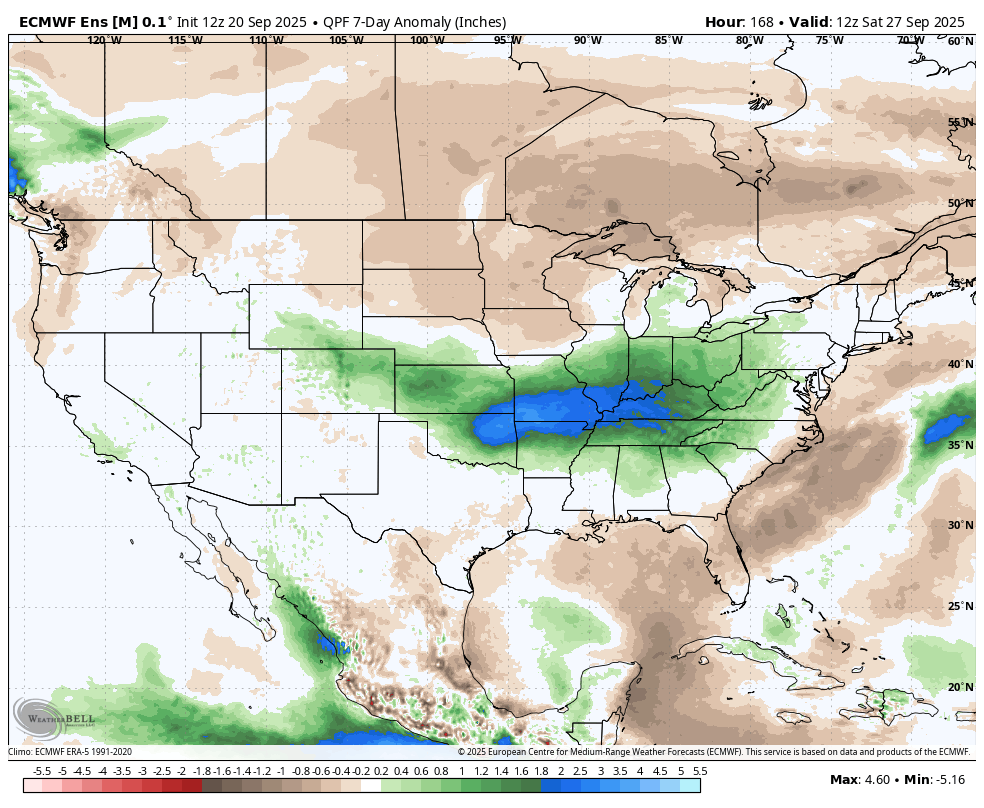
The much wetter forecast from late last week is verifying big time!
Re: Re: Re: Re: : USDA September 12, 2025/Grains
By metmike - Sept. 22, 2025, 10:14 a.m.
We haven't seen a radar image like this in Evansville, IN for almost 2 MONTHS, with much more to come. Yippee!!!
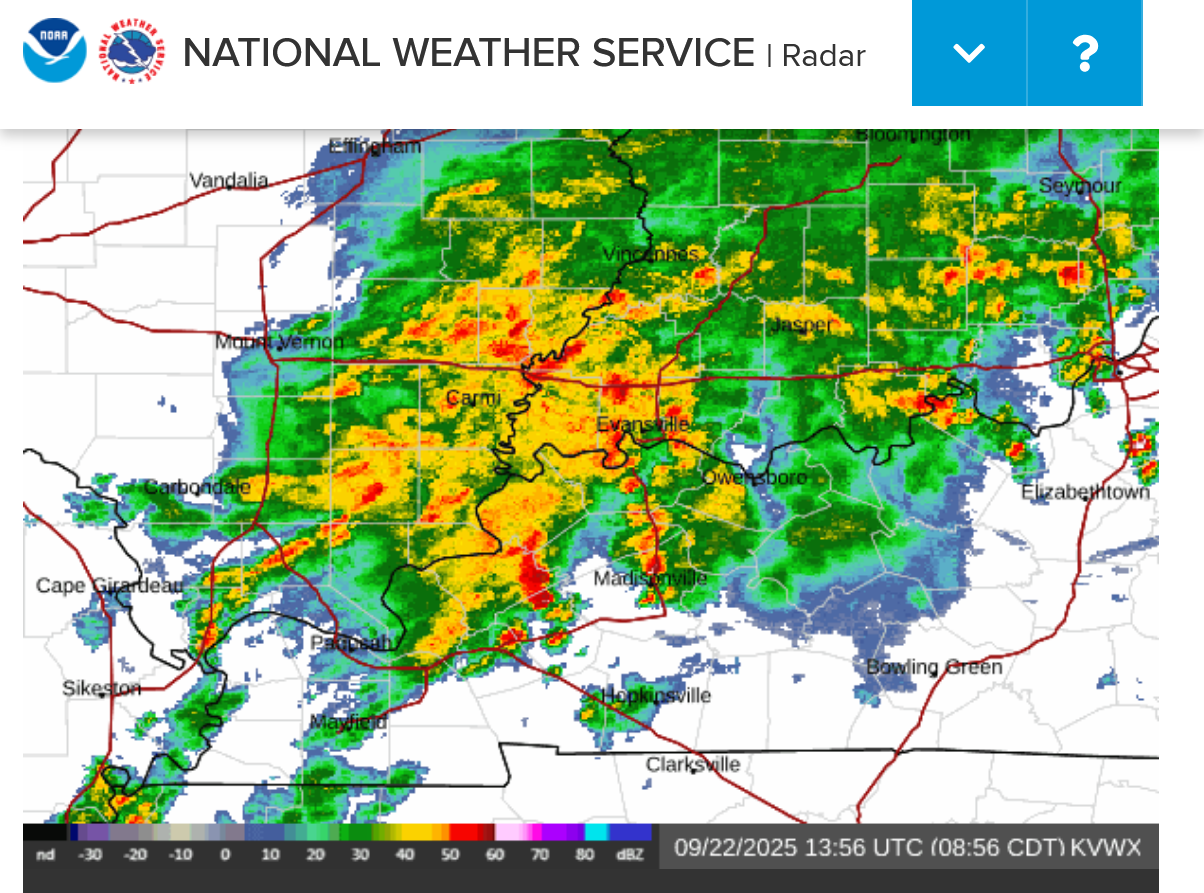
Local radar Super Resolution Base Reflectivity
These are wonderful rains that we greatly appreciate but unfortunately, it looks like it will turn very dry again after this system passes east later in the week.
However, this should provide enough soil moisture to germinate the SRW crop when its gets planted. Hopefully, there will be more to come later in October.
2pm: 1.55 inches of glorious rain!!!
The last round earlier this evening brought our total rain to 2.2 inches.
That‘s .6 inches MORE than the TOTAL rain going back more than 2 months. This made a huge dent in the drought.
I figured out most of the reason for why our front yard rain gage always measured around .2 more rain than the backyard. At the very bottom of the one in the front, (they both have an extremely narrow circumference at the bottom) there was some completely decomposed material, mostly leaves that was stuck at the bottom, up to around the .2 mark. After cleaning that out, We’ll see now if the rain gauge in the front matches the one in the back.
I mentioned previously that I thought there was a rain shadow happening from the house blocking rain. The wind yesterday suggested that was impossible.
Then, I thought that it might be from a flaw in manufacturing.
As I was inspecting for that and getting ready to test them with a measured amount of tap water, the hard to see debri/sediment at the bottom of the rain gauge with higher amounts was noticed.
Another 1.1 inches of rain on Tuesday Evening, bringing us up to 3.2 inches of rain!!! Yippee!!
That's exactly double the total rains that fell the previous 2 months added up!!!!!
These rains soaked in and helped restore soil moisture. We were getting some huge cracks in the ground that also resulted in huge cracks in our asphalt driveway.
I've delayed sealing the driveway during the drought because the cracks opening up AFTER sealing it would have to be patched up.
I'm going to take these graphics off the main weather page and will store them here in case I need to go back to access the data later:
2025 marked the driest August across the U.S. corn and soybean belt since 2013.
Updated daily below:
https://mrcc.purdue.edu/cliwatch/watch.htm#curMonths
FLASH DROUGHT in much of MO/AR/IL/IN/OH

RAINS THE PAST 7 DAYS:
https://www.wunderground.com/maps/precipitation/weekly
Thru 10-3-25: Back to dry again!
Thru 9-27-25: Best rains in over 2 months for large parts of the southeastern Cornbelt! Yippee!!
Over 4 inches here in Evansville IN(southwest corner of IN)
Thru 9-20-25:
Thru 9-12-25: I missed the week before but there were no major rains events then:
Thru 8-31-25: FLASH DROUGHT in the driest areas!!! This IS reducing yields ab it, especially for beans that are still filling pods and are impacted by soil moisture.
Thru 8-25-25: Drying out more but at least temps were cool enough to reduce drying and the severity of the flash drought.
Thru 8-18-25
Thru 8-11-25: drying out has started. Potential flash drought by months end.
Thru 8-4-25 Last of the good rains for some of us
Thru 7-27-25
7 day rains to last Sunday, the 20th Of July HUGE RAINS!

