BEARISH corn!
BULLISH beans!
BULLISH cotton!
Previous thread:
Grains 7-27-25
47 responses |
Started by metmike - July 27, 2025, 8:39 p.m.
https://www.marketforum.com/forum/topic/113471/
Latest weather:
·
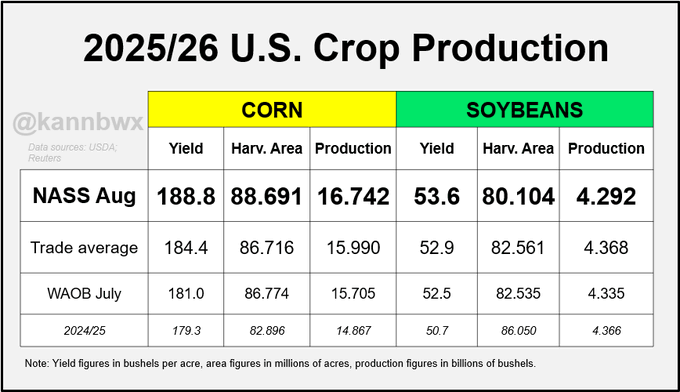
US corn yield comes in above all trade estimates. Soybean yield lands at the top end but production is down.
Big harvested area moves in US corn and soybeans..... made for a massive corn crop above all expectations, but soybean output is lower than previously predicted.
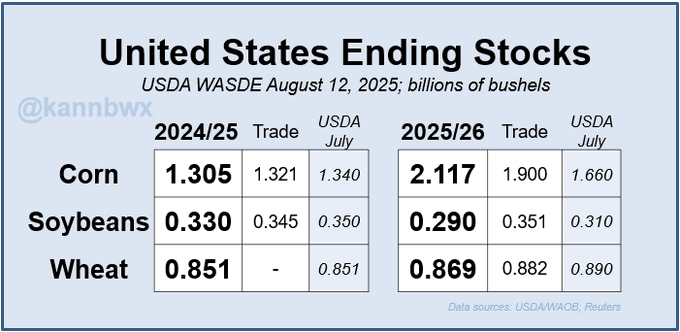
Old crop corn and soybean exports were up, trimming stocks. New-crop corn stocks come in high on a massive crop, but soybean stocks are lower than previously predicted, and new-crop exports were cut.
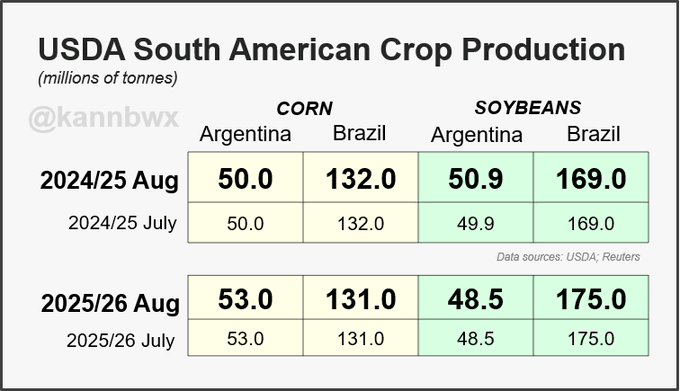
USDA increased 2024/25 Argentine soybean production, but all other major South American corn/soy estimates were unchanged. No change to 2024/25 Brazil corn production despite industry estimates moving higher.
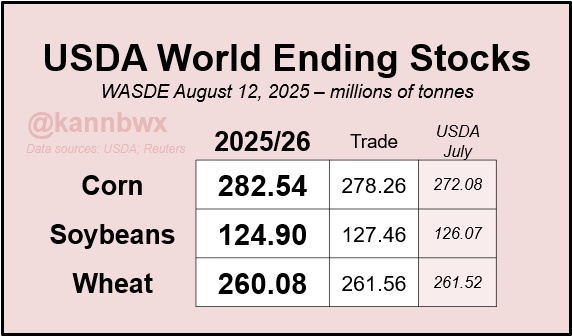
Big story on the world stage is the absolutely massive US corn harvest estimate. US soybean and wheat stocks contracted from last month, and that was reflected in the world numbers. No change to new-crop Chinese imports and very minimal changes to crops in S. America this month.
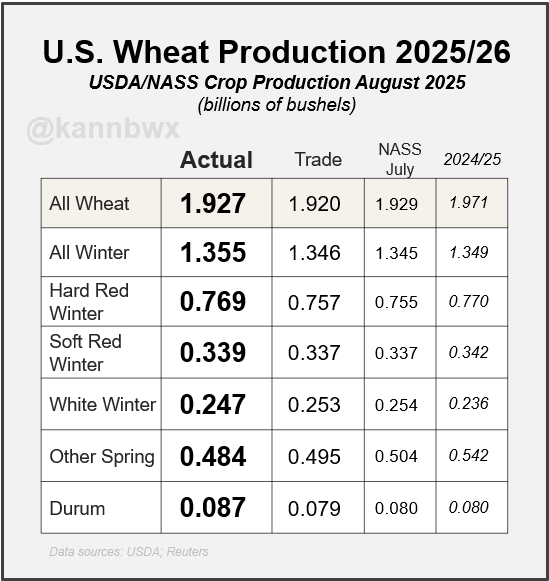
Overall, minimal change to 2025/26 US wheat production from last month. Higher winter output offset lower spring output.
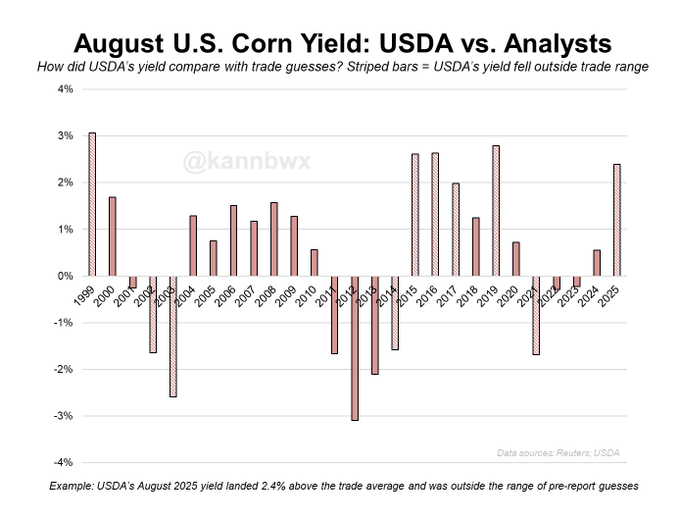
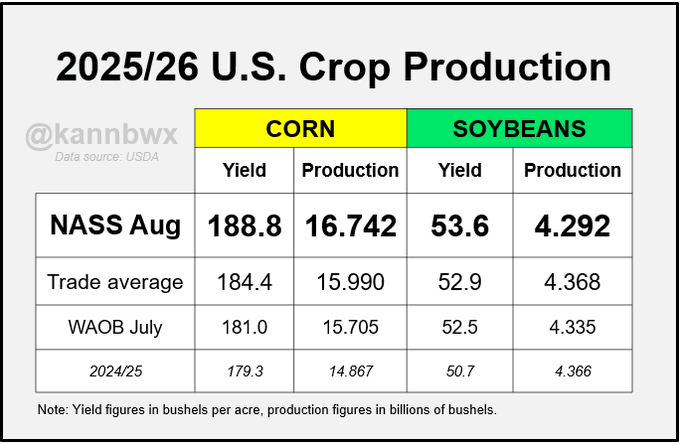
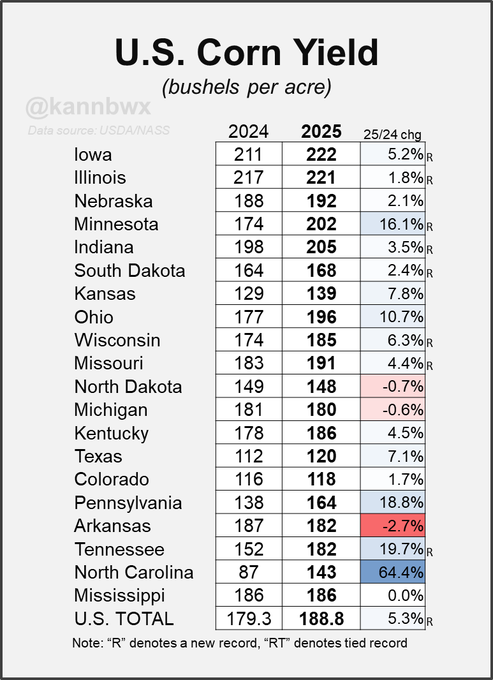
SDA sets 2025 US corn yield at 188.8 bu/acre, far above the year-ago record of 179.3. Here's how the 2025 yields compare with last year. Records expected in many of the top states.
USDA's 188.8 bu/acre US corn yield lands outside the range of trade estimates for the 7th of the last 12 Augusts. The yield was 2.4% above the average trade estimate, not quite as extreme as the 2015, 2016 & 2019 misses.
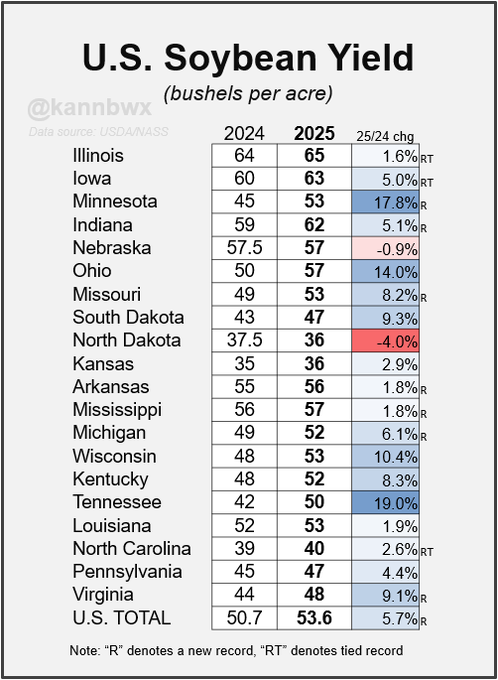
USDA projects 2025 US soybean yield at 53.6 bu/acre, well above 2016's record of 51.9 bu/acre. Last year finished dry, and soybean yield suffered. Here's how the 2025 estimates compare with a year ago by state.
Huge drop in US soybean planted acres versus the June survey. Lots of losses across southern states. Total planted area is seen 7% lower than a year ago. This is the lowest "natural" US bean area in 12 years (I'm excluding 2019 since weather extensively limited planting).
metmike: Some of those areas with the huge drops were TOO WET to plant. This also reduced cotton acres!
Crop Production
https://release.nass.usda.gov/reports/crop0825.pdf
Corn Production Up 13 Percent from 2024
Soybean Production Down 2 Percent from 2024
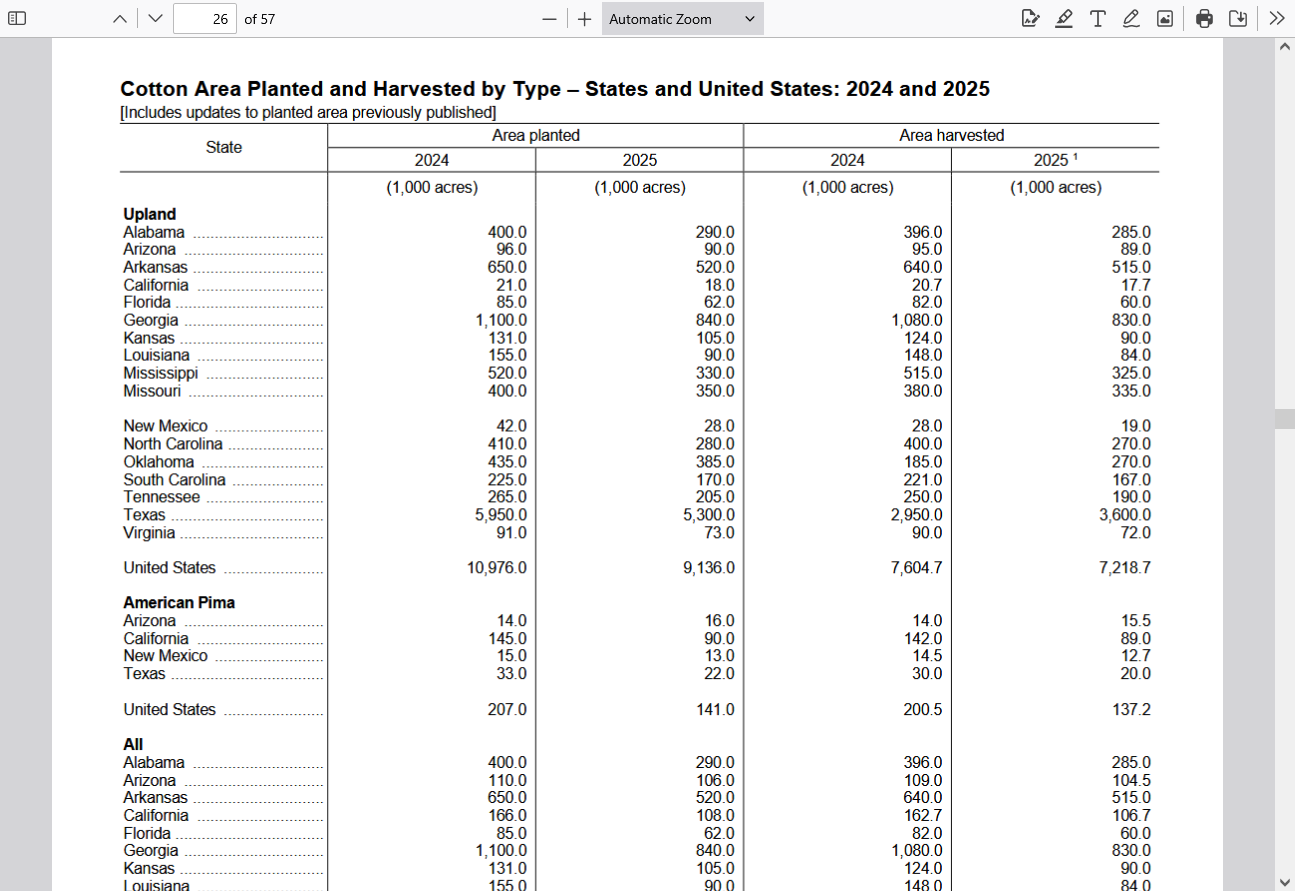
Cotton Production Down 8 Percent from 2024
Winter Wheat Production Up 1 Percent from July Forecast
All cotton planted area totaled 9.28 million acres, down 8 percent from the previous forecast and down 17 percent from
2024. All cotton area harvested is forecast at 7.36 million acres, down 6 percent from 2024. All cotton production is
forecast at 13.2 million 480-pound bales, down 8 percent from 2024. Based on conditions as of August 1, yields are
expected to average 862 pounds per harvested acre, down 24 pounds from 2024. Upland cotton production is forecast at
12.9 million 480-pound bales, down 8 percent from 2024. Pima cotton production is forecast at 364,000 bales, down
23 percent from 2024
++++++++++++++++++
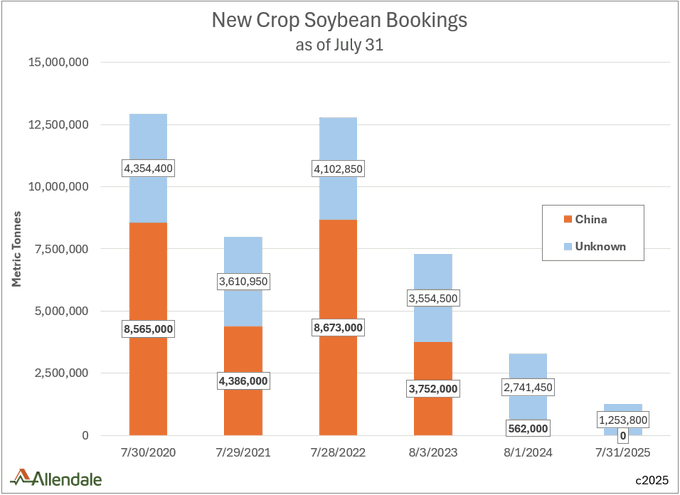
Imagine where bean prices would be right now if Trump hadn't completely killed sales to China this year!
From yesterday:
metmike: This is why the USDA is predicting record yields.
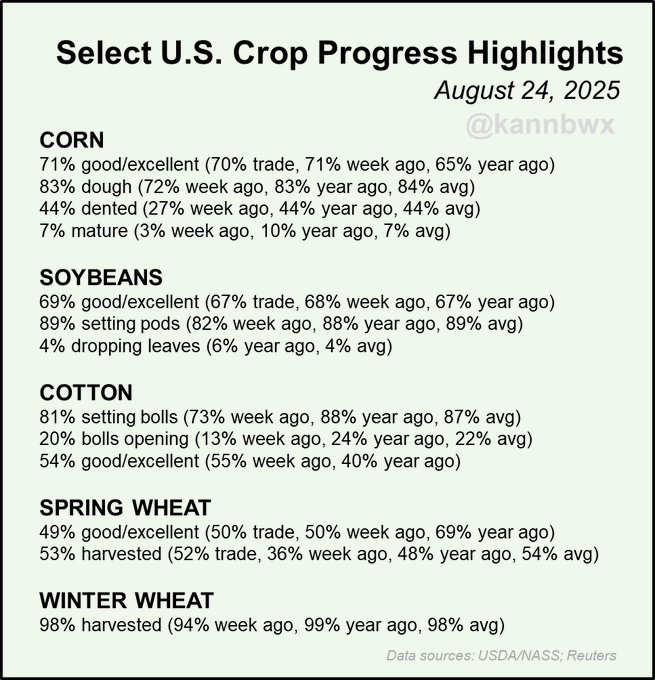
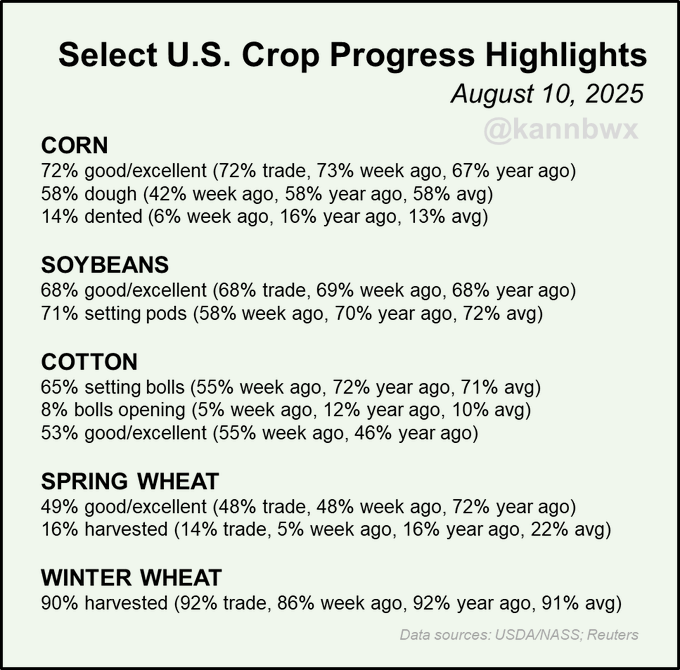
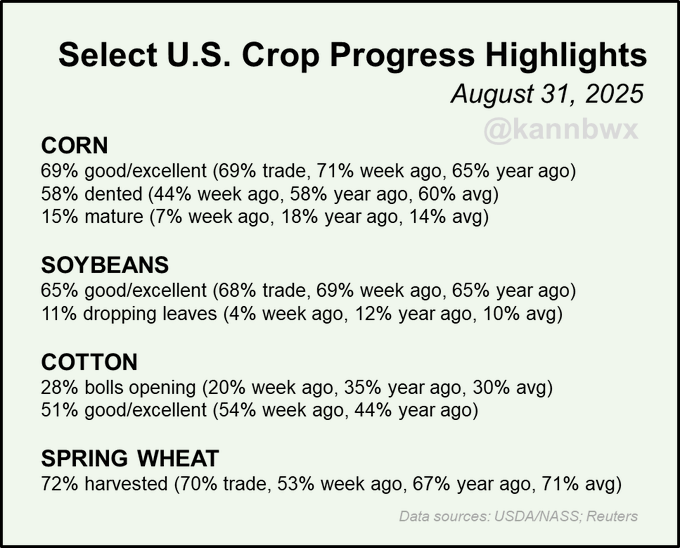
US corn and soybean conditions each drop 1pt as expected this week, cotton drops 2pts. Spring wheat harvest is moving a bit faster than predicted (but slower than average). Winter wheat harvest is nearly complete (and 2026/27 planting is not far away!).
++++++++++
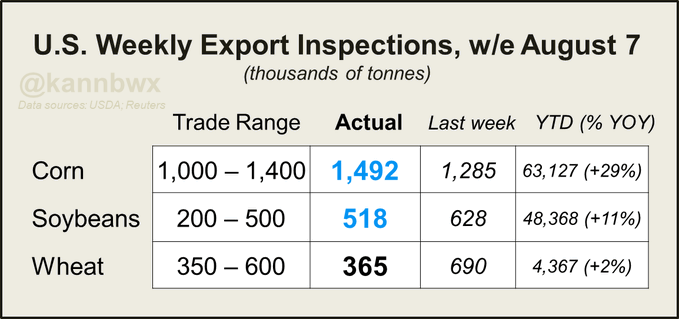
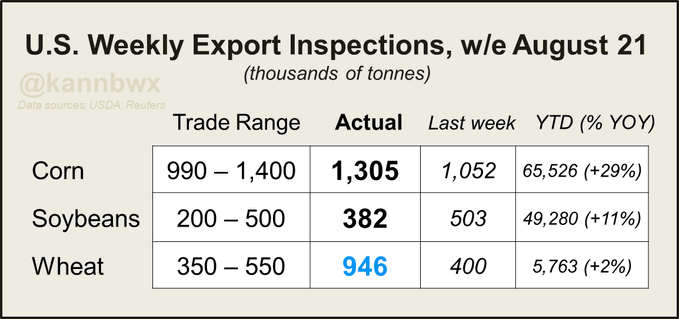
Last week's US corn and soybean export inspections top all trade estimates. Wheat comes in at the low end. No cargoes inspected for China.
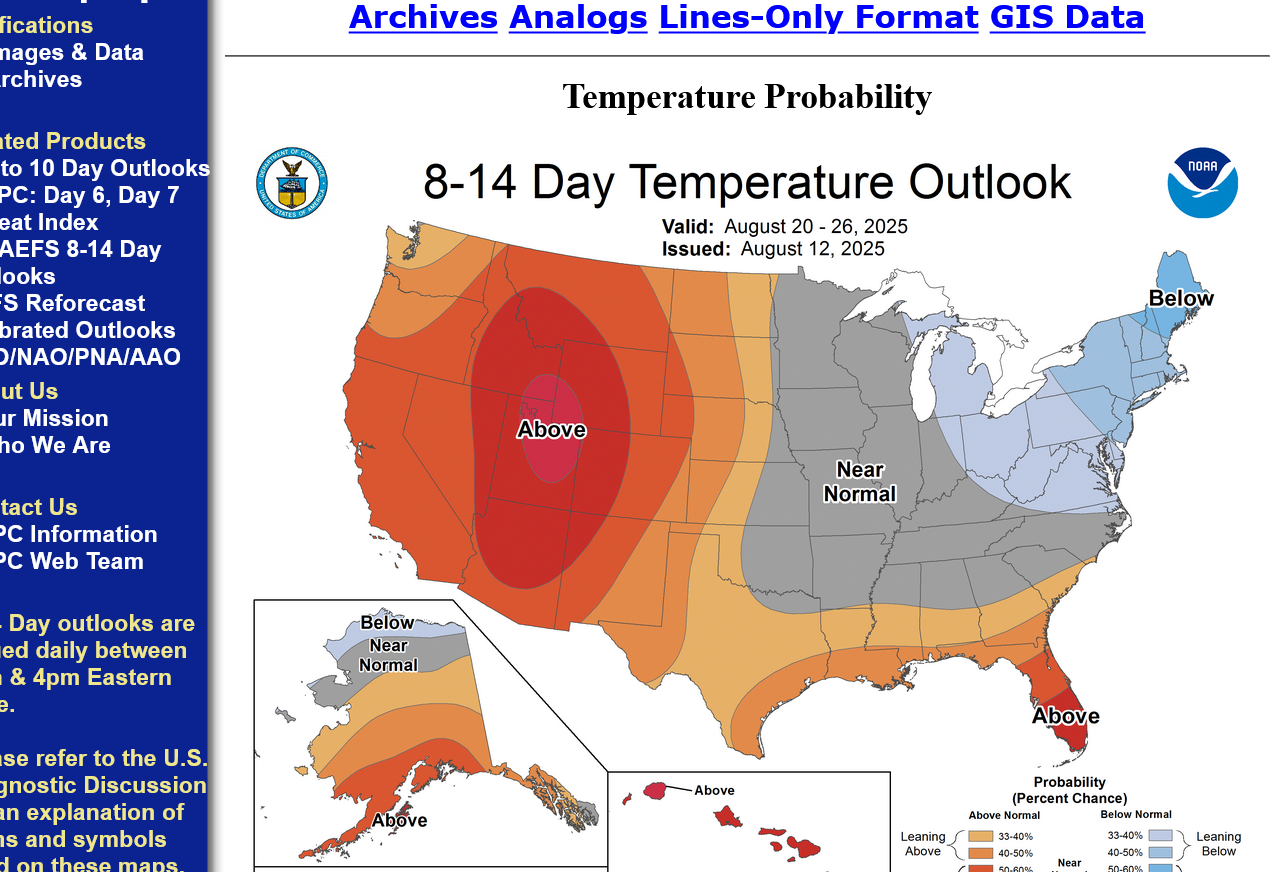
The weather forecast has been getting cooler and cooler the last several days. The NWS is finally catching up.
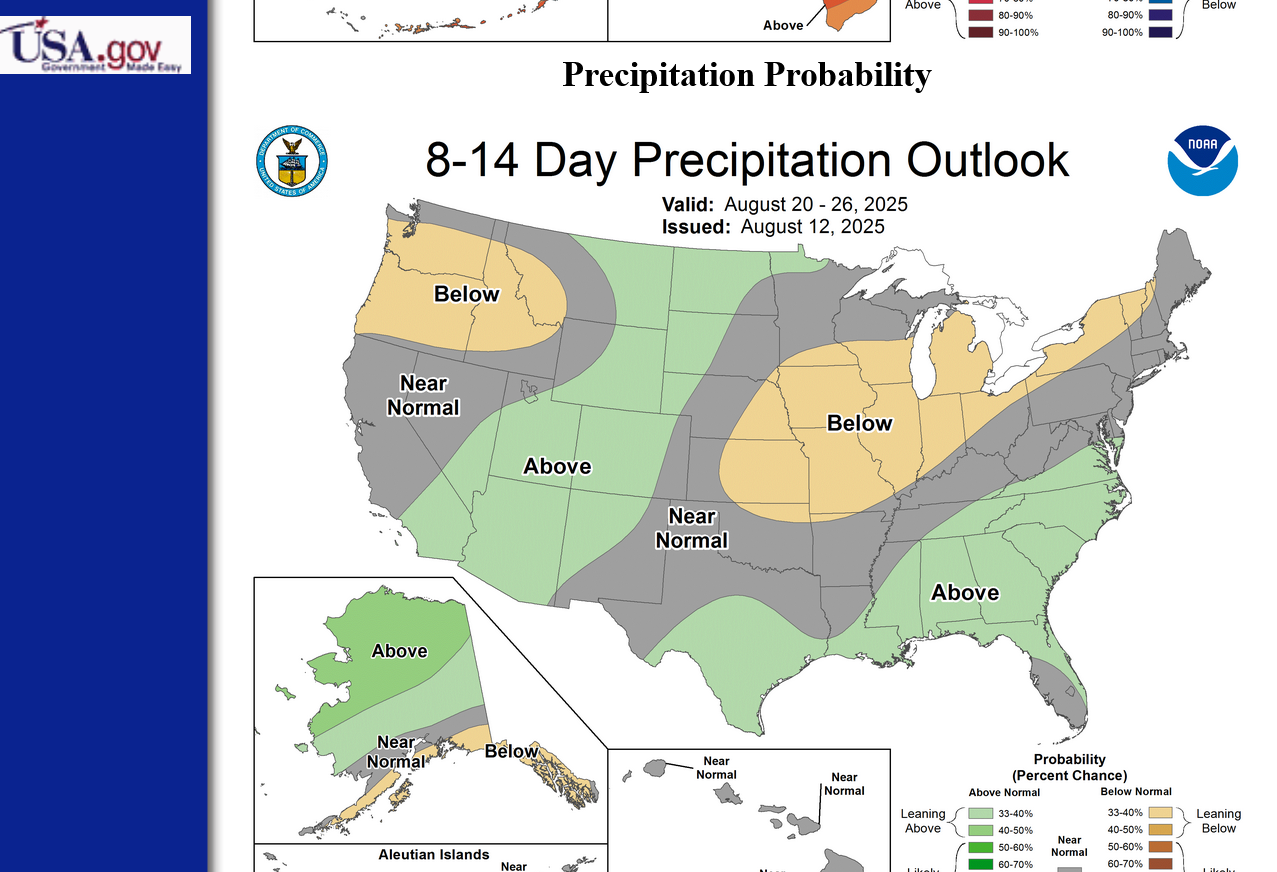
With the northern stream becoming more dominant and the heat ridge backing up, this will also be a DRY pattern. Good for slowing the maturity rate of corn plants and extending kernel filling, and with ample soil moisture for corn that has deep roots(though more rain than this would be optimal).
August is critical pod filling for beans. Dry weather will take off the top end of yields in places that miss out on all the rain, even without intense heat. However, a cool down will reduce stress and delay a flash drought which is still likely in MANY areas with this pattern as we start September.
All the latest weather here:
Matt was in this morning!
Been posting at the older/previous link the last few days:
Re: Re: Re: Re: Re: Grains 7-27-25
By metmike - Aug. 15, 2025, 1:37 p.m.
Still not much rain in most of the belt the next 10 days(exception is the far Upper Midwest).
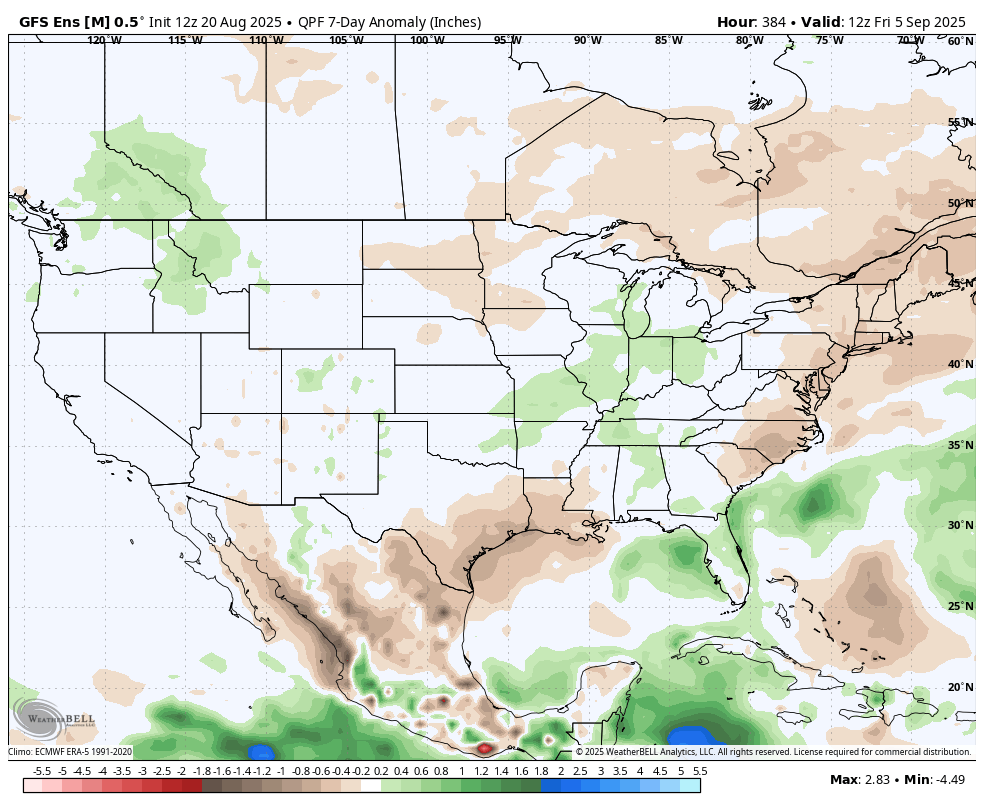
10 day totals from the last 6z GEFS(heavy in the far north areas:
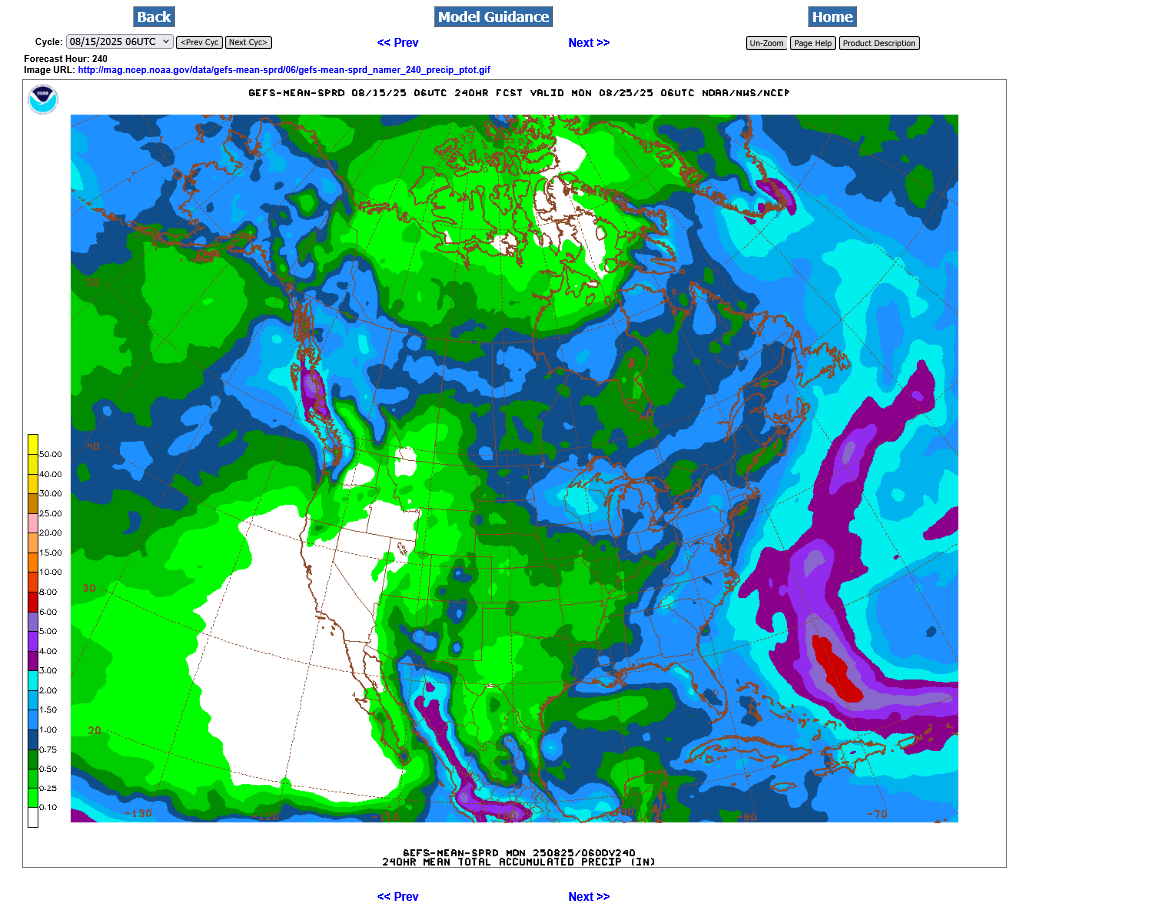
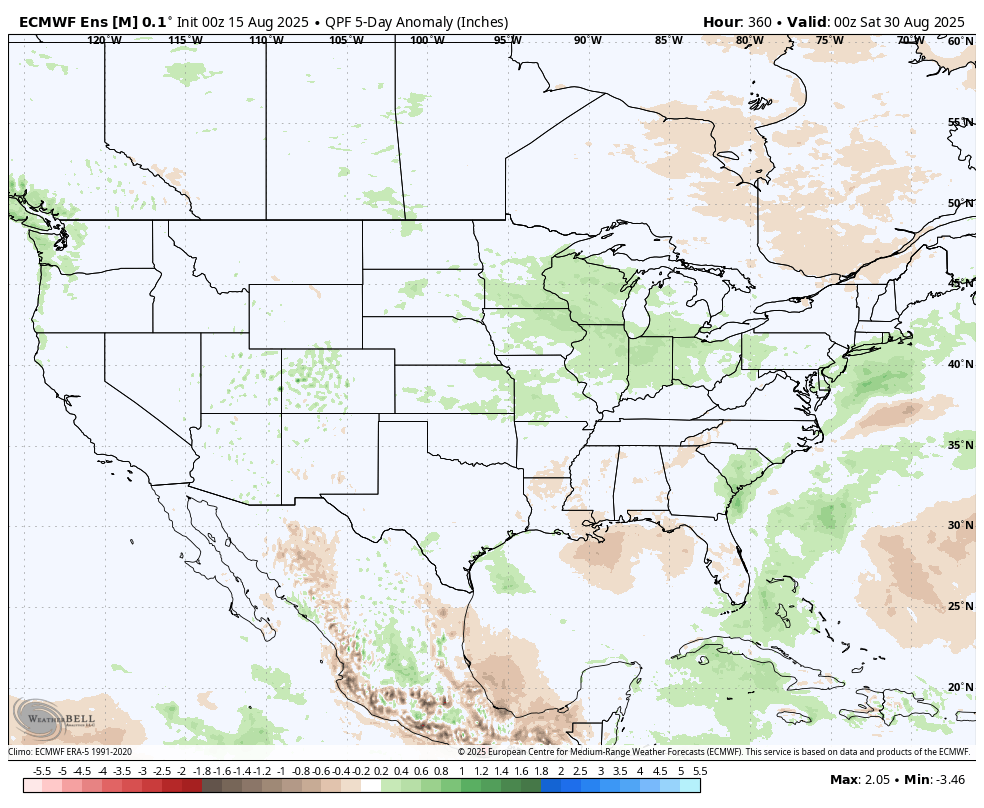
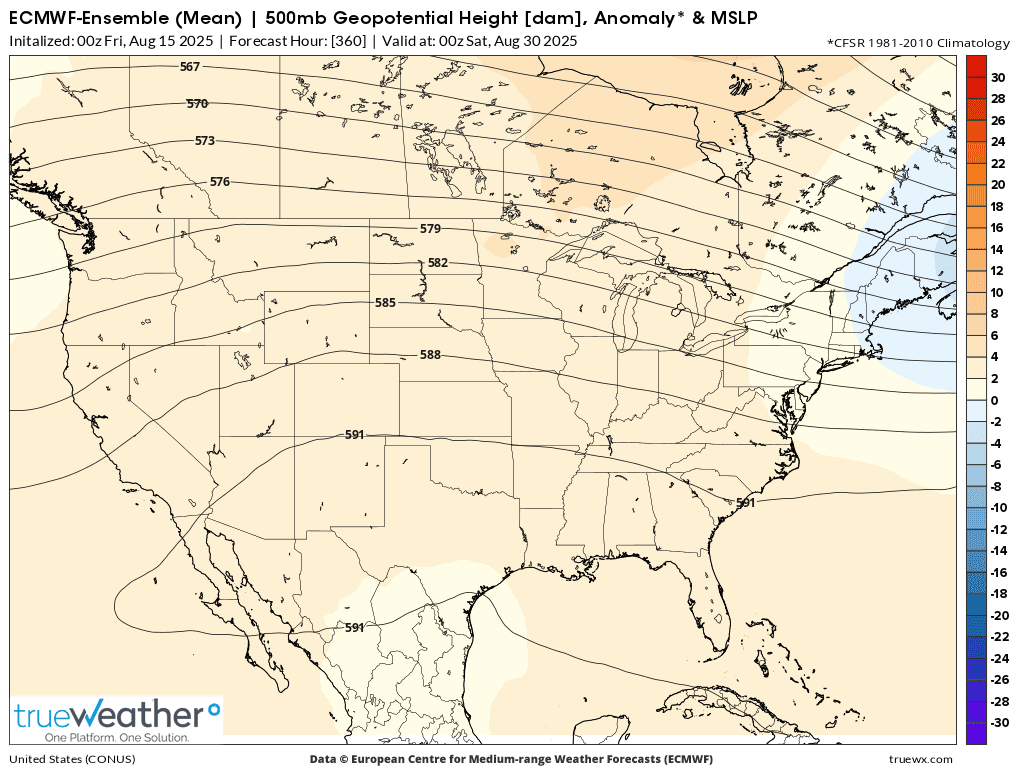
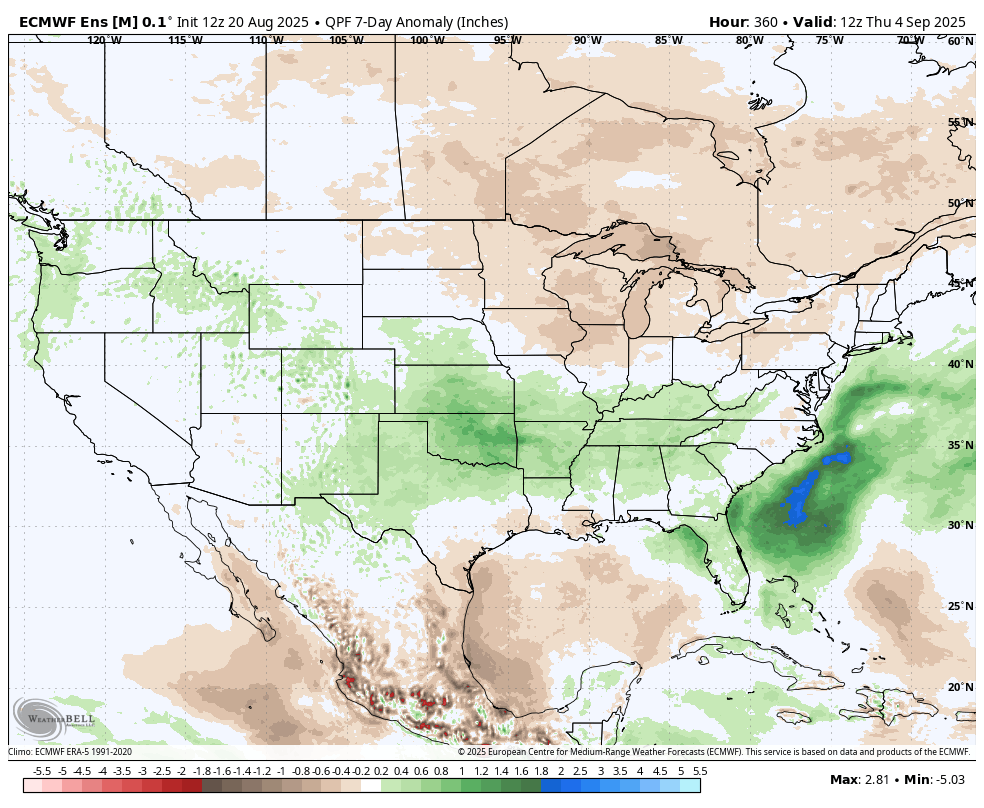
However, the European Ensemble model continues to greatly boost rains late in week 2. We need this to avoid a flash drought.
1. Rainfall anomaly days 1-10
2. This is the rainfall anomaly for days 11-15 from that model:
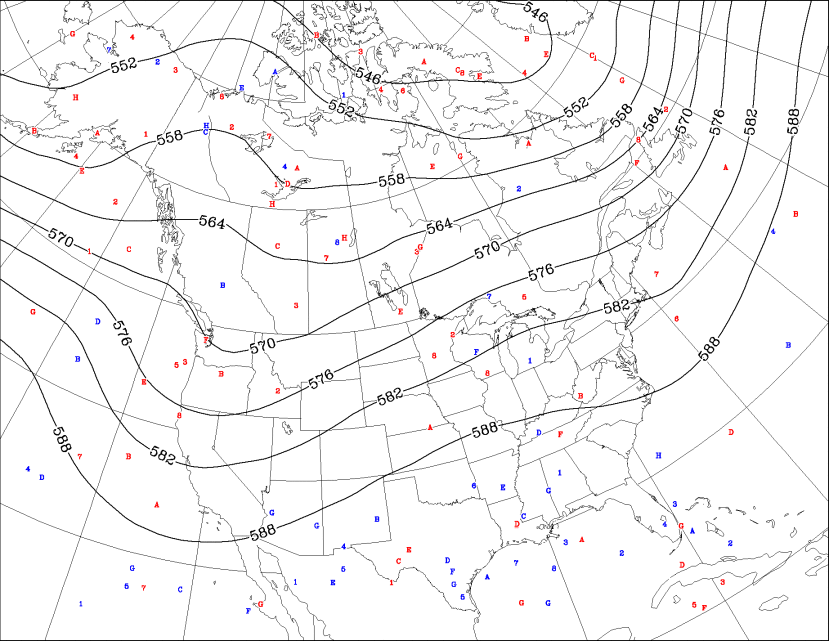
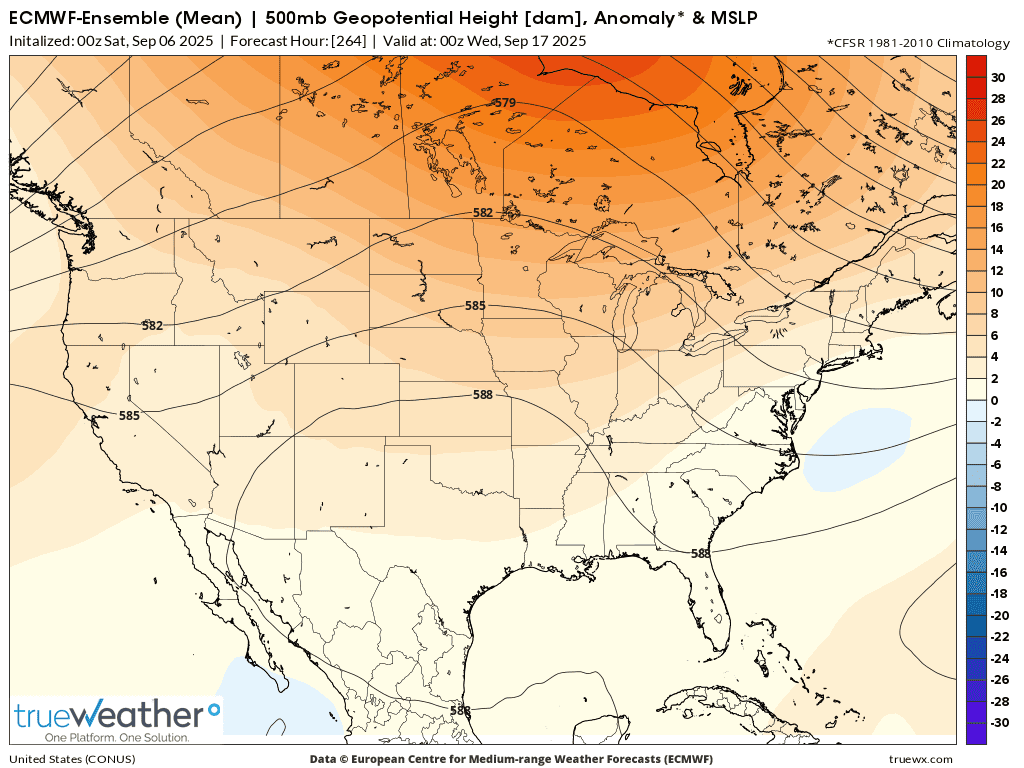
3. The heat will really start picking up late in week 2. This was the last 500 mb map from the EE model.
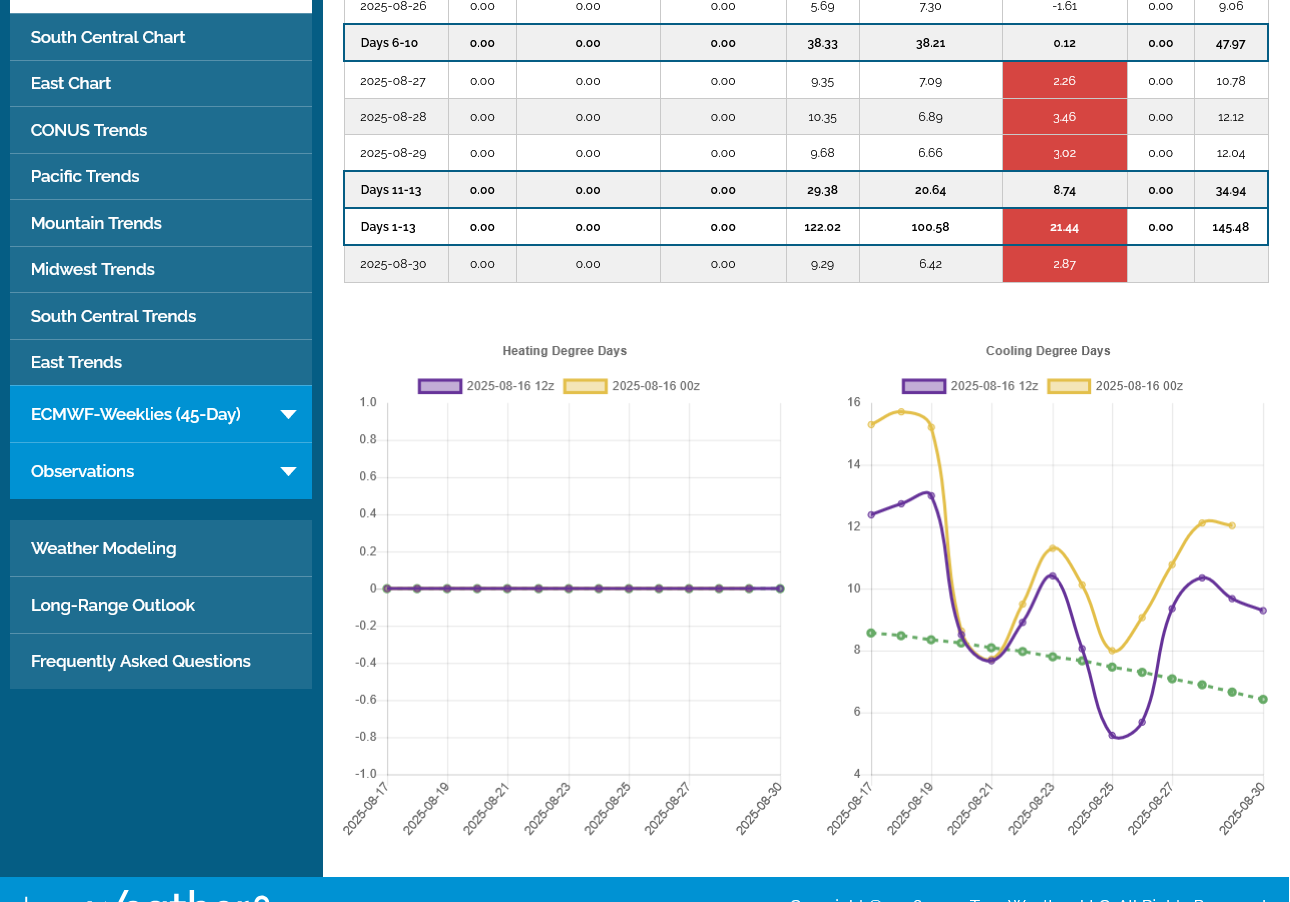
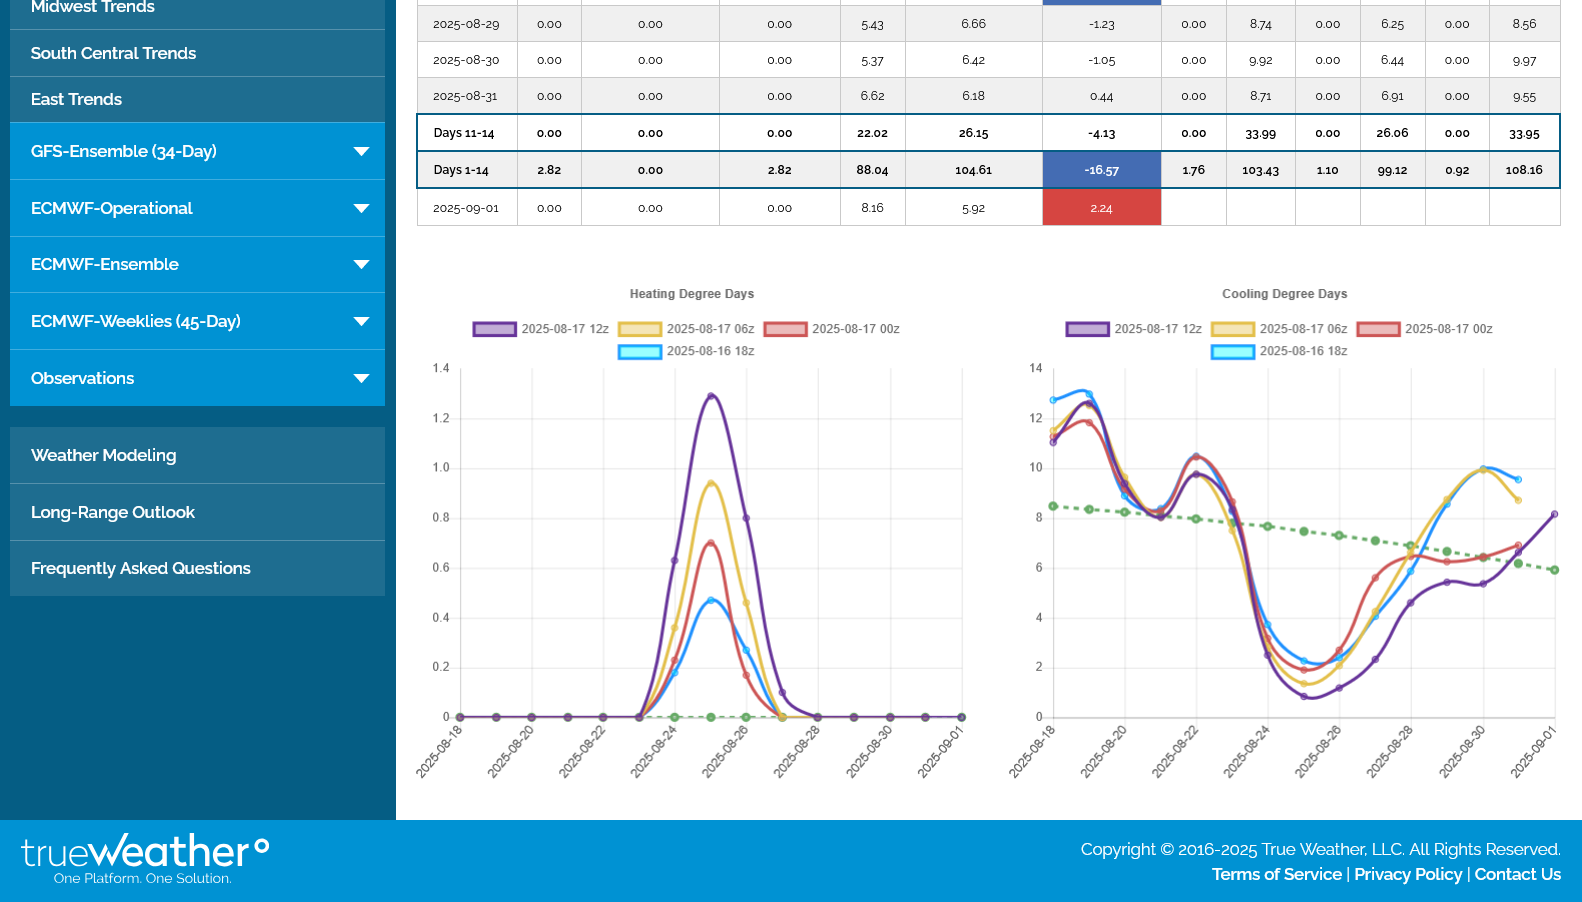
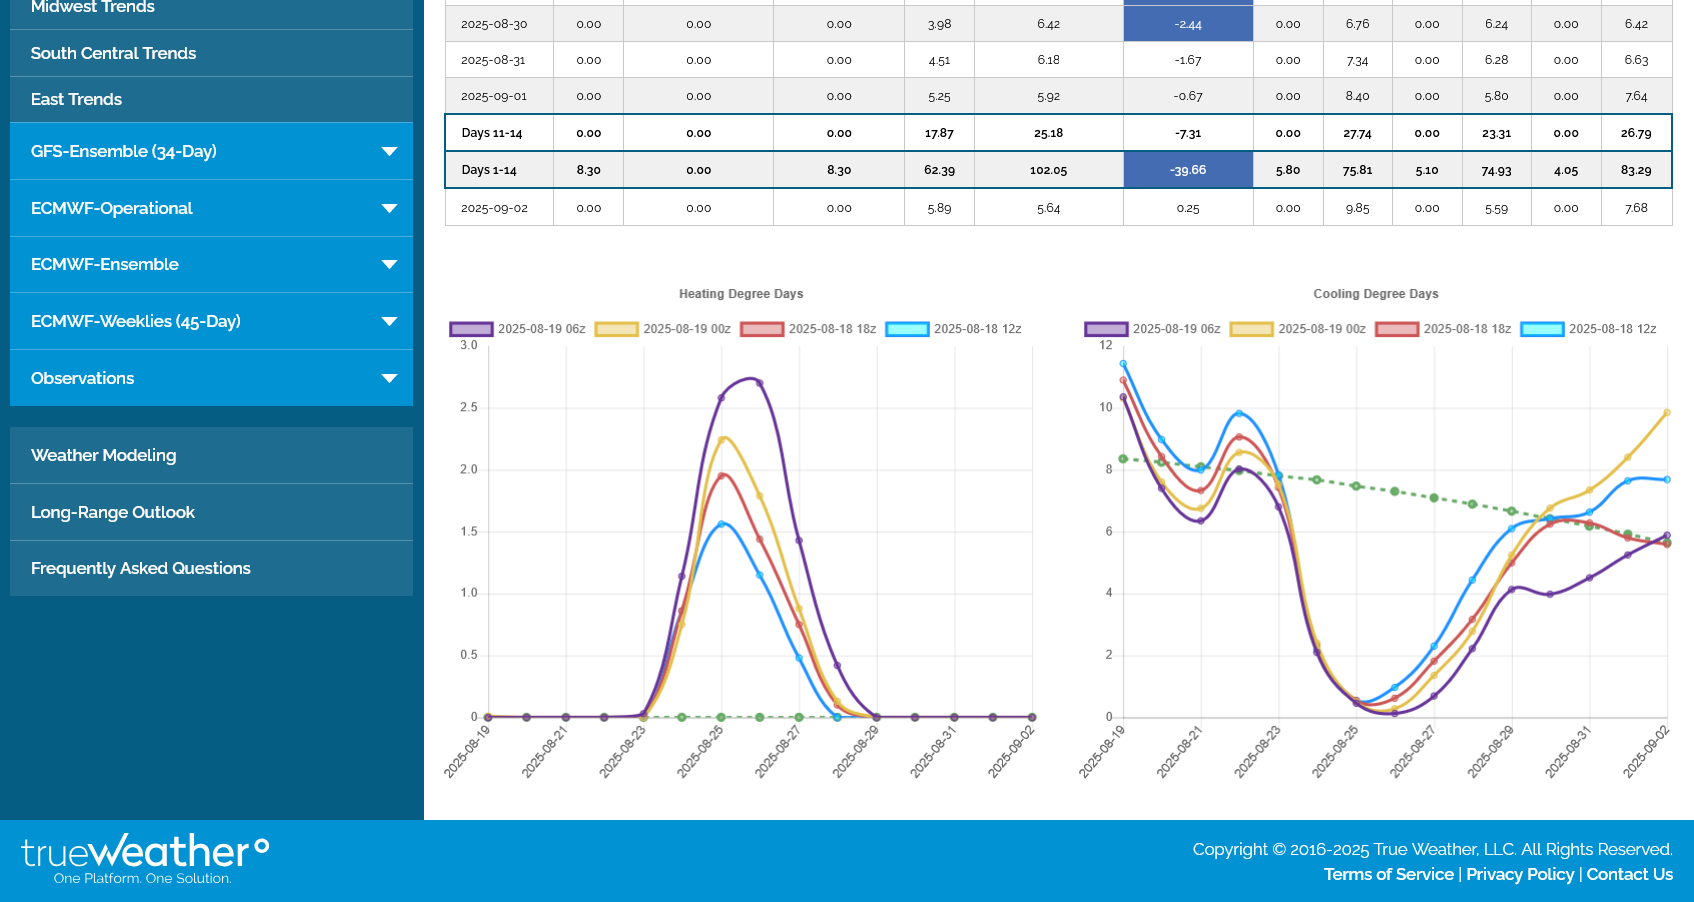
4. CDDs for just the Midwest. Note the strong upward trajectory for the last 4 data points. This is the new pattern that will feature much more heat in week 3.


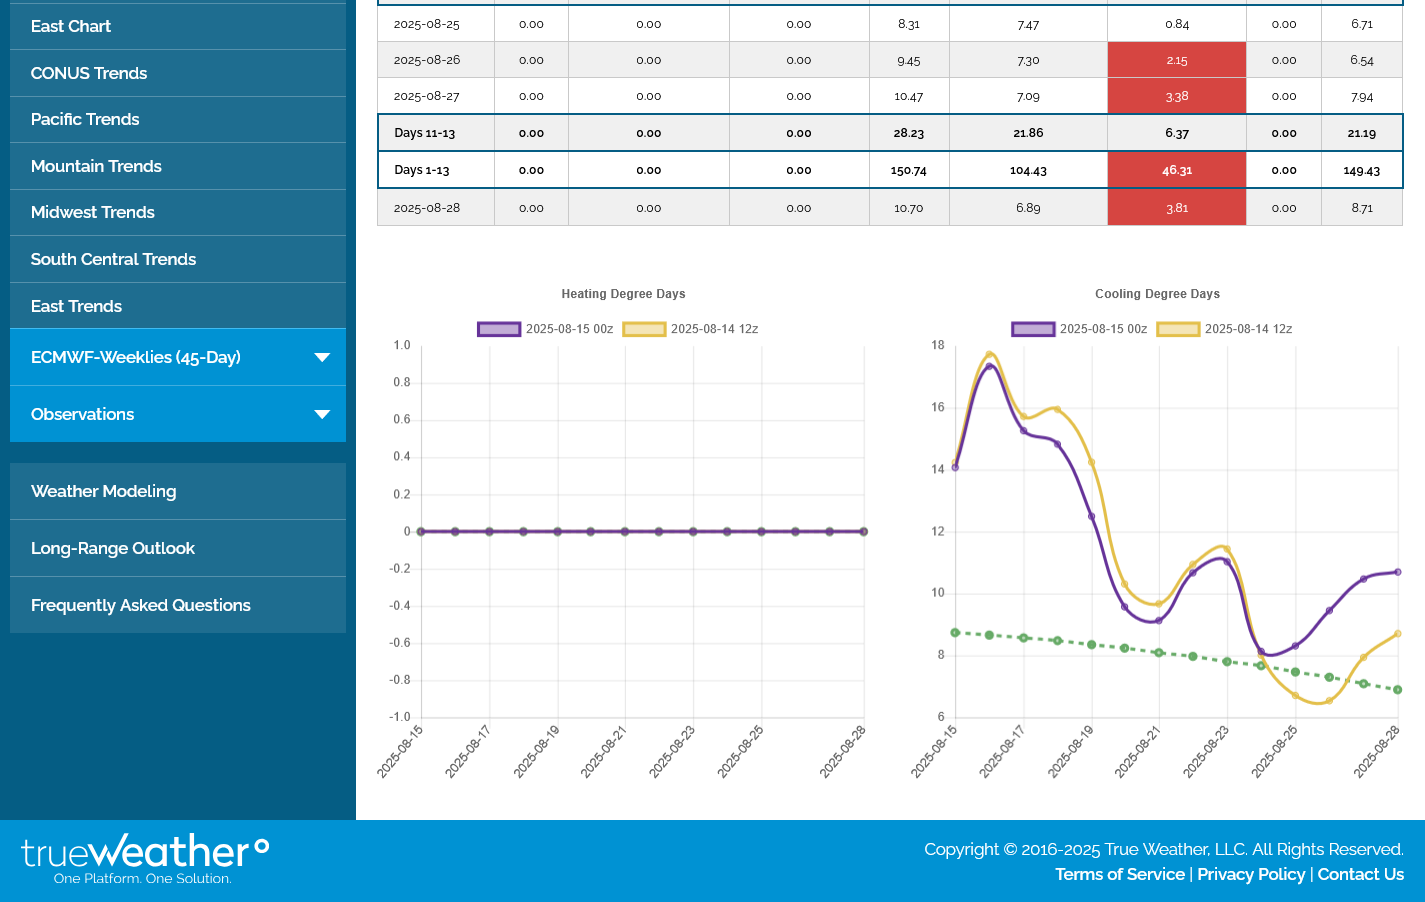
The last 12z GEFS run for just the Midwest(purple) had a mind boggling -21 CDDs compared to the previous run.
In fact, the last 4 data points late in week 2 have a completely different trajectory compared to the previous 3 runs(that were going straight up-from heat expanding rapidly). This last run maintains the cooler pattern for at least several more days at the end of the period because of a stronger northern stream which the models have not predicted well all Summer.
after this hot dry period I would bet most of those 188/a guys would like a do over. Many places were short the last couple of rains and with 100 plus heat index you can already see some of the earlier planted fields dropping under developed ears. Also many big time corn choppers for feed {usually dairys] are getting geared up to chop 2 weeks early.
Thanks, mcfarm!
Yeah, that 188 bu/acre was a shocker.
I won’t go into why I think the USDA is dishonest for self serving reasons again right now but it’s just another example of their numbers being outside the entire range of guesses by all the market experts, some of which have experienced agronomists along with massive, comprehensive measuring data that is greater than what the USDA uses In some realms.
Just about everybody overlooks positive benefits from the increase in CO2 in this great climate optimum.
The last 12z European ensemble mean model(purple/right) was a whopping -23 CDDs cooler compared to the previous run for just the Midwest.
With more northern stream and less ridging building in from the south(with warm/humid air returning with the previous solutions) its also a bit DRIER in week 2 than the previous runs that weres showing an uptick in rain amounts/chances.
Less ridging in the Southeast now. This could end up MORE bullish if the upper level ridge stays farther west and especially if it builds north into the Plains/Midwest, where the greatest positive anomalies are now.
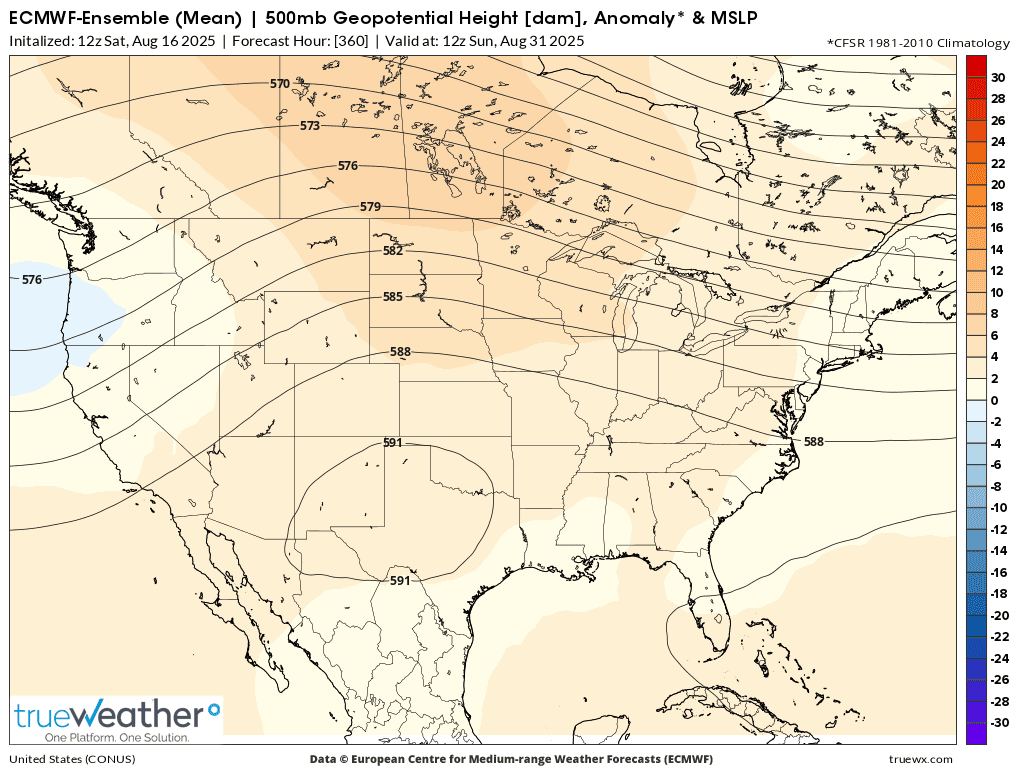
Yesterday's solution at the end of week 2: Huge upper level ridge across the entire south with warm humid air pushing northward beneath it, increasing rains in the Midwest/areas north of the ridge.
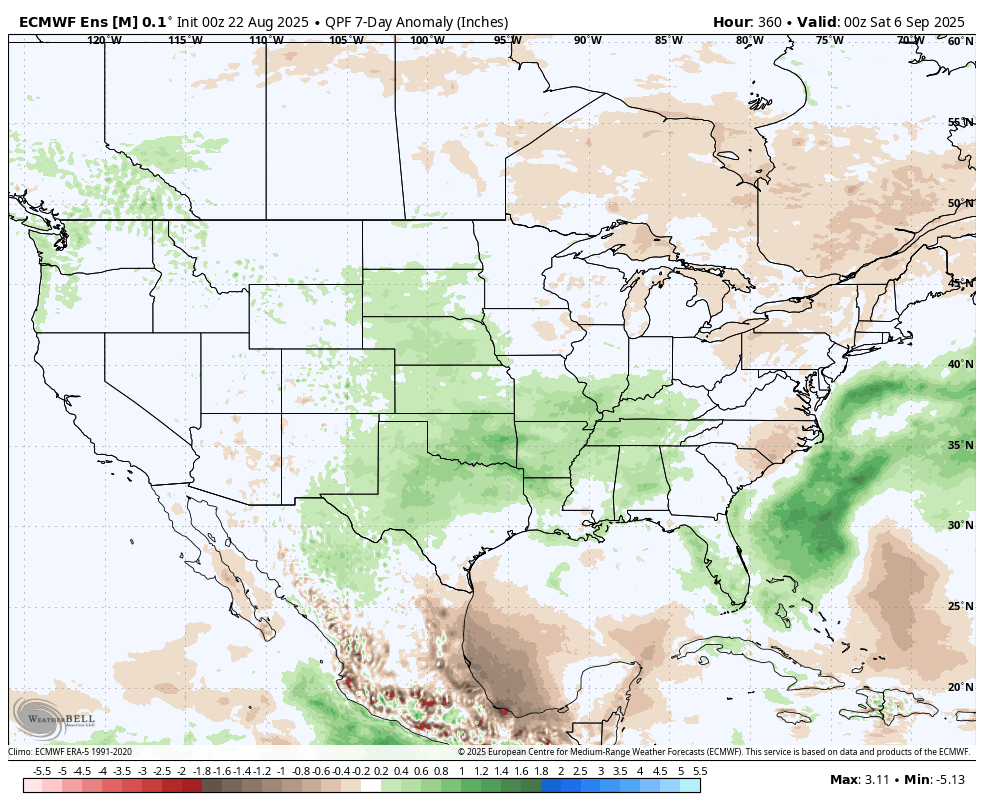
Regardless of the high uncertainty at for the last week in August and start of September, this is the 7 day rainfall map.
Pretty close to what was expected the last several days. Nice rains in the Upper Midwest. Drying out in the I states to Ohio with some intense heat for the next several day increasing the drying rates and causing big time HEAT FILL for corn kernels in the southern areas.
7 Day Total precipitation below:
http://www.wpc.ncep.noaa.govcdx /qpf/p168i.gif?1530796126

Here's our best thread for explaining and illustrating this principle:
HeatFill for Corn
Started by metmike - July 14, 2023, 2:47 p.m.
"nice rains"....its all relative. Some of the wet places in Minn got a nice 7 inches. That is what is hurting crops up north.
Thanks, mcfarm.
Not surprising in August, when you have an active pattern around the periphery/over the top of a heat ridge. Storms often have a tremendous amount of water vapor coming up from the south to feed on. In this case, we had 70 deg. F dew points all the way to southern MN.
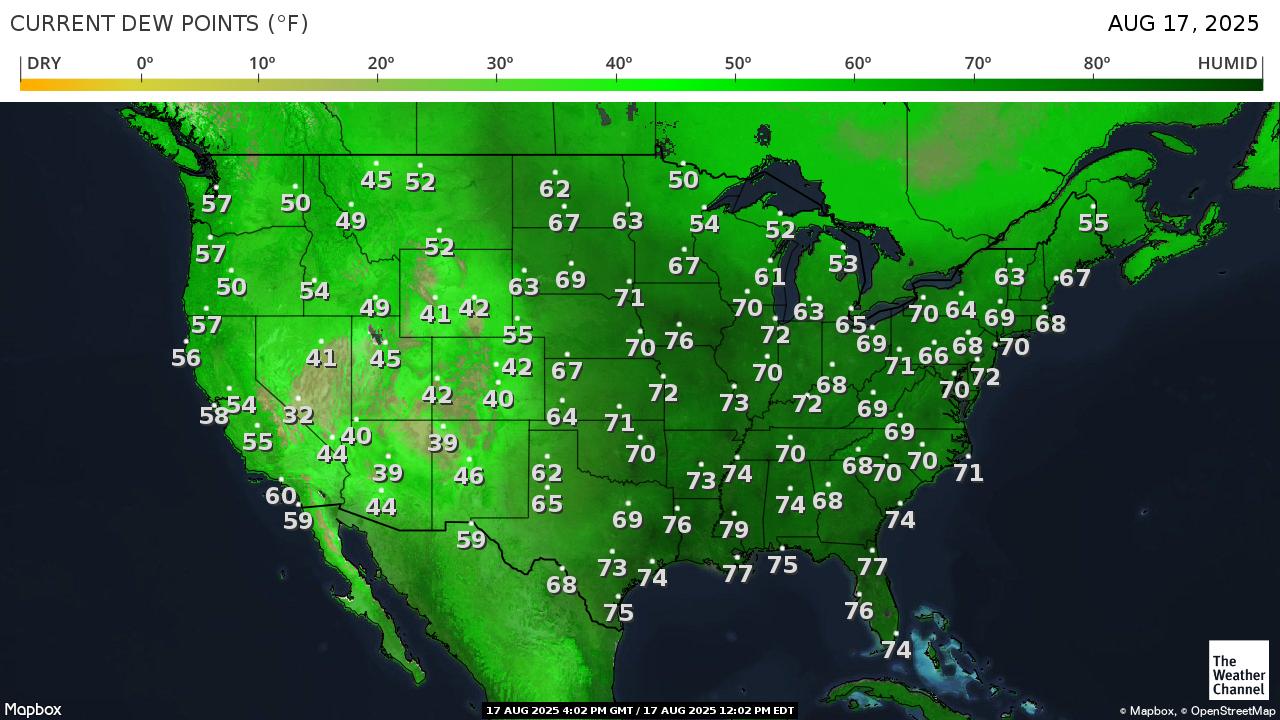
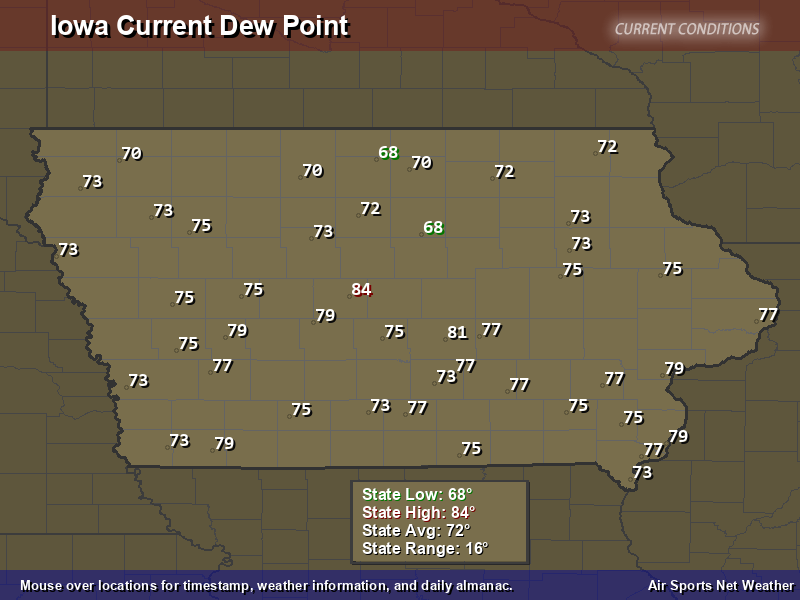
I counted 8 stations with instruments near heavy transpiring cornfields in IA that had 79+ degree dew points last hour with an incredible 84 deg. F dew point in central IA!
https://www.usairnet.com/weather/maps/current/iowa/dew-points/
Rains the past 7 days thru yesterday/Saturday morning. The tiny yellow specks were 8 inches of rain.
Additional follow up to this and the impact in Indiana this weekend:
Re: mother nature in total control again
By metmike - Aug. 17, 2025, 3:38 p.m.
Re: Re: mother nature in total control again
By metmike - Aug. 17, 2025, 3:44 p.m.
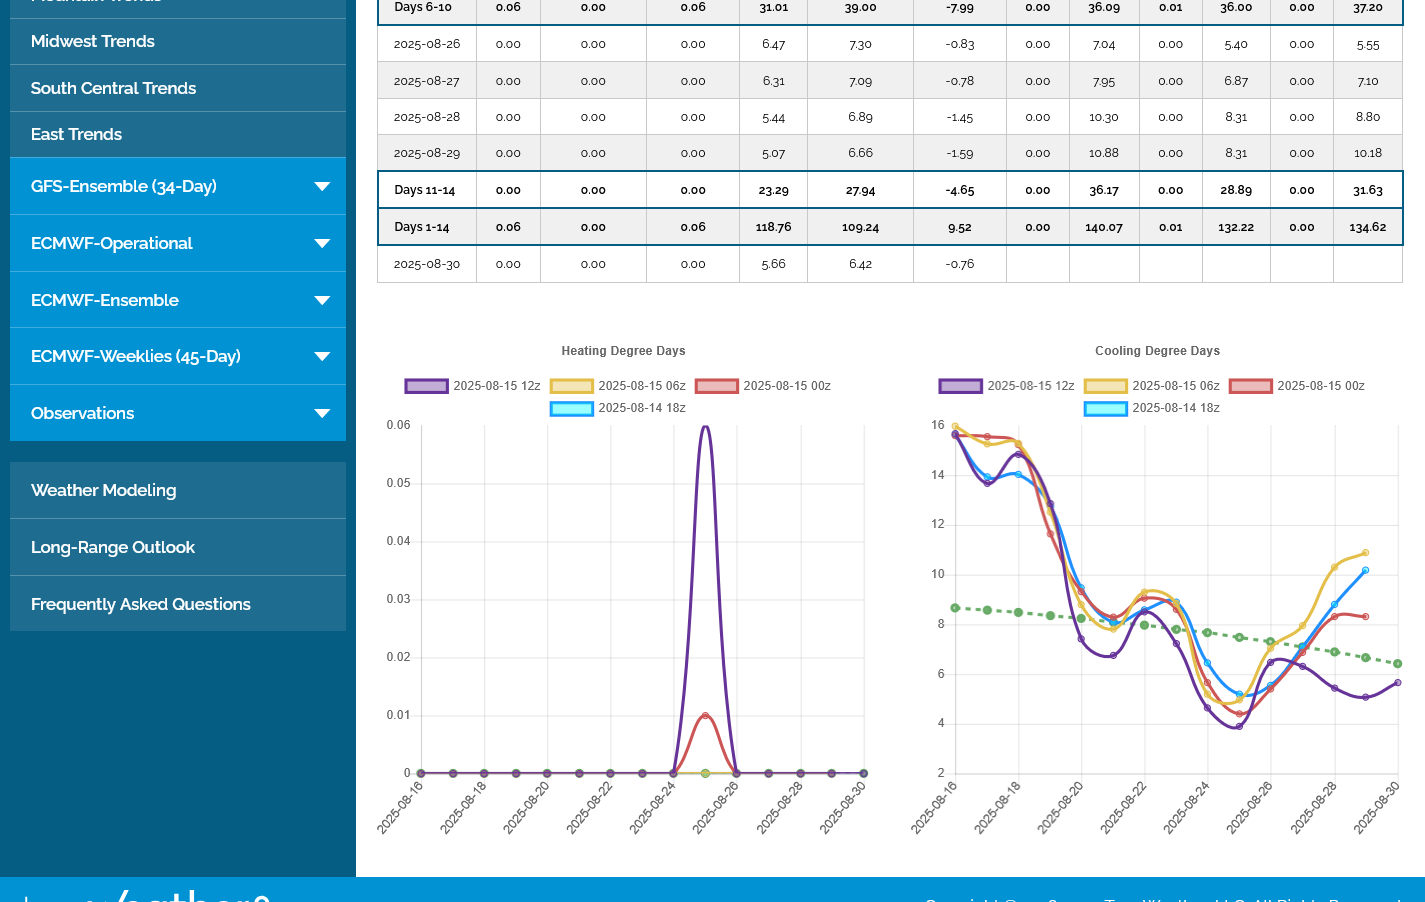
1. These were the last 4 runs of the cooler GEFS model, for just the Midwest. The last 1 on the right in purple, 12z run shows another huge drop of -14 CDDs. This is mind boggling cooling compared to expectations earlier this month.
So much cooling that we actually have some HDDs on the left!!!
2. This was the same graph from 12 days ago(8-5-25), BEFORE the models caught on to how much northern stream influence would blast down from Canada.
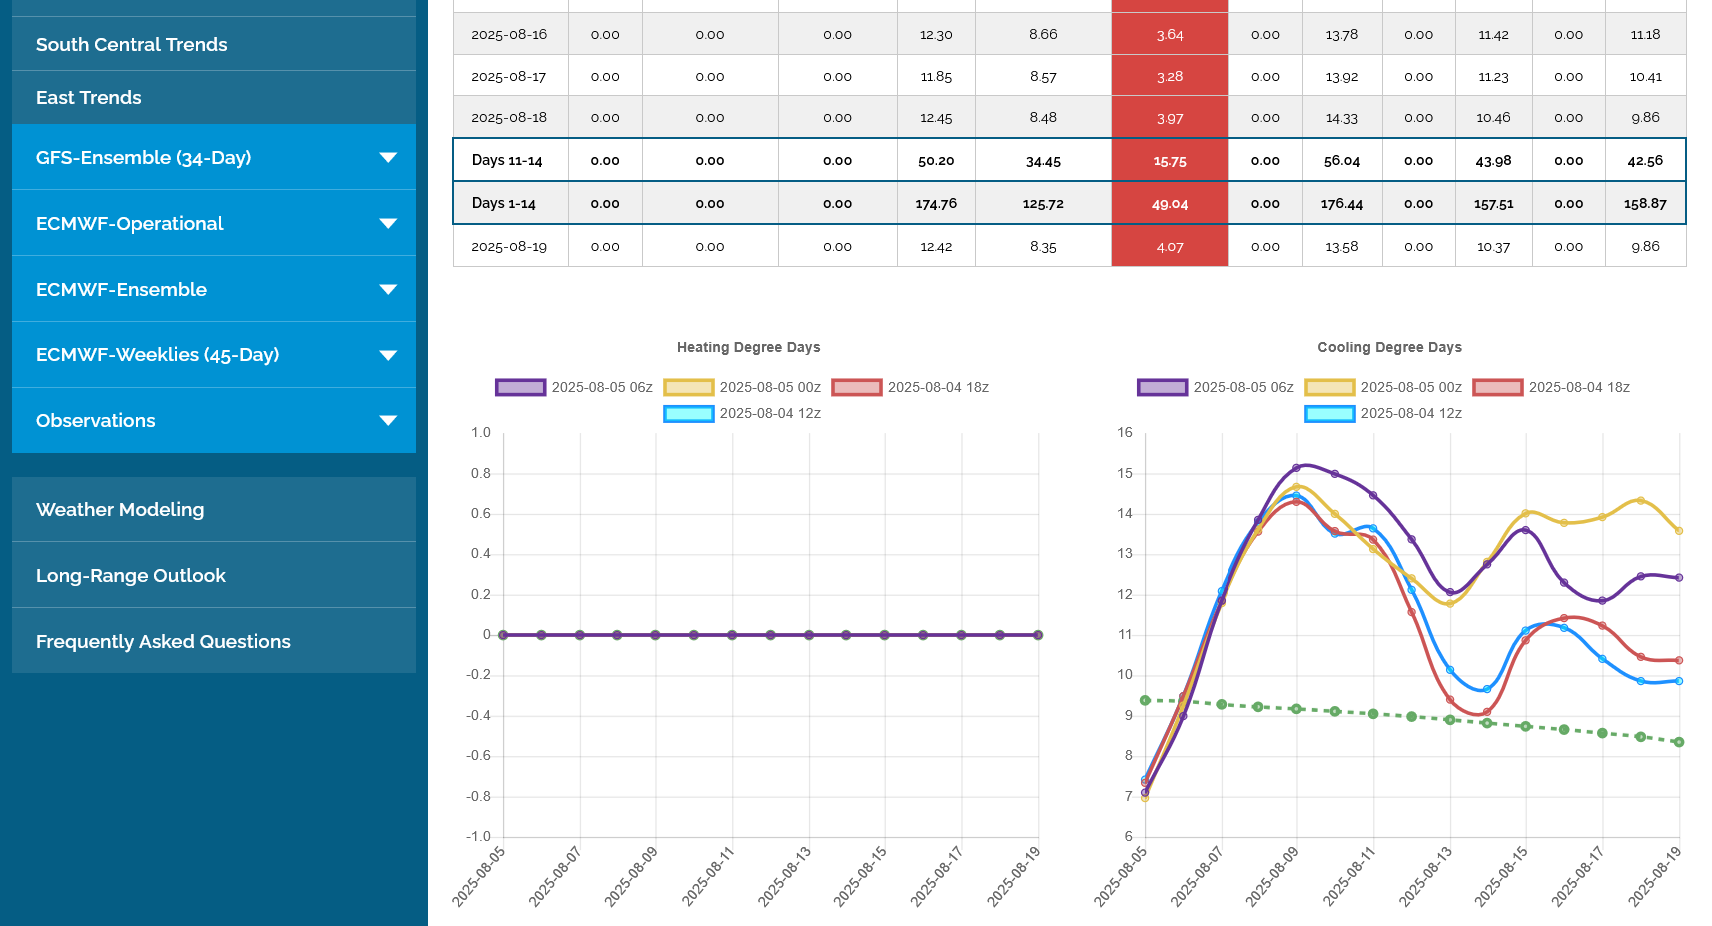
There was a progression of days of course but the total CDDs for the Midwest on the 8-5-25 was 175 CDDs.
The total CDDs for the Midwest for the same length of time(15 days) on 8-17-25 is 88 CDDS.
-87 CDDs in the forecast from 12 days ago. Granted, seasonally we should be dropping at the rate shown by the green dashed line and maybe have lost ~15 CDDs seasonally for this region/chart. So the drop was -72 CDDs on top of the seasonal adjustment downward.
This is likely in the top 10 for cooling changes this quickly in August for the Midwest for the last couple of decades.
Grains under a bit of pressure from the start from that much cooler weather forecast described above.
Beans -6c, Corn -2.5c.
The much cooler weather for individual days was dialed in overnight.
The day session traders decided that was old news and jumped on the lower prices at 8:30 am with aggressive buying from the get go.
The 2nd half of August, historically in good crop years have a positive seasonal(after the market sees the HUGE August crop report) and does a sell the rumor, buy the fact price reaction.
This seasonal turns back down in September as we start early harvesting.
Despite the much cooler period coming up:
1. Most places will experience net drying. The return of rains during week 2 is uncertain. Flash drought possible.
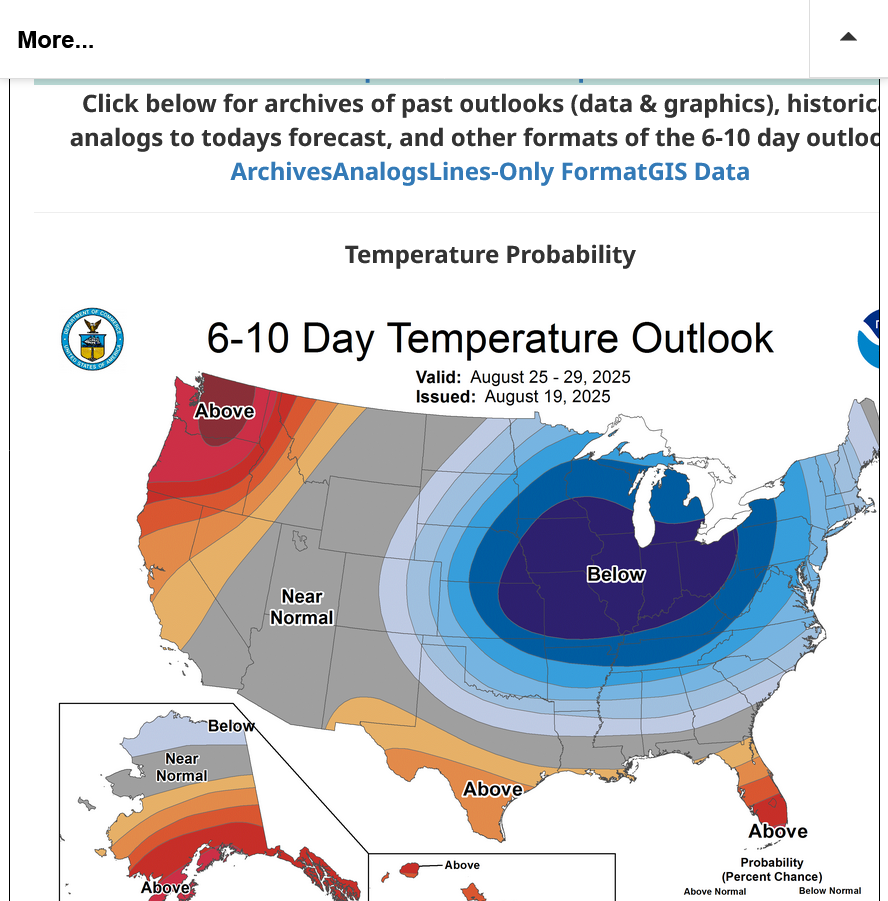
2. Temps will heat back up late in the month.
3. The weather has a hard time taking front stage this late in the growing season unless the weather is pretty extreme. Right now, I would call the changes in temperatures bearish but the lack of rains bullish, with neither of them extreme.
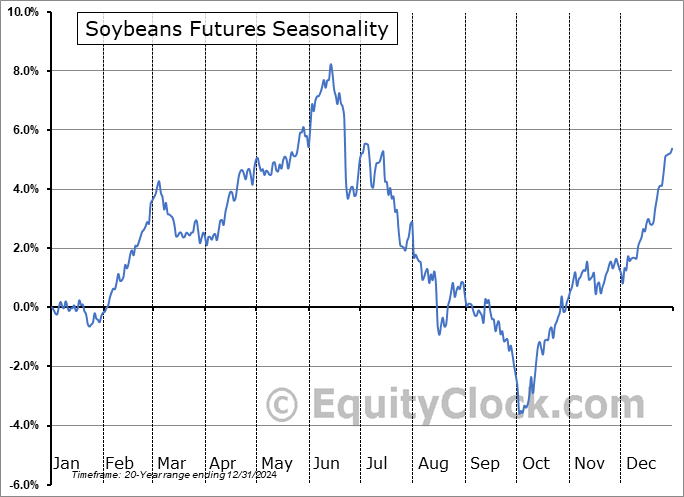
Great site for seasonals! The little upward seasonal in the 2nd half of August is most pronounced for beans compared to corn.
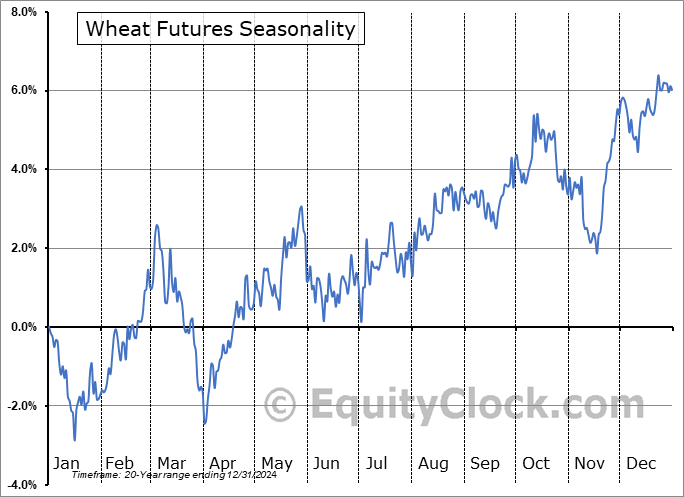
Wheat often bottoms early/mid harvest during June or the start of July, then has a very strong UP seasonal signal into October.
https://equityclock.com/seasonality/
https://equityclock.com/charts/
https://charts.equityclock.com/corn-futures-c-seasonal-chart
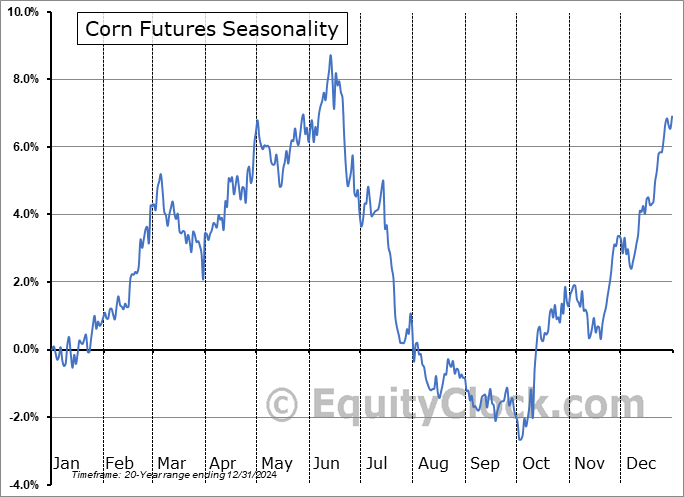
https://charts.equityclock.com/soybeans-futures-s-seasonal-chart
https://charts.equityclock.com/wheat-futures-w-seasonal-chart
Corn -1%
Beans unch
Cotton +2%
Amazingly, the models were even COOLER overnight which also made them drier.
The last 6z GEFS is in purple below! This is for CDDs in just the Midwest the next 2 weeks. These are the last 4 runs, at 6 hours apart.
On August 25th, 26th the HDDs are actually higher than the CDDS. Holy Cow! That's some chilly air requiring the furnaces to be on instead of the air conditioners!
The last model runs are showing the potential for a NEW PATTERN towards the end of week 2.
A new trough, somewhere from the West Coast, towards the Plains that pumps up an upper level ridge downstream, to the east and south.
This was the just out 12z Canadian Ensemble model(mean) for September 5th. This is a much wetter pattern than the next 10 days that will be dry. It will turn MUCH warmer after day 10 too. This will blow out/completely replace the northern stream and see heat building in the south, possibly points north of that.
https://weather.gc.ca/ensemble/charts_e.html?Hour=384&Day=0&RunTime=12&Type=gz
1. Week 2 (days 8-15) precip anomalies from this last 12z European Ensemble model.
2. Week 2 (days 9-16) precip anomalies from this last 12z GEFS Ensemble model.
3pm:
I see the NWS is picking up on this new pattern with a strong Pacific Jet stream taking over.
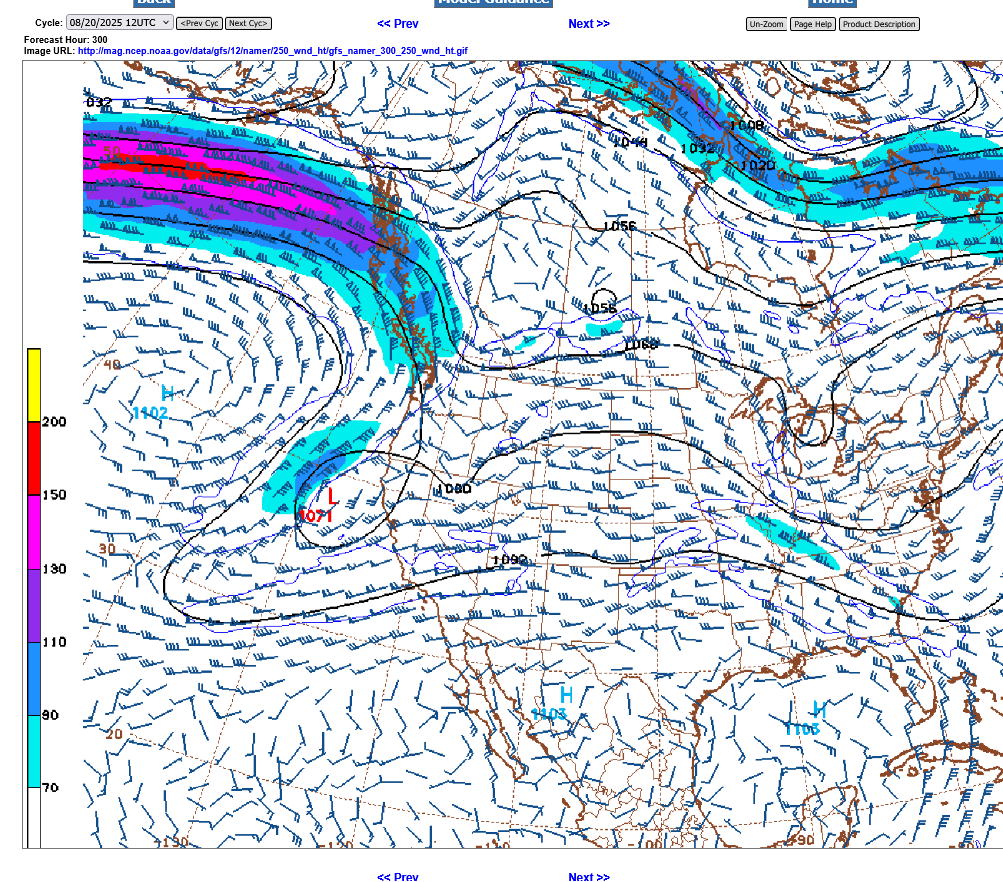
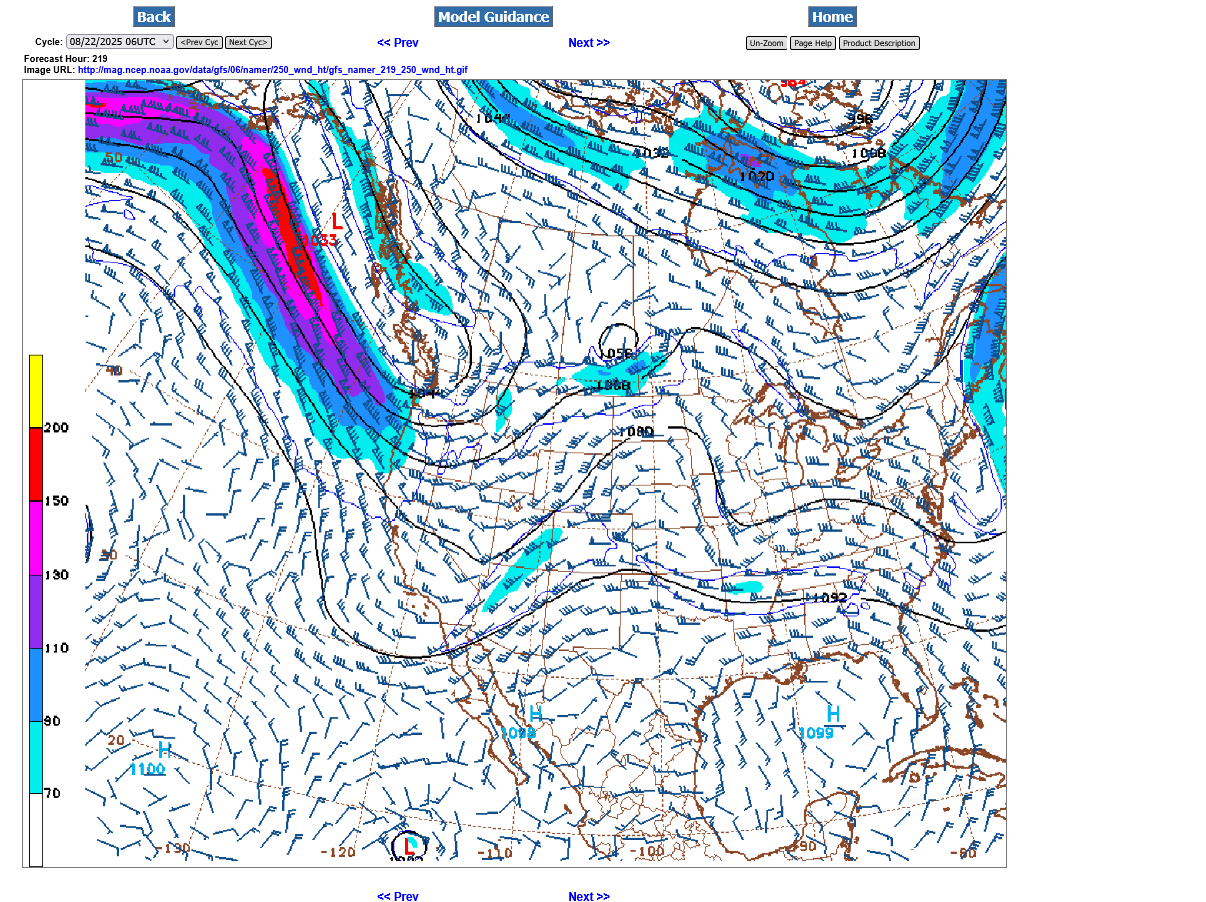
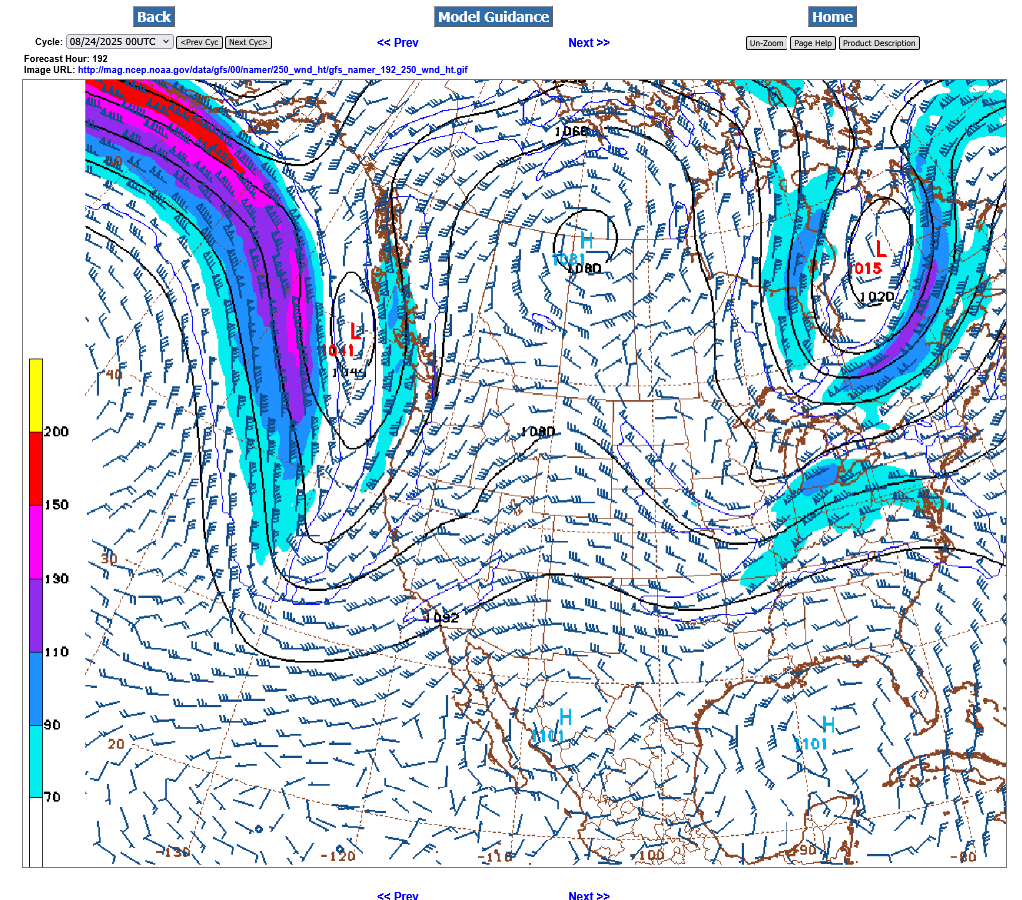
This is the 250 mb chart for September 2nd(around 34,000 feet up-300 hours from now). The jet max in the center/red is around 200 mph! This is from the last 12z GFS operational model.
It's coming for sure with powerful downstream impacts as it approaches even though the magnitude of the jet stream winds will weaken with the approach.
Pro Farmer tour August 2025
Started by metmike - Aug. 18, 2025, 4:39 p.m.
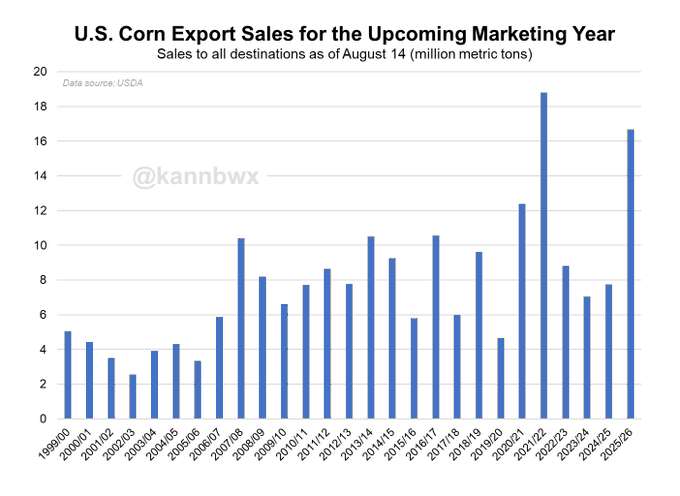
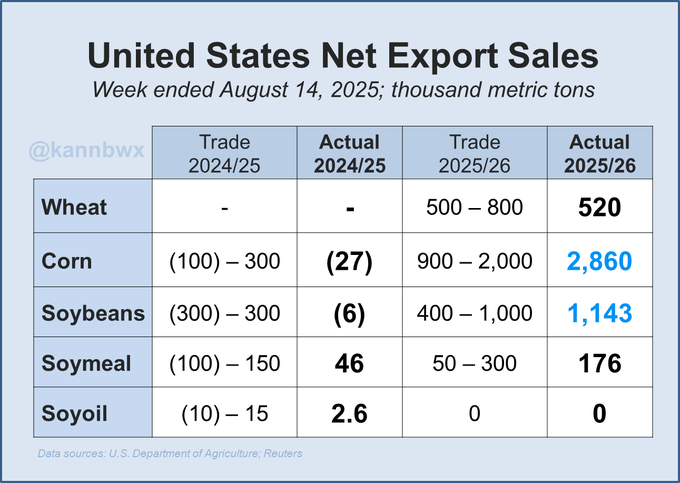
New-crop U.S. corn export sales continue to impress, landing well above all expectations last week. New-crop bean sales were also above all estimates for a second consecutive week - but still no China (that we know of).
New-crop corn export sales of 16.7 million metric tons (657 mln bu) are the second highest for mid-August in at least the last quarter century. That covers 23% of USDA's 2025/26 forecast, well above average for the date.
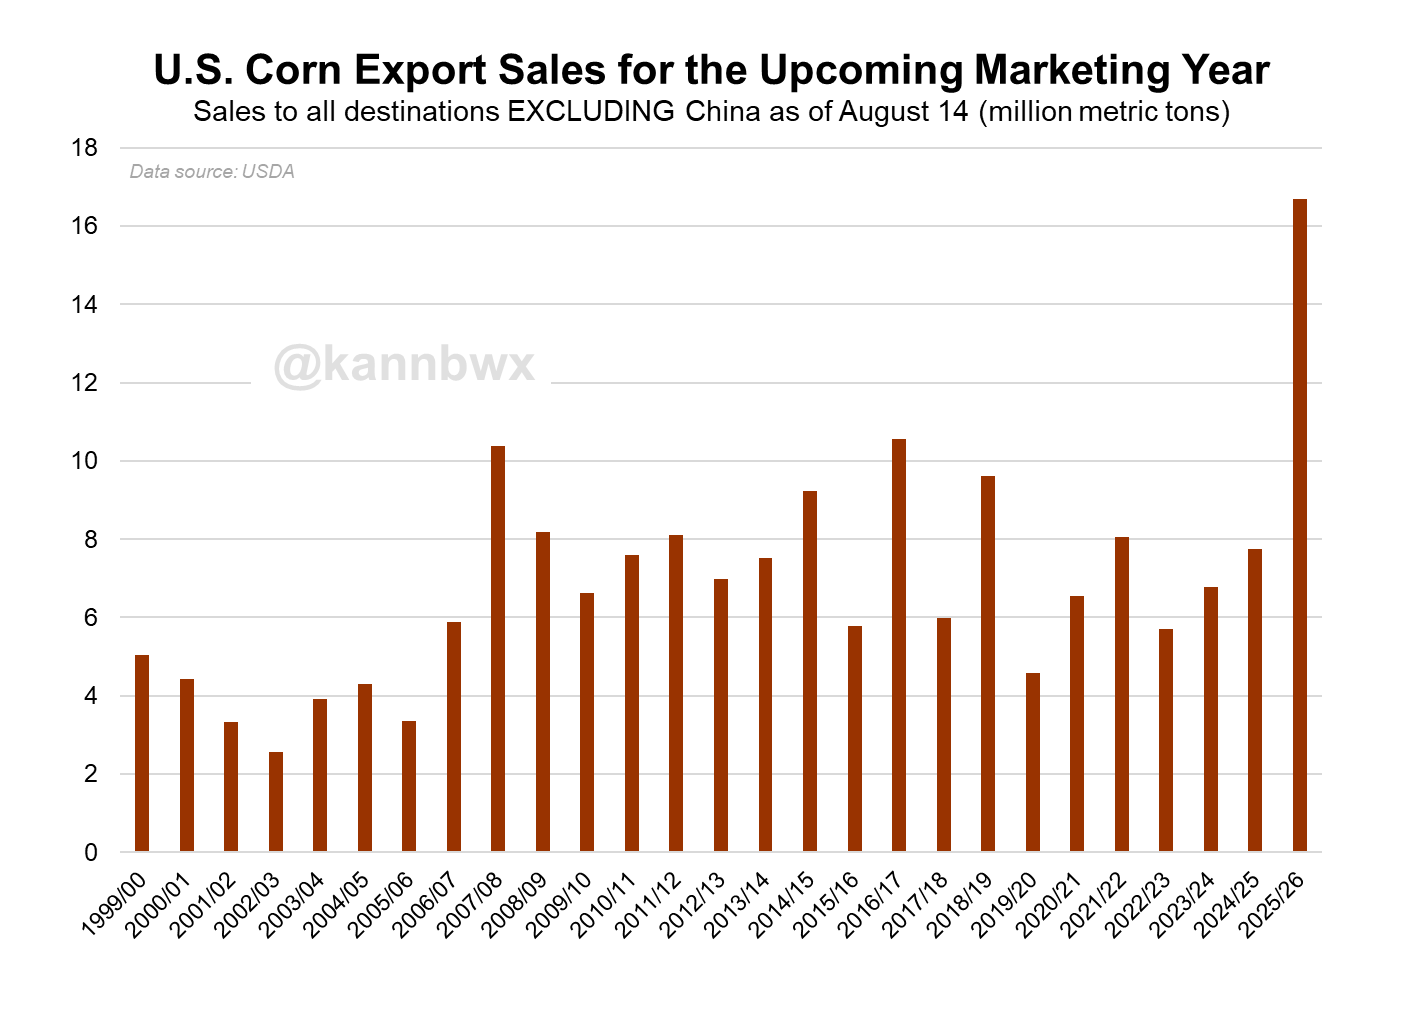
New-crop U.S. corn sales to all destinations other than China are an astounding 58% above the recent high for the date. Destinations include Mexico, Japan, South Korea, Colombia... all the usual suspects.
Imagine where exports would be if Predator Trump hadn't shut down exports to China with his insane tariffs schemes, especially beans!!!
Heavy rain zone setting up next week in the S/C Plains. Pretty dry in the Midwest the next week+. Very cool next week in the Midwest which will lessen the drying.
7 Day Total precipitation below:
http://www.wpc.ncep.noaa.govcdx /qpf/p168i.gif?1530796126
Week 2 precip anomalies from the last 0z European Ensemble model overnight.
Potential for more widespread rains spreading northeast from the area in week 1 based on a HUGE PATTERN CHANGE that will also warm things back up.
This is the day 9 jet stream at 250 mb form the just out 6z GFS operational model. That's a 200 mph jet streak (in red) aimed at the Northwest coast. It's uncertain how the exact pattern will shape up downstream in week 2 but with high confidence, IT WILL TURN MUCH WETTER for huge areas of the Plains and points eastward! Some of the rain could be excessive!
To learn much more about the upper levels, see these AWESOME discussions below:
Select a tutorial below or scroll down...
| HABY'S WEATHER FORECASTING HINTS |

| [--MAIN HOME--] [--HABY HINTS FACEBOOK PAGE--] |
·
Money managers in the week ended Aug. 19 cut their net short in CBOT corn fut&opt to a 12-week low of 145k contracts. That move was almost entirely due to new gross long positions, not short covering.
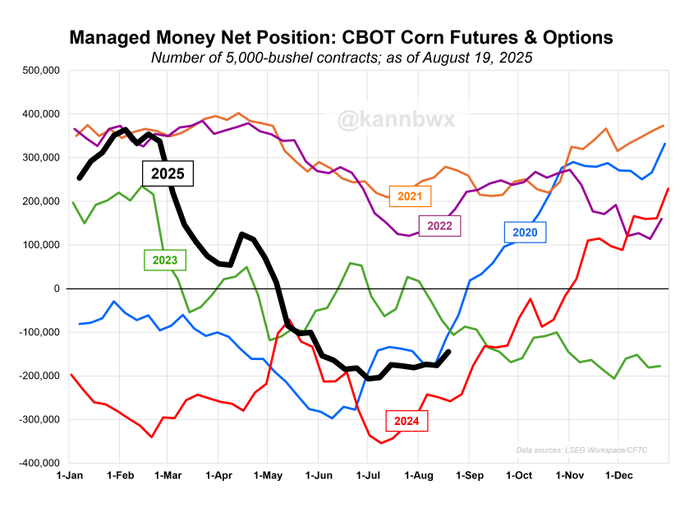
Different story in soybeans. Funds flipped to a net long of 3 fut&opt contracts (basically flat) in the week ended Aug. 19, their second consecutive week as heavier net buyers. Both of those moves were driven by short covering.
Eric's weather from Friday:
There is still the risk for flash drought in some places(in fact we're on the verge of that) but that has been greatly reduced by the extremely cool weather this week which will reduce drying rates.
Also, the potential return of rain in week 2.
However, after it warms up again in week 2/early September, if those rains don't materialize then there will be some places with flash drought.
https://www.marketforum.com/forum/topic/83844/#83853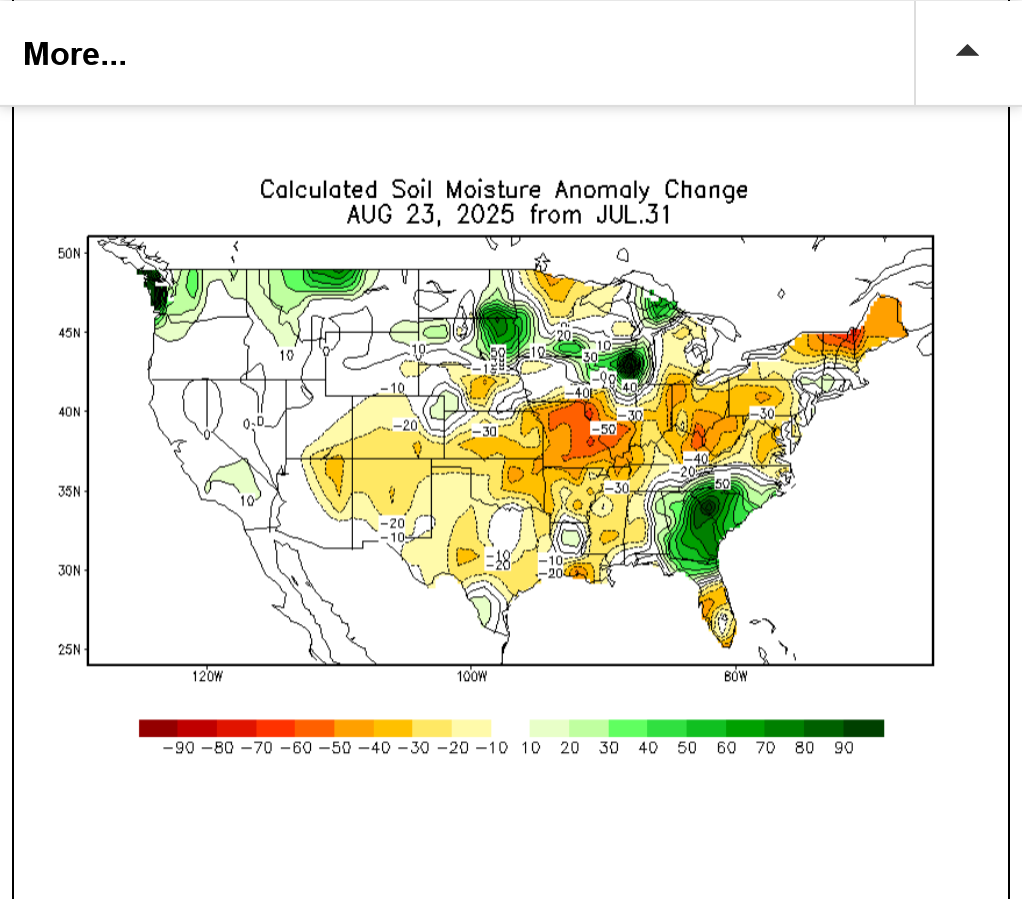
Heavy rain zone setting up this week in the S/C Plains. Pretty dry in the Midwest the next week+. Flash Drought!
7 Day Total precipitation below:
http://www.wpc.ncep.noaa.govcdx /qpf/p168i.gif?1530796126
This jet stream forecast for a week from now from the 0z GFS operational model shows the strong winds coming out of the Pacific which will define a new week 2 pattern. There is tremendous uncertainty of the downstream impacts in early September.
Will they blow out the unusually strong and UNDER forecast northern stream? Or will there continue to be cool surprises from the tenacious northern stream and upper level low in southeast Canada?
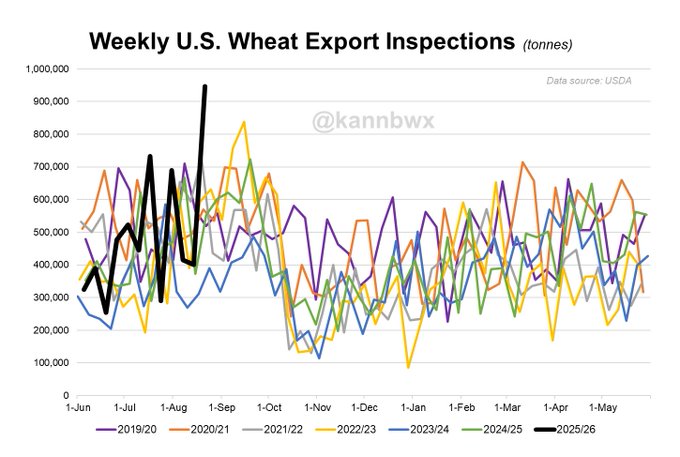
Strong U.S. corn export inspections continued last week, but those for wheat (if not a typo) were the largest in several years. Wheat inspections were heavy on Asian destinations. Soy exports capping off 2024/25 on a respectable note.
I always get suspicious of big outlier numbers, but this wheat number would be the largest for any week since Sept. 2013. Corn is finishing off 2024/25 on a very strong note and soybeans are looking reasonably good in the final days, as well.
US corn & soybeans are developing at a historically average pace, and the earliest planted fields have just begun reaching maturity. Spring wheat harvest has crossed halfway and winter wheat is basically done. Cotton crop is running slightly behind schedule.
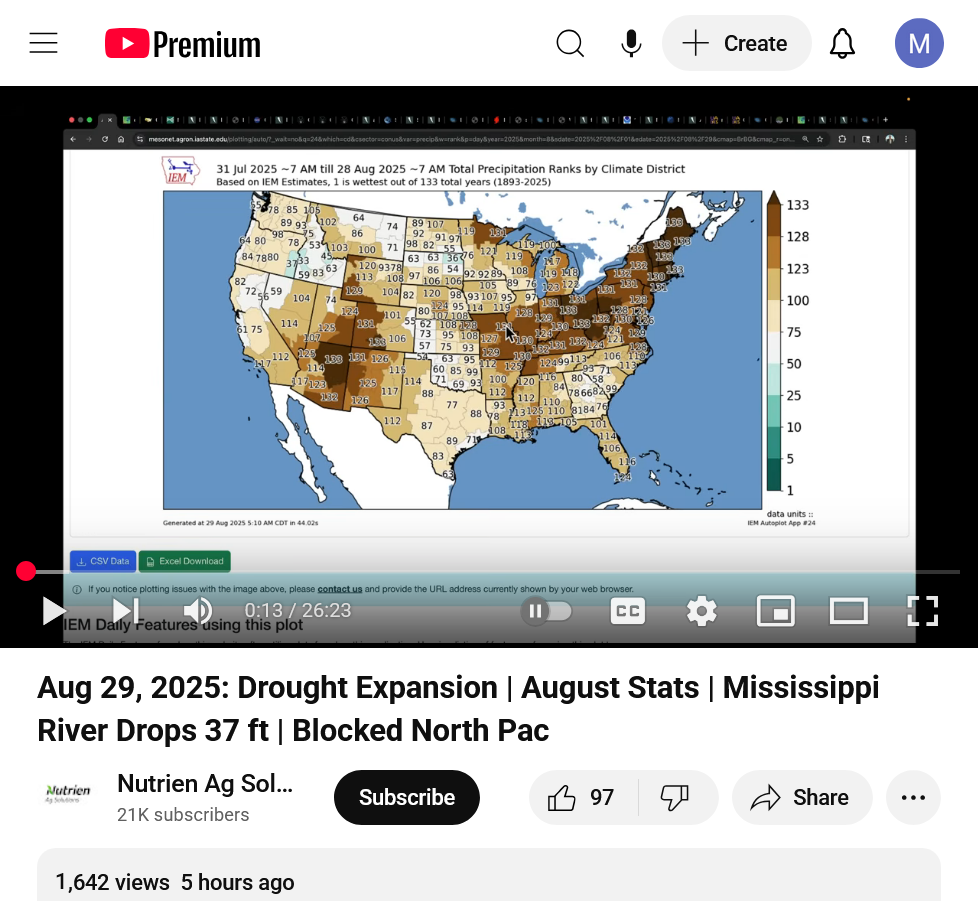
Matt was in with the weather today!
https://www.youtube.com/watch?v=YMKc9NW2QDk
This shows the flash drought being mentioned as a possibility here the past month.
Re: Re: Re: Re: Re: Weather May 2022
By metmike - April 30, 2022, 8:46 p.m.
Soilmoisture anomaly:
These maps sometimes take a day to catch up to incorporate the latest data(the bottom map is only updated once a week).
https://www.cpc.ncep.noaa.gov/products/Soilmst_Monitoring/US/Soilmst/Soilmst.shtml#
![]()


++++++++++++++++++++++++++++
Updated daily below:
https://mrcc.purdue.edu/cliwatch/watch.htm#curMonths
Support for all MRCC-hosted products and services is currently suspended as of April 17, 2025, due to a lapse in federal funding from the Department of Commerce through NOAA.

NEW LINK:
https://www.drought.gov/current-conditions
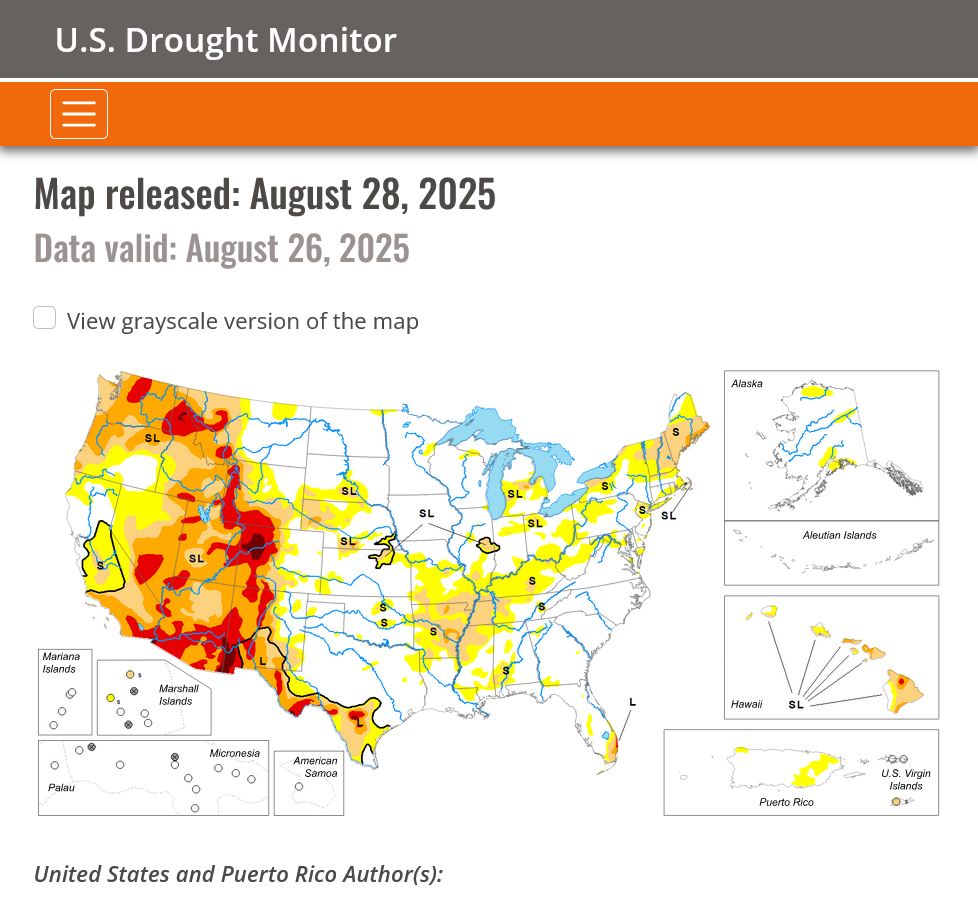
August 20, 2025 - August 26, 2025
https://droughtmonitor.unl.edu/
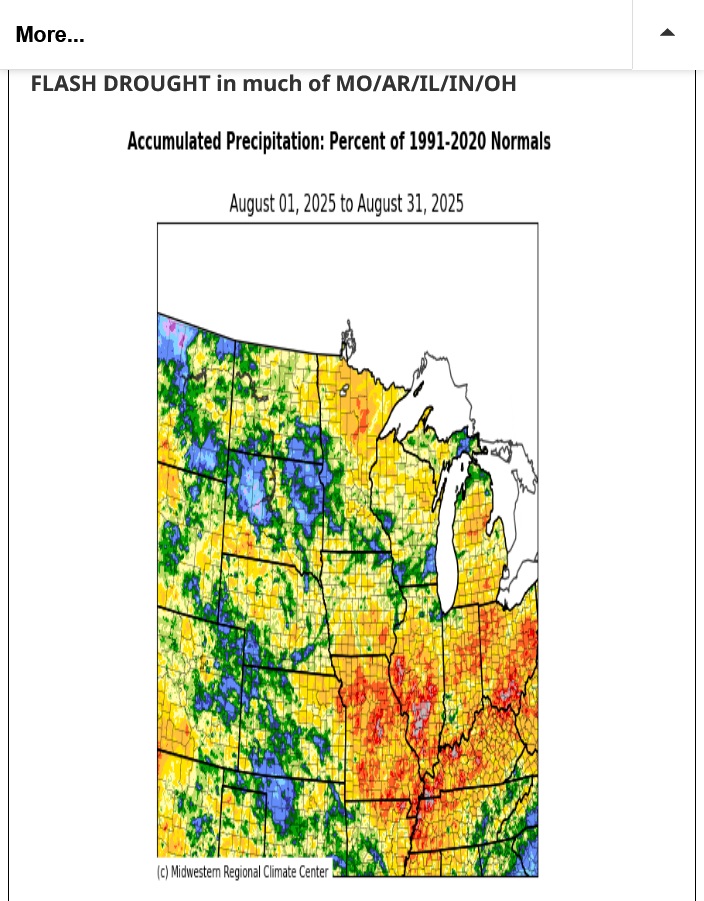
FLASH DROUGHT!!
Interestingly, the weather in the central and eastern Cornbelt this year is similar to the weather a year ago!!! Not much in the forecast for IL/IN the next week which would be nice for the end of pod filling on the beans.
7 Day Total precipitation below:
http://www.wpc.ncep.noaa.govcdx /qpf/p168i.gif?1530796126
++++++++++++++
With high confidence, not quite as positive as last year but close, I'm predicting LOWER corn and soybean yields from the USDA thru January 2026!!
FLASH BACK/FLASH DROUGHT......1 year ago/2024:
Dryness has spread in the central USA over the last eight weeks. Some 66% of the Midwest (the most since mid-March) is now abnormally dry versus 13% in mid-July.
USDA January 10, 2025/grains
Started by metmike - Jan. 10, 2025, 11:38 a.m.
https://www.marketforum.com/forum/topic/109451/#109481
By metmike - Jan. 10, 2025, noon
EXTREMELY BULLISH!!!!!!!!
++++++++++++++++++++++++++
By metmike - Jan. 10, 2025, 12:45 p.m.
+++++++++++++++++
Here's the discussion last August/September while that flash drought in 2024 was happening AND LOWERING YIELDS. cutworm was right on it too!
Beans
62 responses |
Started by baker - Aug. 8, 2024, 7:36 p.m.
https://www.marketforum.com/forum/topic/106521/
+++++++++++++++++++++++
By cutworm - Sept. 13, 2024, 7:22 a.m.
The drought here in the last 1/2 of August and September has come as beans were filling out. I expect that yield prospects here have declined 5,6,7 bushels here from what we were looking at in late July.
JMHO

The NWS has been a couple weeks slow in their forecast on this:
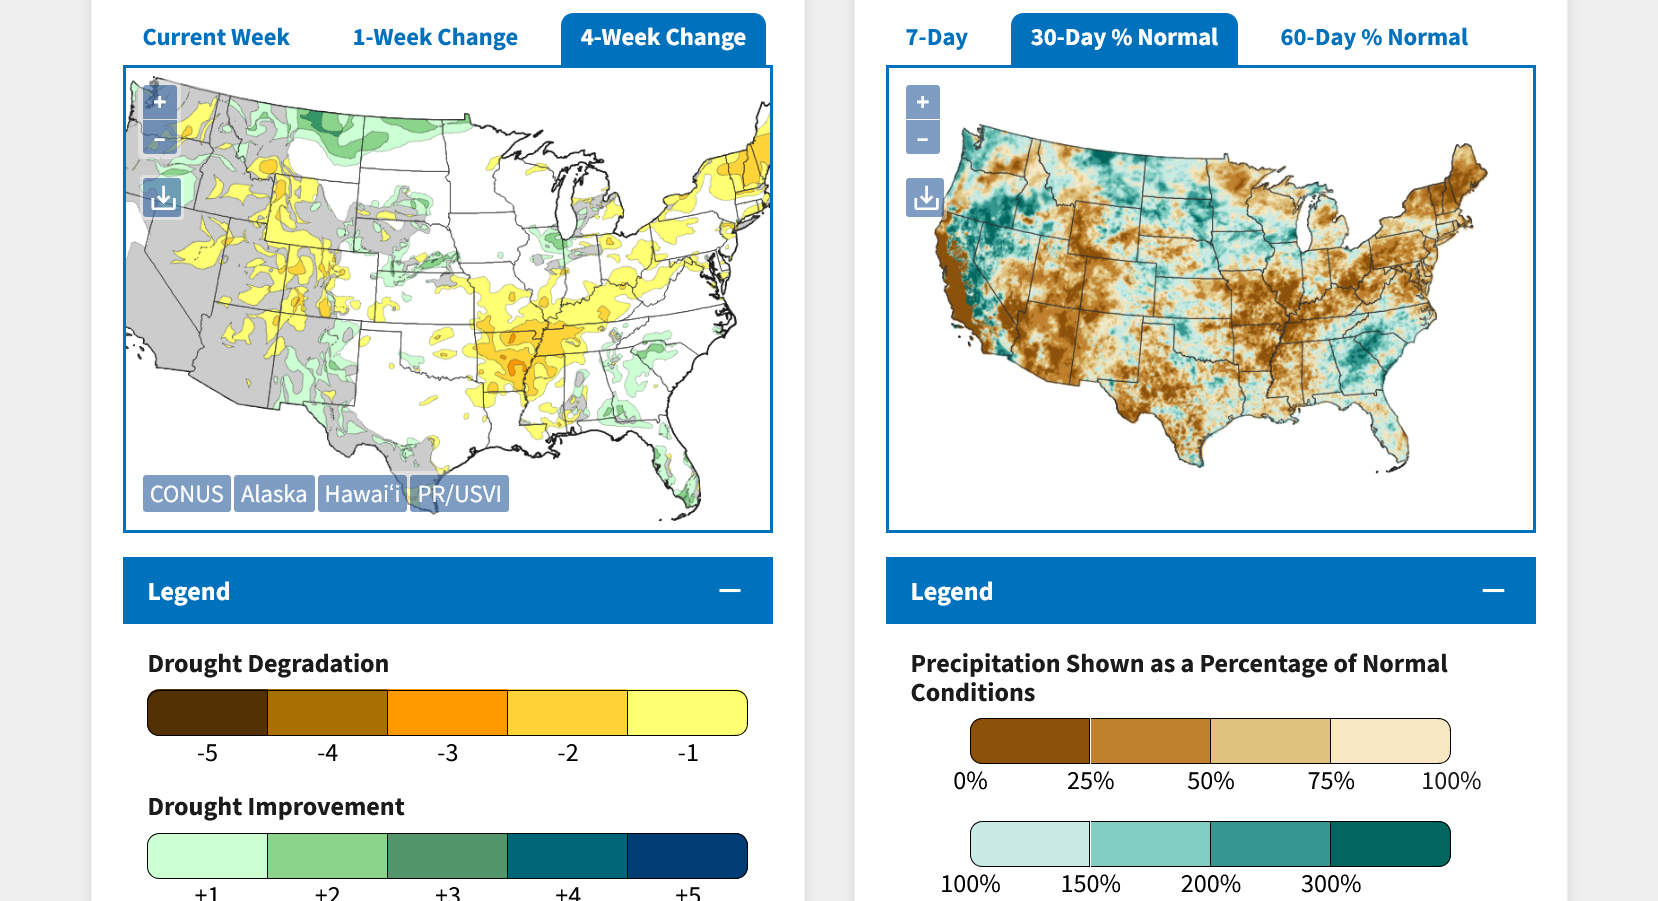
https://www.cpc.ncep.noaa.gov/products/expert_assessment/month_drought.png
Another major shot of cool air this week but not much major relief from the flash drought for the next 2 weeks with temps warming back to above average in week 2.
There's a chance that we could get lucky in the middle of this week if that system amplifies/develops farther west.
7 Day Total precipitation below:
http://www.wpc.ncep.noaa.govcdx /qpf/p168i.gif?1530796126
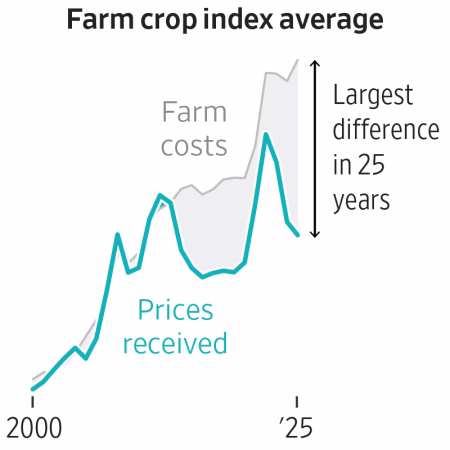
Farmers are expected to harvest one of the largest crops in history in the coming weeks, according to the U.S. Department of Agriculture. The harvest follows several years of bumper crops for farmers, fueling a glut that is driving down commodity prices. Weaker prices are crimping profits and farmers’ ability to stay afloat.
Technological advancements from the world’s largest seed and pesticide companies are expected to increase harvests in the coming years.
1. We keep hearing/reading about how climate change is causing adverse weather for agriculture and its going to keep getting worse.........even as it keeps getting better and better. CO2 is a beneficial gas and free atmospheric fertilizer on top of this being a climate OPTIMUM for life on earth, with PLANT LIFE, including crops benefiting the most.
https://www.marketforum.com/forum/topic/69258/
2. Trump's tariffs couldn't have come at a worse time. Soybeans are at least $1 cheaper because China, our #1 buyer has been buying ALL their beans from South America. Costs are going higher from inflation, which has also gotten worse because of Trumps tariffs.
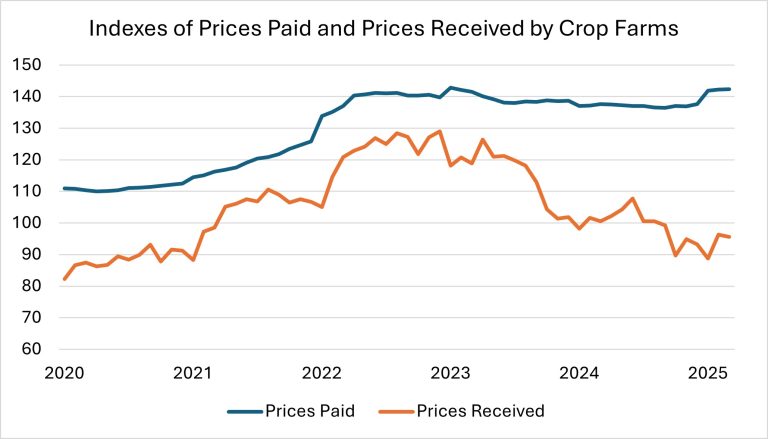
Trade policies and sanctions are playing an increasingly significant role in reshaping global fertilizer markets.
After returning to pre-pandemic levels, fertilizer affordability has deteriorated. A recent surge in fertilizer prices—coupled with declining agricultural commodity prices—has made fertilizers less affordable for farmers. For instance, the affordability index for DAP (diammonium phosphate) has surpassed its early 2022 peak, while the indexes for urea and MOP (muriate of potash, or potassium chloride) have reversed their downward trends since the end of 2024.
+++++++++++++++++++++++==
https://www.worldstopexports.com/top-fertilizers-exports-by-country/
Below are the 30 countries that exported the highest dollar value worth of fertilizers during 2024.
+++++++++++++++++
https://uswheat.org/wheatletter/u-s-farmers-pinched-by-high-costs-and-low-prices/
+++++++++++++++
https://blogs.ifas.ufl.edu/nfrecsv/2025/05/14/farm-input-costs-rise-and-commodity-crop-prices-fall/
+++++++++++++++++++++++
The latest round of tariffs is likely to make agricultural production even more expensive and, potentially, limit access to goods not produced in the United States.
https://www.nytimes.com/2025/08/01/business/economy/tariffs-agriculture-costs-farmers-consumers.html
·U.S. corn & soybeans are starting to reach maturity, just a hair faster than the recent average but not as quickly as last year. Spring wheat harvest is nearly three-fourths complete.
Beans were -4% quite a bit lower than expected. Likely from the FLASH DROUGHT! This is hurting pod fill!
Corn was -2% and the trade expected that. At this time of year, as corn gets so close to maturity its hard to tell what the condition change is compared to the previous week since the green is being replaced by brown. Even with bean, last year they still looked great in many places during the flash drought but they had TINY seeds inside the pods.
I actually spot checked a bunch of bean fields last year around here, in Southwest IN, in early September and the seeds were tiny at a time when they should have been getting pretty plump.
The most incredible part about that story is the USDA didn't acknowledge the yields being hurt in August/September that some of us (cutworm) could see happening in front of us and were posting about in August/September UNTIL THE JANUARY CROP REPORT!!!!
It didn't take a rocket scientist, atmospheric scientist, professional trader or life long producer to know the last 30+ days during the growing season in 2024 with very little rain would HURT yields.
They should have known 90% of that by November! Anyway, here is 2025 we're having the same thing happen but with several stretches of near record cool temps that reduced drying rates and after the soil moisture profiles had been completely recharged. So maybe the losses won't be as huge. Also, the Upper Midwest got some great rains in August and so did the Plains, so this is limited to MO/AR and points eastward/northeastwar in 2025.
Regardless, there is a near 0 chance that the final 2025 crop yields will be what the USDA stated last month.
Monster wheat inspections for the 2nd week in a row!
·
Last week's US corn and soybean export inspections came in near the top end of expectations, and wheat exceeded them for a second consecutive week. Last week's wheat number (1.02 mmt) was the best since September 2013.
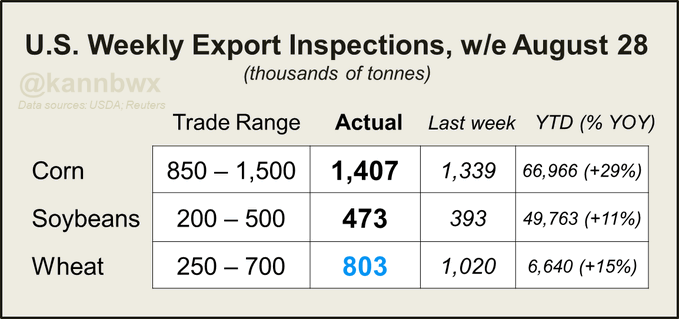
Do I understand correctly that we shipped 11% more beans than the previous year????
Cutworm,
that might be right, even without China!
I think that if China was buying our beans it might be a record year!
The other thing is that SA is going to run out of Beans because of this and I think they could end up needing to buy our beans at $1 cheaper, then sell them for $1 more to China.
This is speculative from me so I need to check more on the dynamics and tariffs To make sure the tariffs aren’t also sabotaging this too.
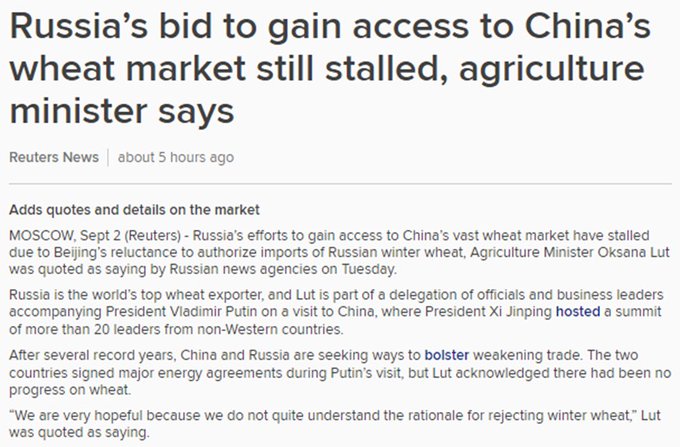
Russia is trying to strengthen trade ties with China, reportedly having boosted ag exports to China by 10% this year. But in a confusing twist for the Russians, China hasn't authorized the top exporter to ship its winter wheat, limiting Russia's access to Chinese markets.
Some good discussions about the grain market
US Corn and Soybean Overproduction: Why Farmers are Struggling - YouTube
Thanks, cutworm!
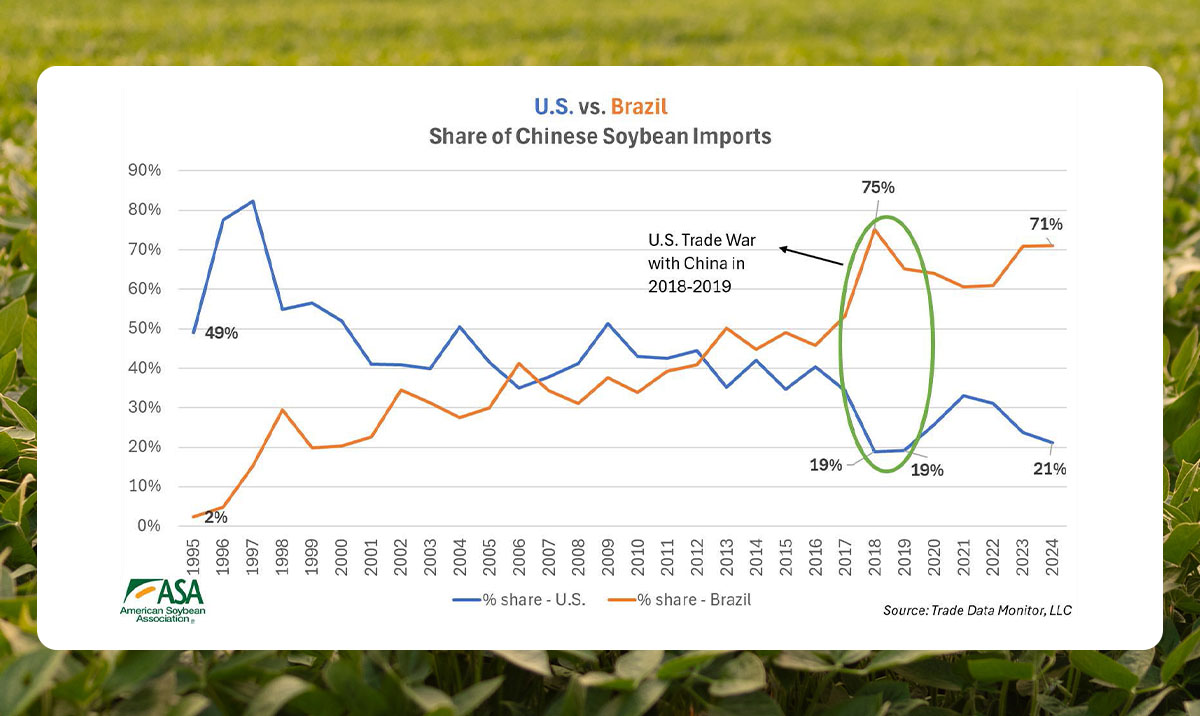
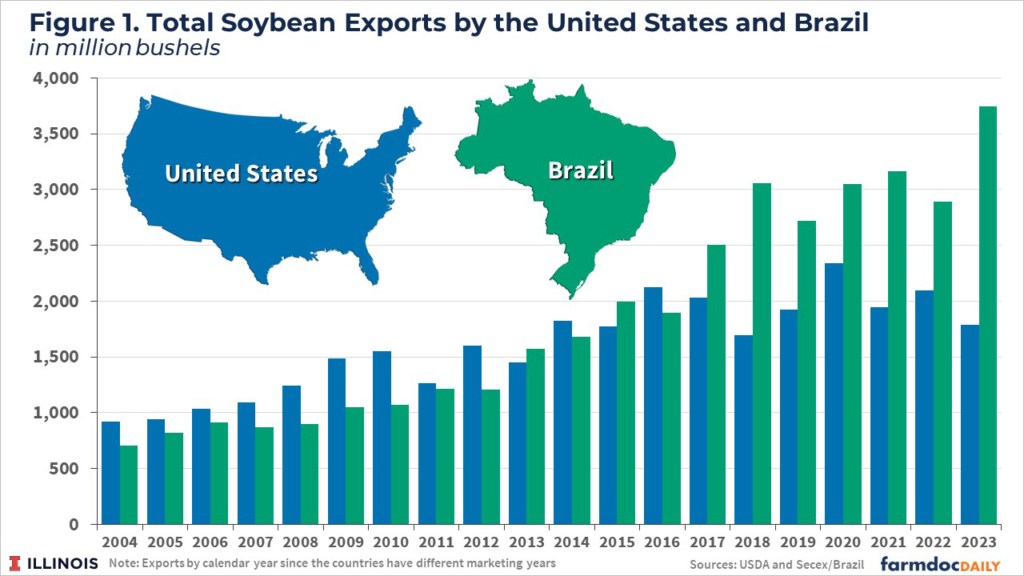
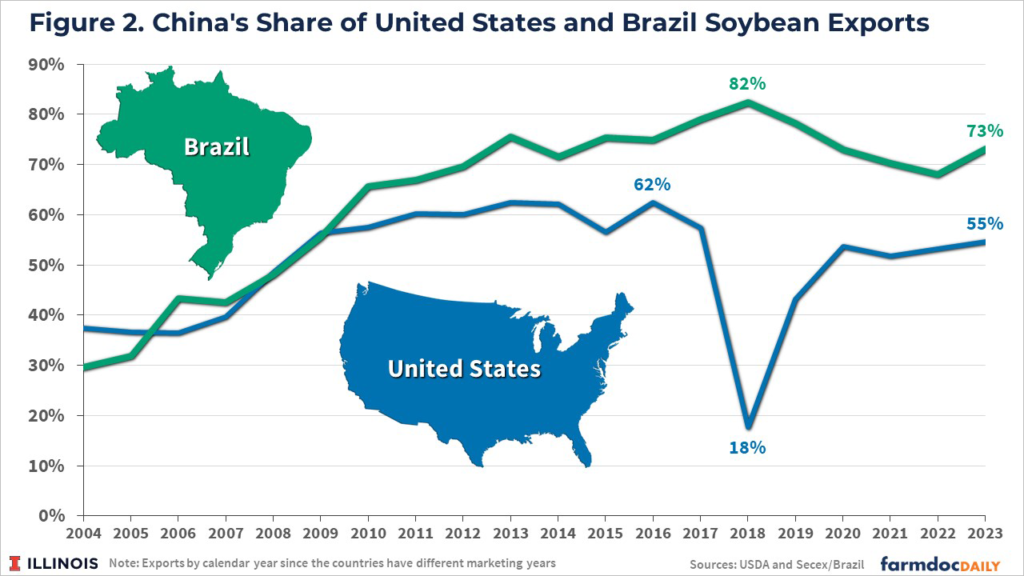
Graphs/charts are wonderful at telling us profound things.
This one is very revealing about how tariffs can cause long term/permanent damage. When Trump imposed tariffs and had a trade war with China in his first term, it caused China to turn to Brazil to get their soybeans. Those lost sales and lost income for US farmers was lost forever.
They never came all the way back after they made those long term relationships to satisfy their entire needs.
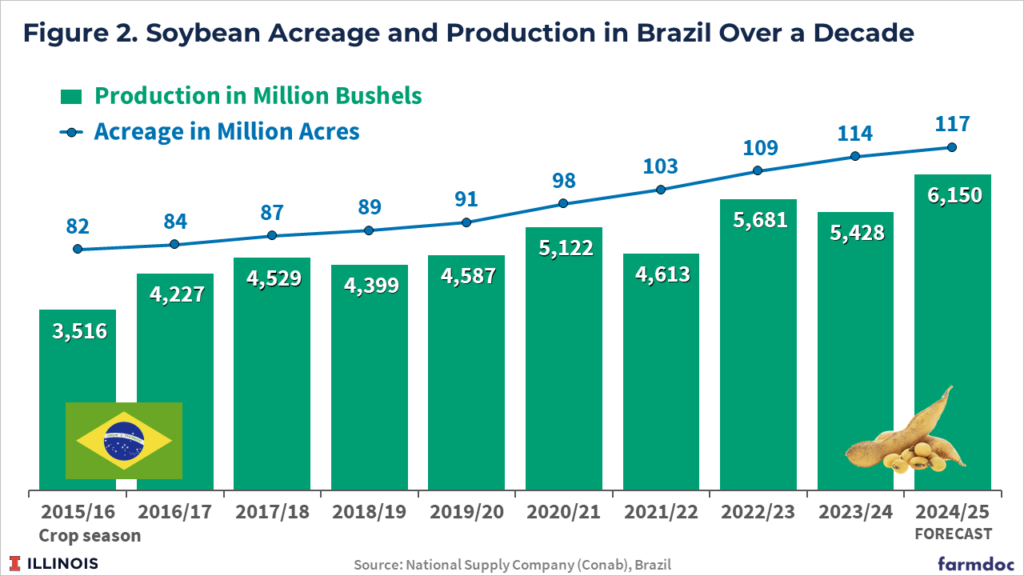
25 years ago, we would have had them over a barrel because Brazil didn't produce nearly the amount to replace us. Now, Brazil OUT PRODUCES the United States.
We can't change that or make the rules bend to our will. It's a global economy and other countries are catching up to us and we have to respect them and maintain free trade with them because it DOES benefit us as well as them.
++++++++++++++
https://www.fas.usda.gov/data/production/commodity/2222000
| Market | % of Global Production | Total Production (2024/2025, Metric Tons) |
|---|---|---|
| Brazil | 40% | 169 Million |
| United States | 28% | 118.84 Million |
| Argentina | 12% | 50.9 Million |
| China | 5% | 20.65 Million |
| India | 3% | 12.58 Million |
| Paraguay | 2% | 10.2 Million |
| Canada | 2% | 7.57 Million |
| Russia | 2% | 7.05 Million |
| Ukraine | 2% | 7 Million |
| Uruguay | 0.99% | 4.2 Million |
.55 worth of rain here a short while ago. We were one,of the more fortunate ones.
Yippee! The most since July!
Hopefully, a bit more before this weather system moves past us over the weekend because the 2 weeks after that look like back to dryI
22/100 here soaked into the top1 inch of the soil, not getting to the root zone. Below that dry. Way to late to help the deteriorating condition of beans in my area.
Thanks, cutworm.
Sorry you didn't get more than that. I was thinking that farther east, you are the better the rains should be. We just got dang lucky here in this county. I'll try to put together a rain report later since this came after such a LOOOONG dry period.
I act like an idiot when it hasn't rained for weeks and its raining outside.
1. It's more fun tracking a rain event like this than anything. OK, snow storms are up there too.
2. While it's raining, I will run out to the rain gauge, in the pouring rain numerous times, getting pretty wet when its really coming down but I can't wait for it to end. I'll make guesses on how much I think the rain gauge will show each time before going out there
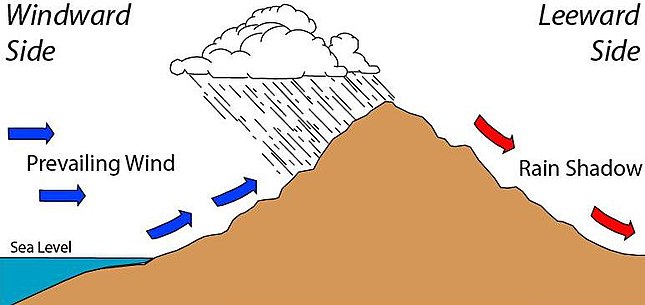
3. I have a rain gauge in front of our porch in the front yard and 1 in the backyard, around 15 feet away from the back door. You would think the measurements would be the same but the one in the front always measures more rain. ALWAYS! I have a couple of theories. The one in the back is on the east side of the house, with most of our rains coming in with a west to east component so the house may be producing a "rain shadow" effect. This happens on the lee side of mountains for an entirely different reason. In our case, I think that it’s more of an "umbrella shadow" effect. The one in the front doesn't have as much blocking, even though there are some trees that are close enough to theoretically do that.
It might be an artifact from the actual rain gauges, so I'll switch them for the next event to see if that matters.
cutworm,
You also make a great point about the piddly rain you got not making it into the root zone where the plants can actually use it. At best, it just stopped the additional drying. I think too, the plants could be shutting down early which reduces the time for pod filling and reduces the time for kernel filling for corn.
I pass some very late planted corn fields several times each week. They still have several weeks of kernel filling left........or they should have had. They are going from green, to drying up and dying instead of brown.
+++++
Forgot to mention that we got another .21 early this morning. Total of .76:and another decent chance LATE FRIDAY and very early Saturday. This is what I was hoping for because of the powerful dynamics with this system(more like cold season dynamics) even though moisture for it to work with isn’t the greatest.
I showed them in the natural gas thread yesterday and will copy that here, when back on the computer.
+++++++++++++
https://en.wikipedia.org/wiki/Rain_shadow
 ++++++++++++++=
I speculate that the leeward side of our house, consistently has less rain in that rain gauge for a complete different principle. Some of the rain bearing air parcels are BLOCKED from wind that goes AROUND the house(over the top) then passes OVER the rain gauge.
Cutworm,
Im worried this next rain event is going to come together on top of us and then track southeast with rains that we barely miss. Going to be a close call.
Some of the corn is drying up before it matures (black layers). This is similar to frost damage. in that it will have low test weight, it(the kernels) will not dry. How much is affected is very hard to tell till the combine starts running. You can't see this by looking form the road, need to pull some ears. I have checked some spots and found some of this. Again Very hard to tell the extent. I'm thinking a few(1-3) %.
Thanks very much, cutworm!
You would know better than anyone, including me so your opinion is especially appreciated!
Eric seems to echo your forecast for no rain for my part of Indiana. No rain for a large part of the growing area in In. ILL. Ohio Mo. About 40% of the bean crop in drought and no rain in the foreseeable future.
These were the weather map forecast from 2 days ago that I posted on the NG thread. WOW for early September!
HUGE weather pattern change for next week that turns up the heat but does not bring any rain to Indiana!
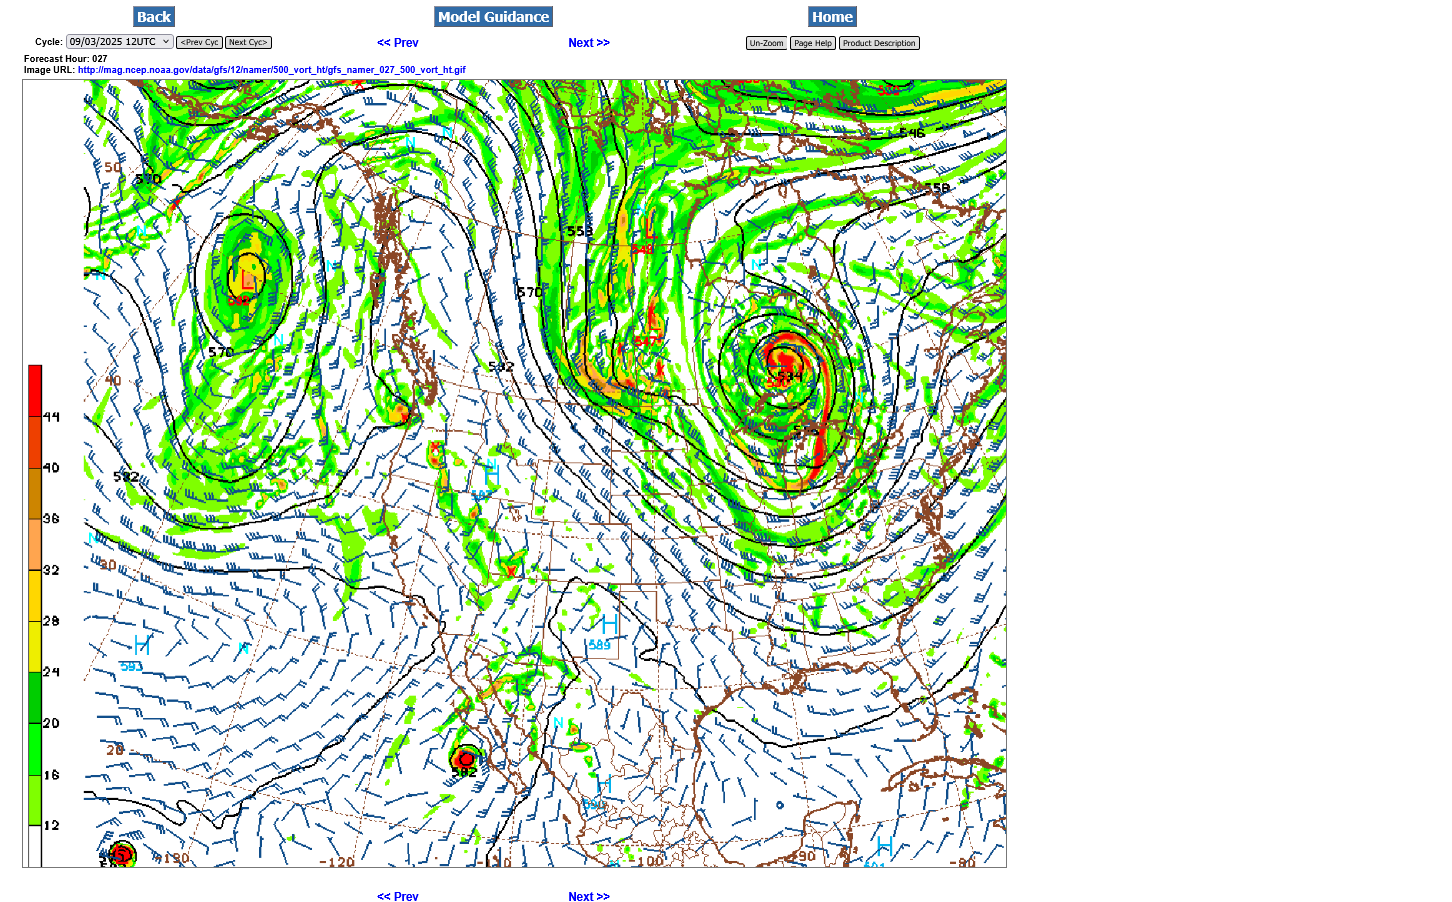
By metmike - Sept. 3, 2025, 3:48 p.m.
The map below is from the last 12z GFS operational model at 500 mb (18,00 feet) for Thursday morning. That deep low just north of Lake Superior is a huge piece of THE POLAR VORTEX!
We can see a huge kink in the lines, along the ND border with Canada from a strong perturbation/reinforcing wave with the colors representing powerful, positive vorticity(spin) associated with it. It's a strong reinforcement of this very chilly air that is rotating around the backside of the main/parent Low just north of Lake Superior.
This is more like a Winter pattern.
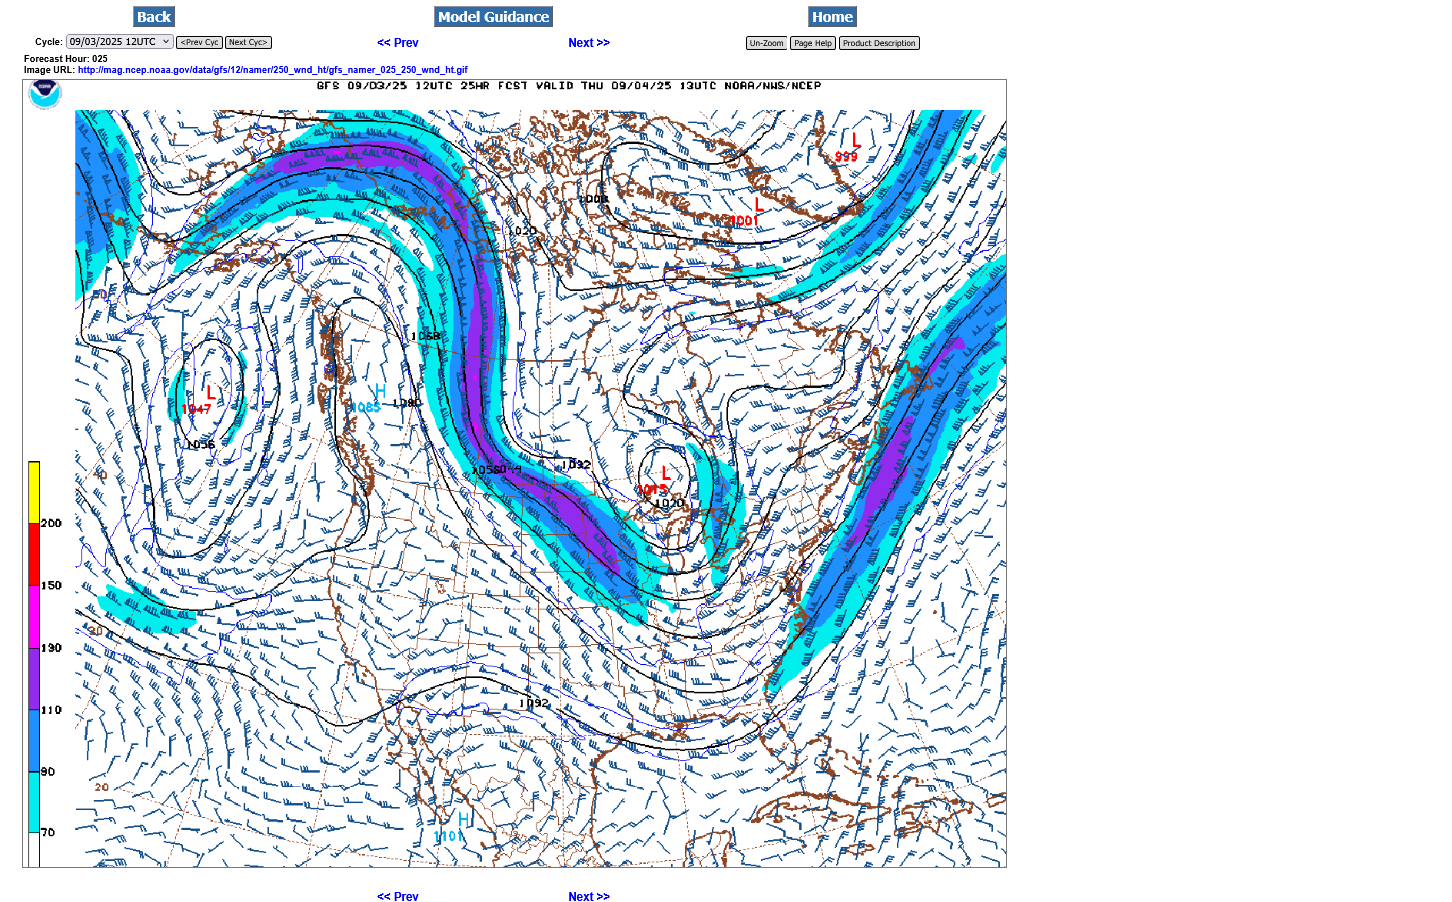
Here's the 250 jet stream(33,000 feet). Note it diving straight south/southeast, transporting air from much higher latitudes/the Arctic to the mid latitudes. The small pink color embedded within the jet stream represents a 150 mph jet streak!!
The piece of polar vortex at this level is also seen just north of Lake Superior.
A jet stream like this in 3+ months means brutally cold temps and a major Winter storm east of the trough line and/or associated with the lift from the jet stream dynamics. We can make out that kink in the isoheights that is northwest of the 500mb level, now much higher up, around the Alberta/ Saskatchewan border in Canada!
++++++++++++
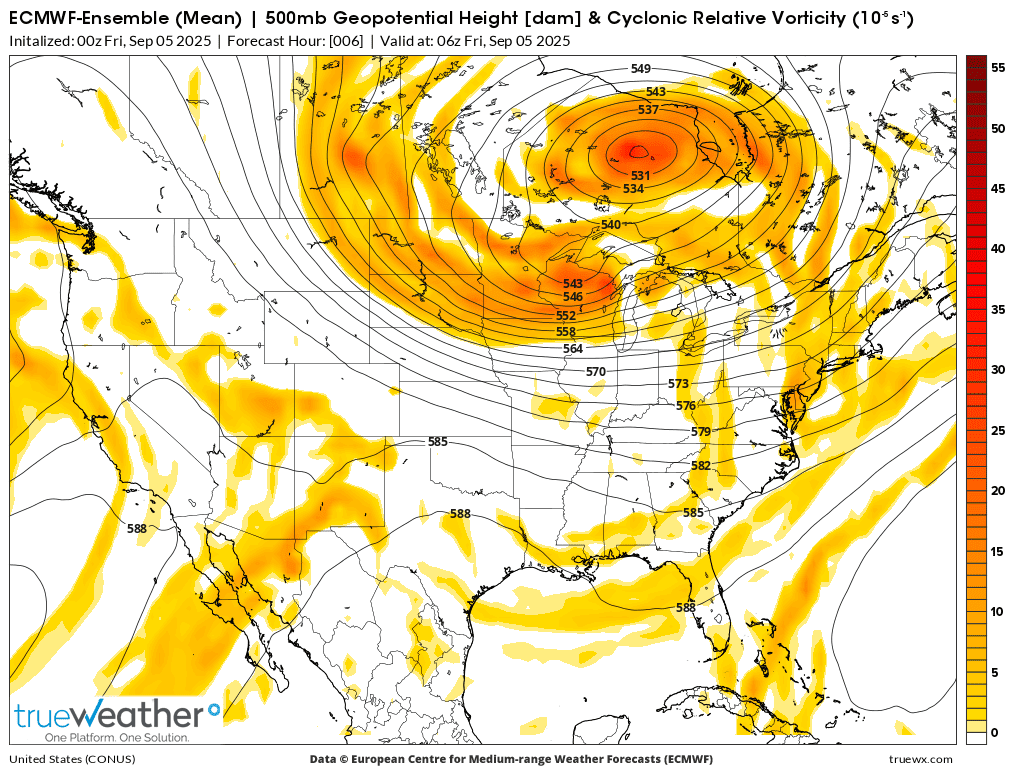
Here's the European Ensemble model at 500 mb.
1. Vorticity/spin. Spokes of vorticity rotating around the backside of the DEEP Low(north of Lake Superior) are a reinforcement of this near record ARCTIC cold.
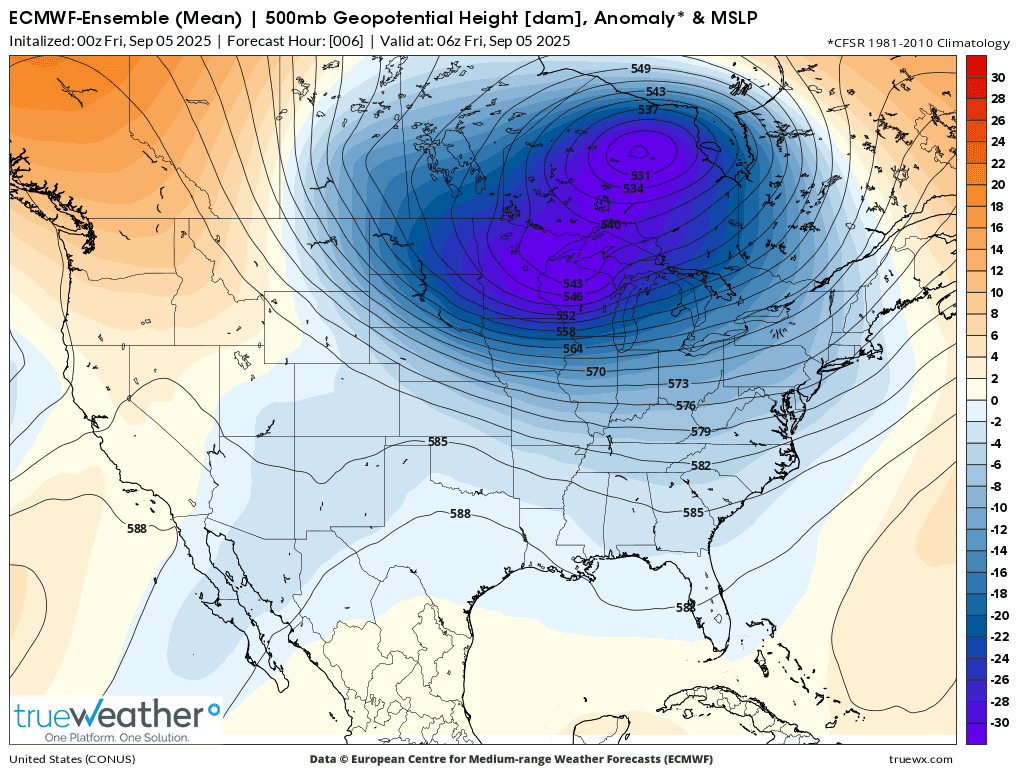
2. Departure from average for September 5th. This is a COLD SEASON pattern with the polar vortex displaced extremely far south!
3. 11 days later. The same map. WOW!!!
+++++++++++++++++++++++++++
3. GEFS 850 temperature departures. A huge chunk/blob of Arctic air has been displaced/transported far southward!
4. Same map. Forecast for 10 days.
Day 11, 500 mb forecast from the same model above: Massive upper level High pressure ridge replacing the massive upper level/deep Low.
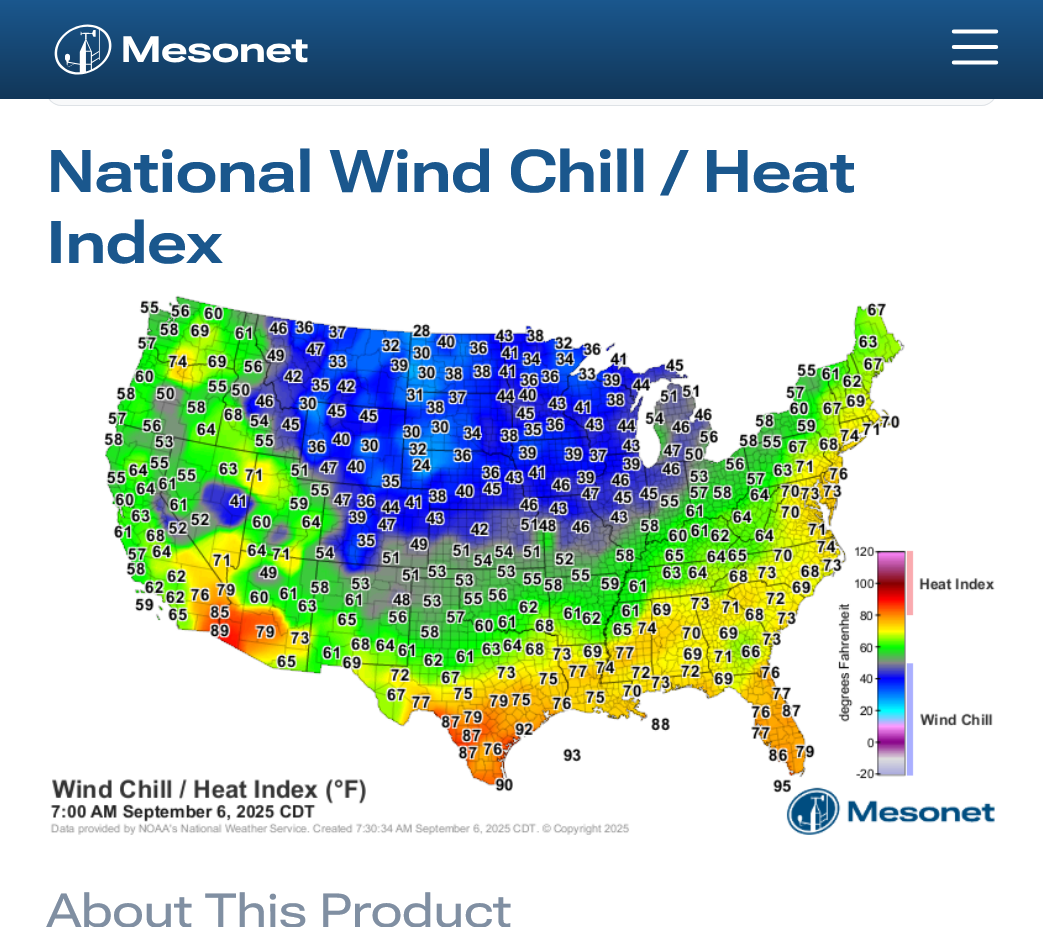
Current temp anomalies GEFS
Day 10 temp anomalies below GEFS-complete opposite of the current temps above
I added the last map to the graphics on the previous page to show the profound flip, from one extreme to the complete opposite extreme occurring over the next week!
Here's the European Ensemble model at 500 mb.
1. Vorticity/spin. Spokes of vorticity rotating around the backside of the DEEP Low(north of Lake Superior) are a reinforcement of this near record ARCTIC cold.
2. Departure from average for September 5th. This is a COLD SEASON pattern with the polar vortex displaced extremely far south!
3. 11 days later. The same map. WOW!!!


Day 11, 500 mb forecast from the same model above: Massive upper level High pressure ridge replacing the massive upper level/deep Low.

++++++++++++++
Temps got cold enough for frost and a light freeze for many places in the Upper Midwest/N.Plains this Saturday morning.
That ended the growing season early for the beans that were a couple of weeks from maturity, especially in the northern high plains! The market is more likely focused on the soon to be rapid pace of harvest and typical harvest pressure on prices as this cold was not a surprise.
And the yield losses suffered in these fringe areas is coming off of a near record crop(that is losing MORE yield from the flash drought in the southeast belt.
https://www.nass.usda.gov/Charts_and_Maps/Crops_County/sb-pr.php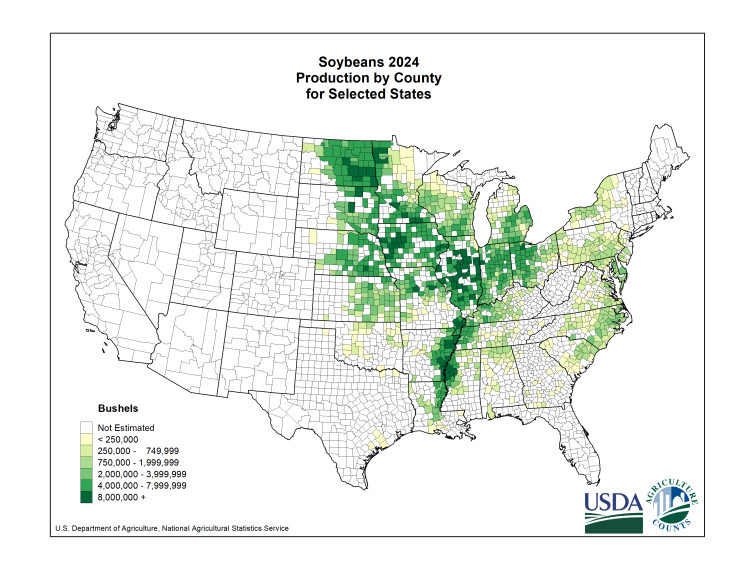
https://ipad.fas.usda.gov/countrysummary/images/US/cropprod/USA_Soybean.png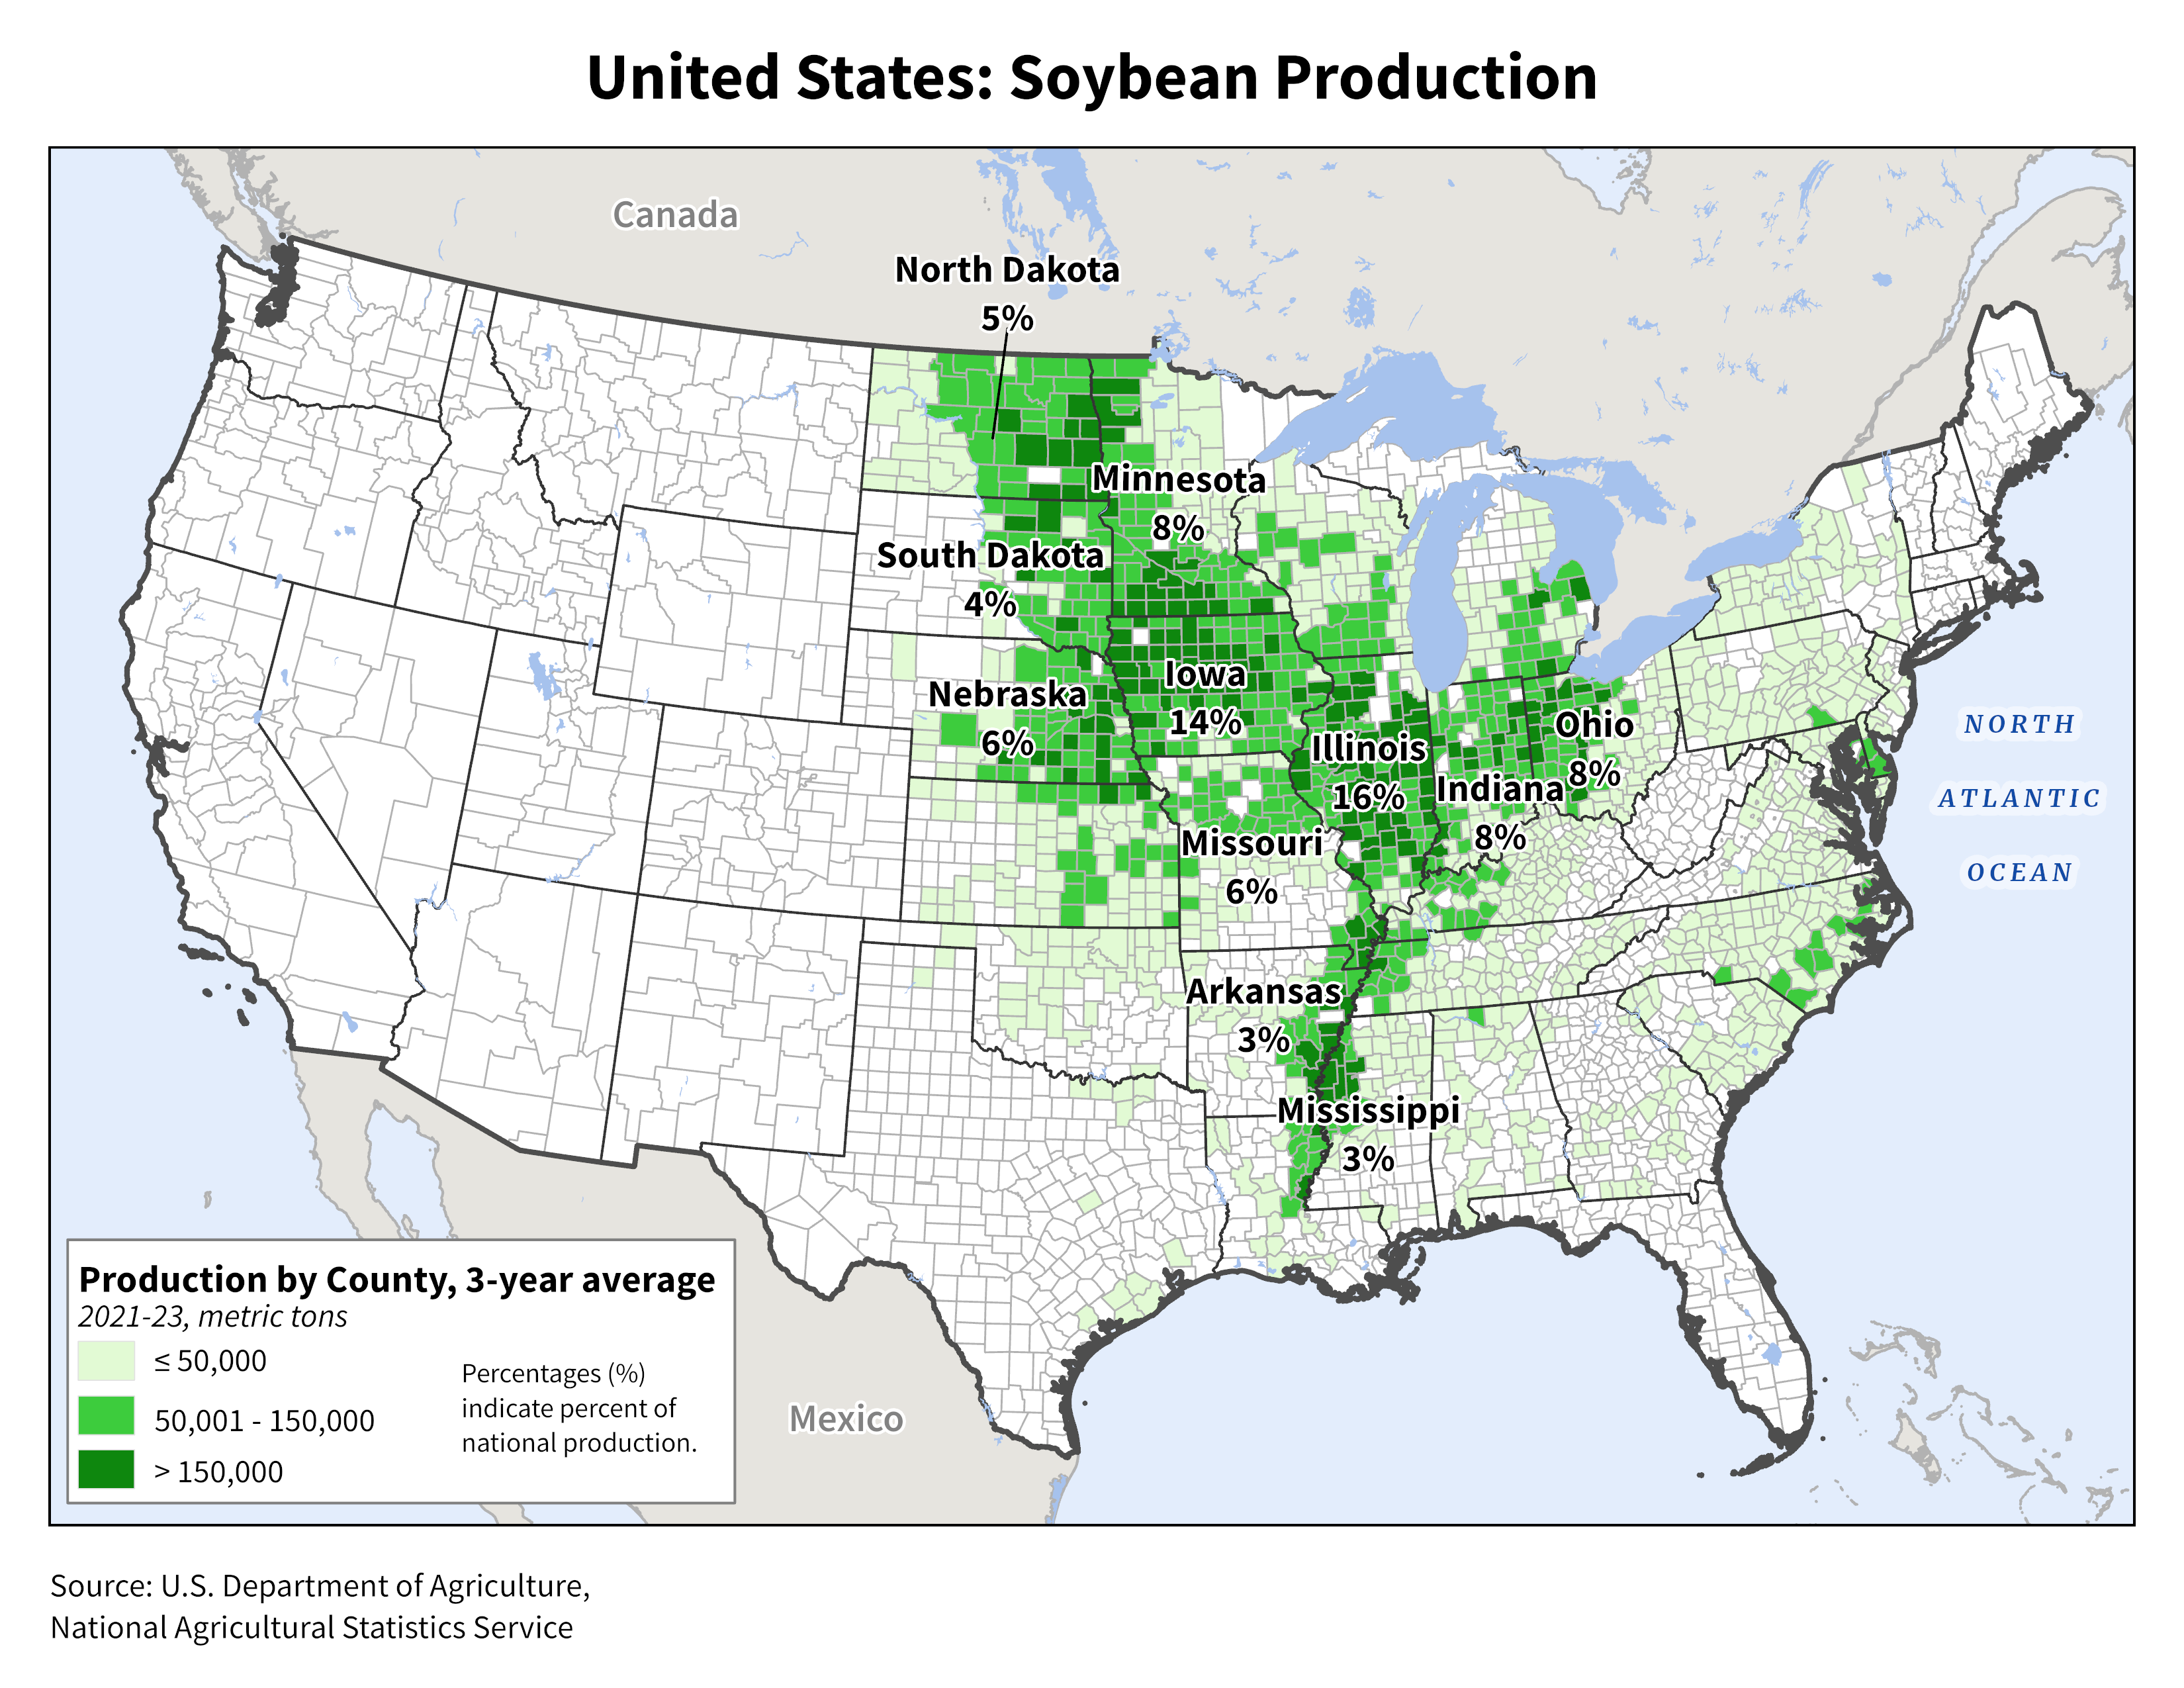
+++++++++++++++=
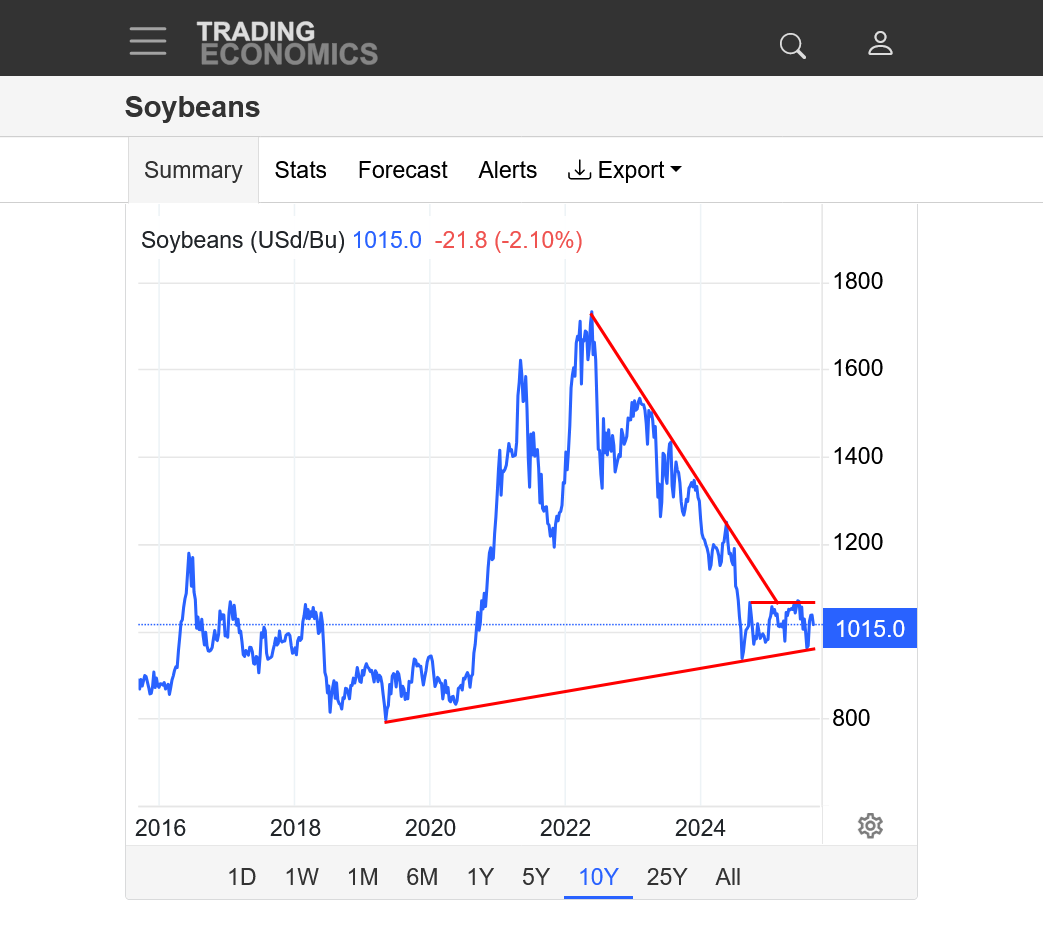
We can see how little the bean market was worried about this frost/light freeze this past week. The price chart below is for the front month, September. This source hasn't rolled over to the main month, November yet, even though September only has a few hundred contrast in open interest, while the November(trading +20c higher) has almost 400,000 in open interest!!
https://tradingeconomics.com/commodity/soybeans
1. 1 week: Anticipating a rapidly accelerating, very fast harvest in the flash drought states. Delayed in the Upper Midwest that will need an extra couple of weeks from wetter conditions and maturity not as advanced.
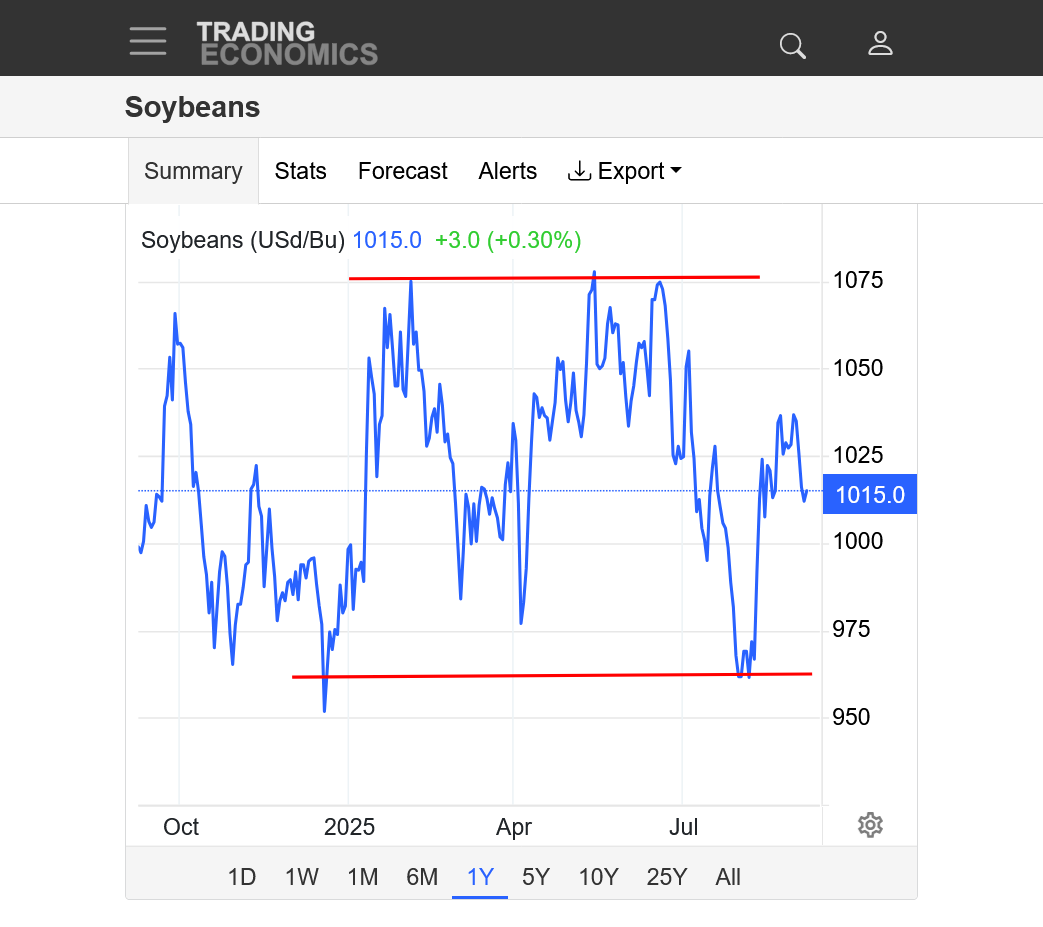
2. 1 year; Range bound. Spike low in December BEFORE the USDA bullish shocker in January. Spike HIGH in early February from that USDA report. Double top, typical/seasonal high in late Spring/June. Huge spike lower in July with favorable weather for flowering and development. Seasonal bounce up in August with help for the bullish USDA report. We're in the middle right now.
3. 10 years. Symmetrical wedge. Could be a bear flag OR a bull flag here.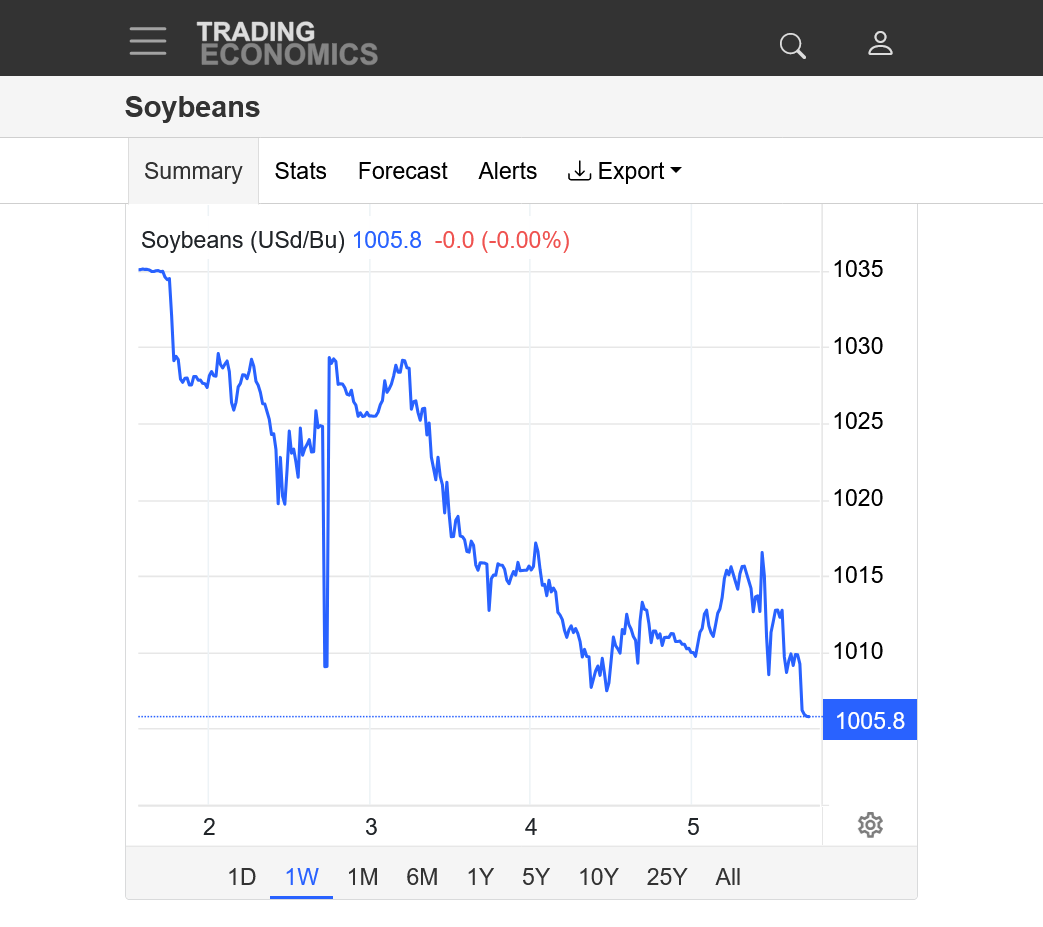
Good discussion going on here too:
Flash Drought/weather updates
15 responses |
Started by metmike - Sept. 2, 2025, 9:39 a.m.
From last Friday:
New-crop US corn sales last week nearly touched the top end of trade estimates, though wheat sales fell short. Still no soybeans explicitly to China for 2025/26.
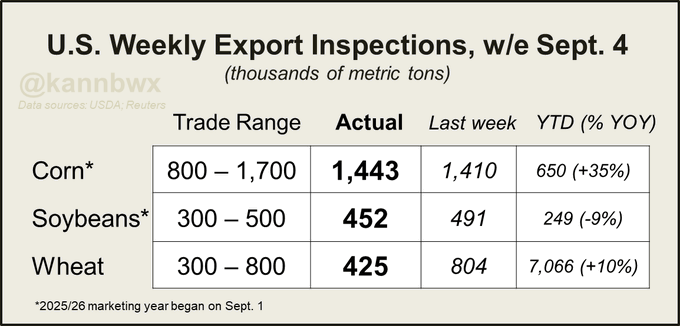
US corn and soy export inspections last week were toward the upper end of trade expectations, though wheat inspections were toward the lower end. This past week gapped the start of 25/26 for corn and beans, so those YTD / YOY stats shouldn't be scrutinized yet.
++++++++++++
China imported 12.28 million metric tons (451 mln bu) of soybeans in August. That edged last year's record by 1% and easily beat expectations closer to 11 mmt. Crushers reportedly overbought beans amid a lack of progress with the U.S.-China trade talks.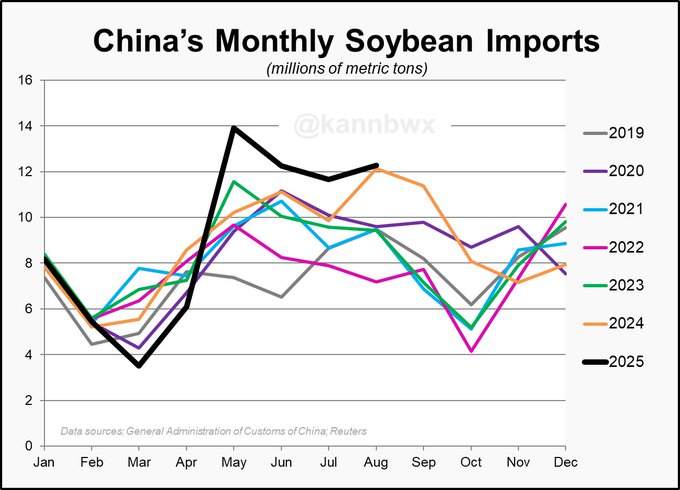
That puts 2024/25 imports at a record 96.5 mmt with just one month left to go, up 3.3% from the same period last year (which was also the previous record high). Imports certainly accelerated from May forward after a very slow period in early 2025.
+++++++++++
metmike:Crop condition report at 3pm doesn't matter anymore but it may show another tiny drop for C and S. Wheat planting of HRW in the Plains should be off to a good start but its early(this would be the first report). Not much east of that for the SRW crop Which is planted a bit later from a lot of double crop with beans.
Both C and S dropped 1% As expected.
Winter wheat 5% planted vs 6% average. Still extremely early.
The 2025/26 U.S. corn harvest is officially underway, as is that for cotton. Crops are progressing close to their average paces (for now), but one, potentially two warm and dry-ish weeks are on tap. Planting for the 2026/27 winter wheat harvest is 5% complete.
+++++++
metmike: The USDA WASDE report will come out this Friday 9-12-25.
Not sure if there will be changes
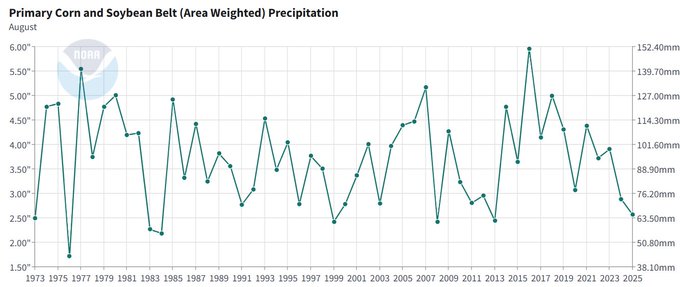
2025 marked the driest August across the U.S. corn and soybean belt since 2013.
Conab boosted Brazil's 2024/25 corn and soybean crops on Thursday. The agency also reviewed and revised the past five years of soy crops, resulting in a 13.12 mmt increase in production overall. Despite the bigger corn crop, Conab didn't hike corn exports.


