back to trading weather
I'm still firmly in the bullish weather camp right now.
The huge changes in the models to much cooler in the East and South is pounding natural gas. Some of that cooler will impact the Cornbelt and MIGHT introduce more northwest flow, upper level perturbations but I'm not sure.
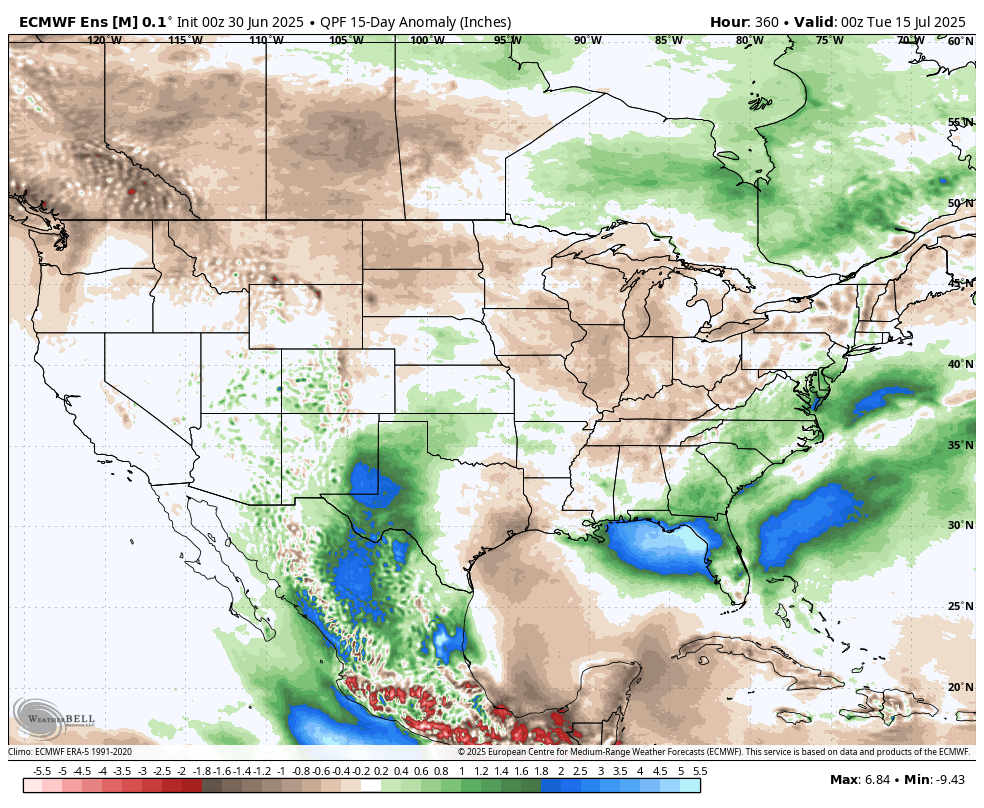
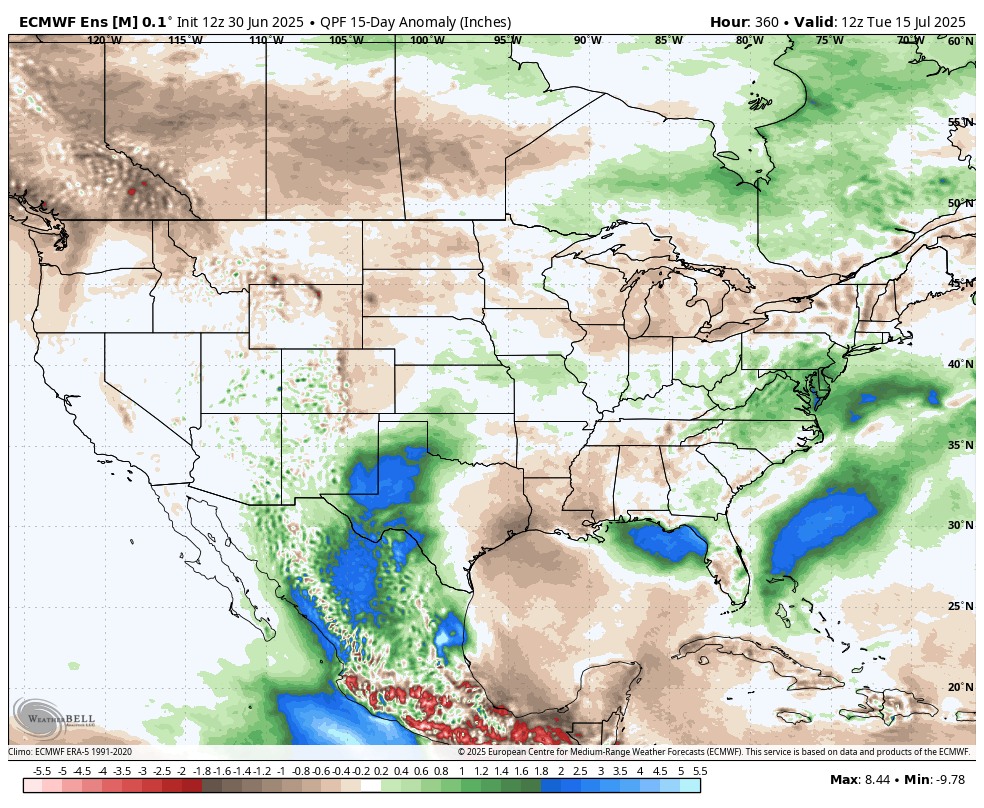
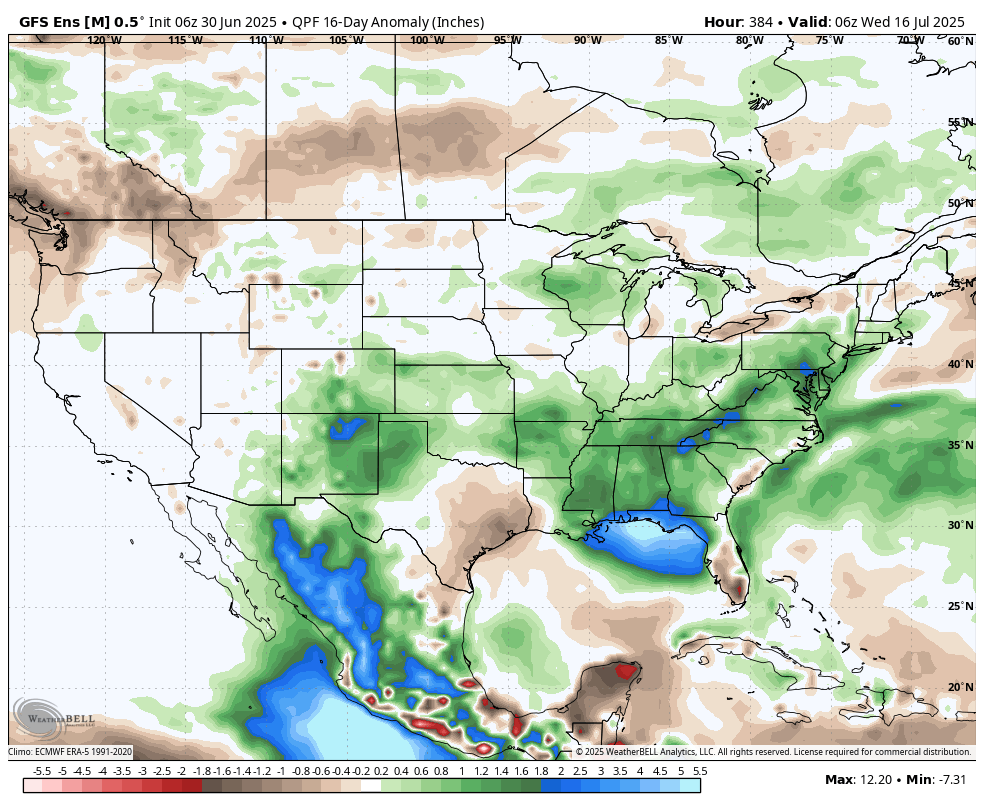
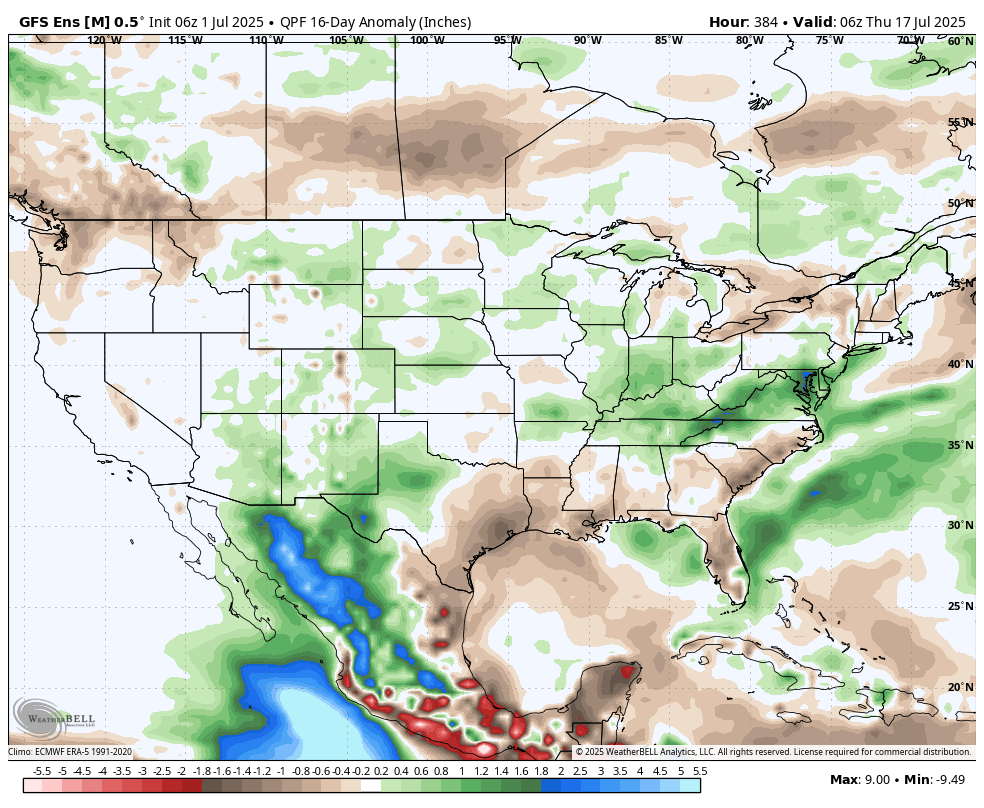
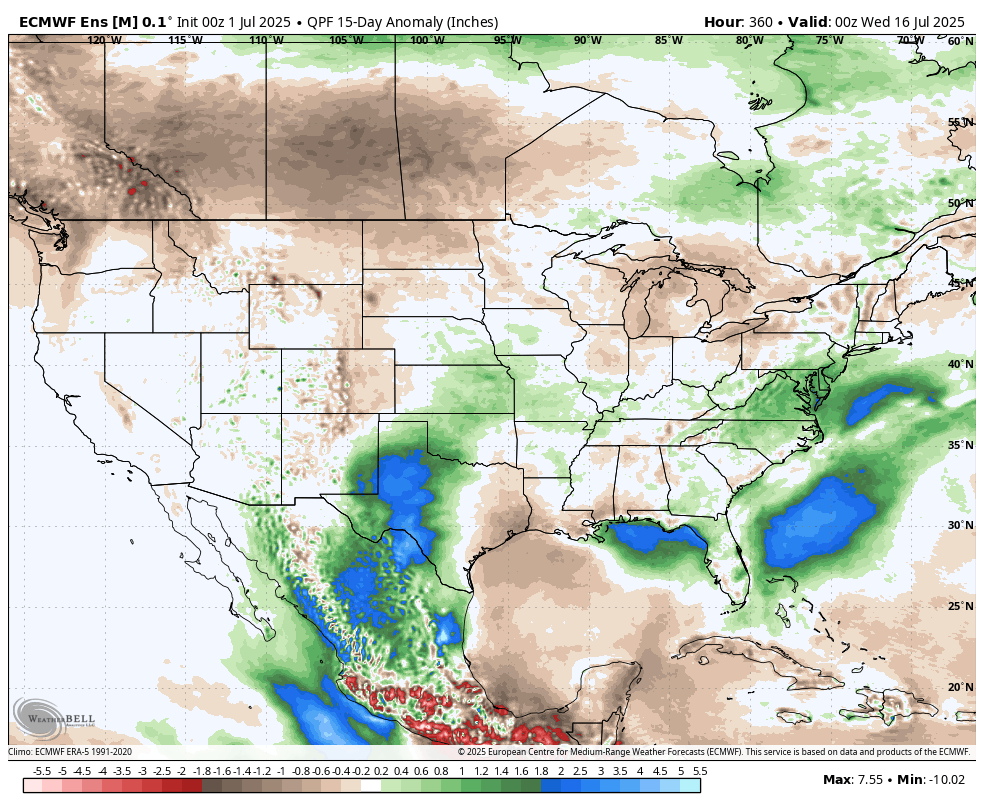
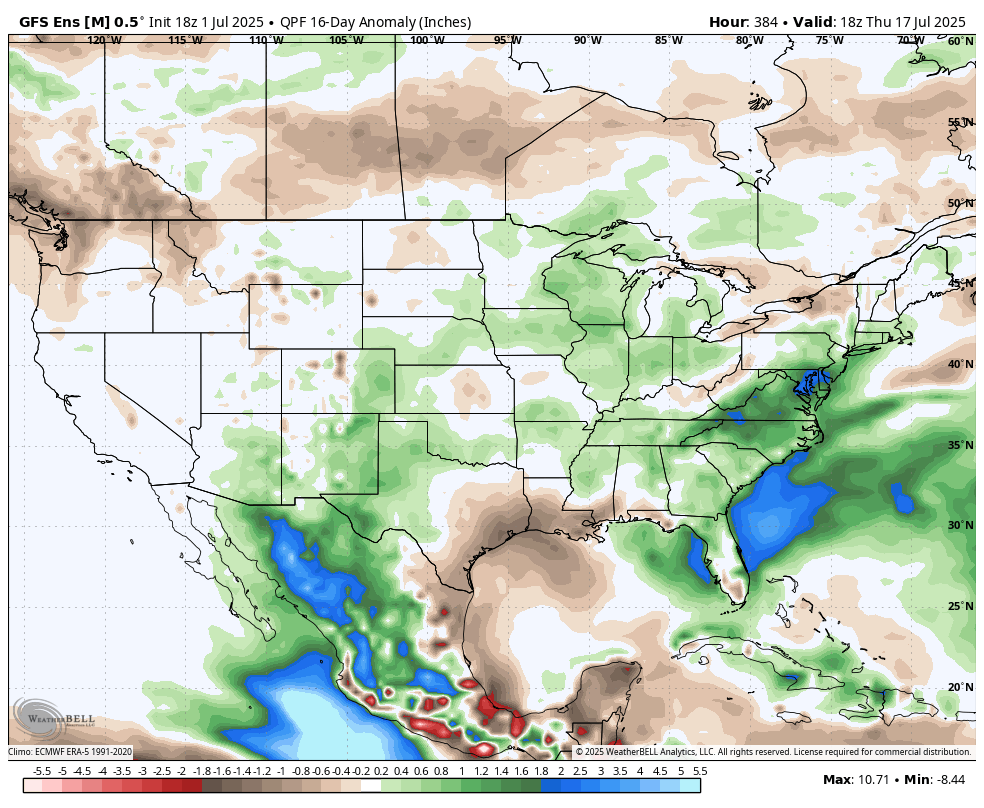
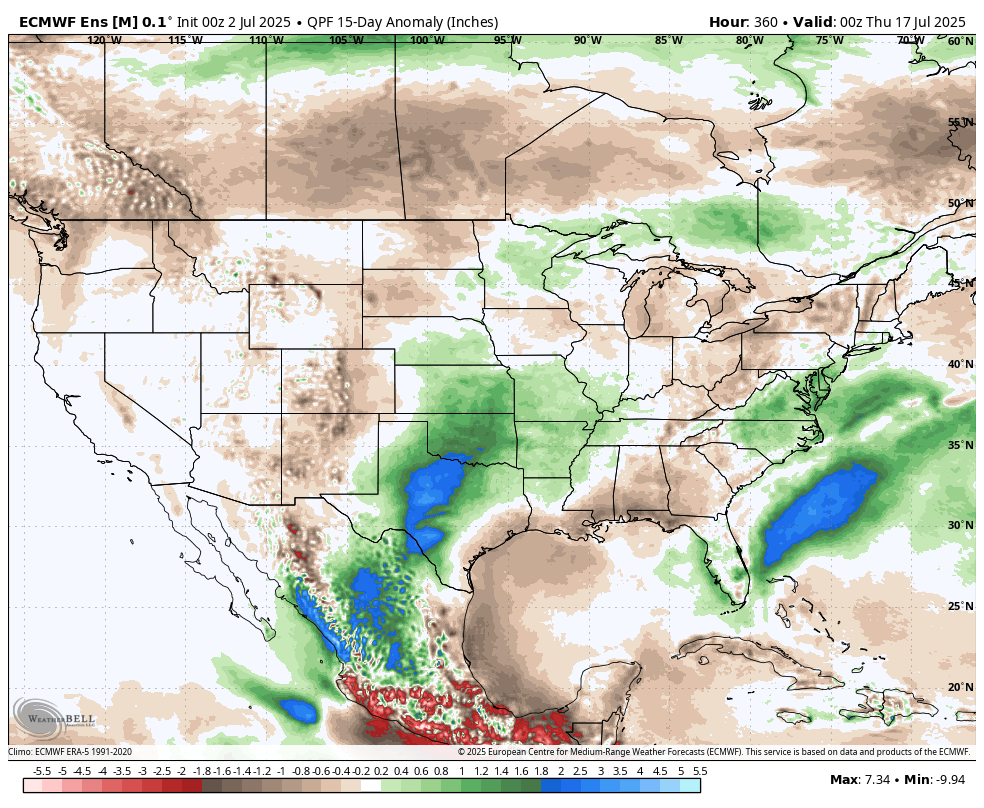
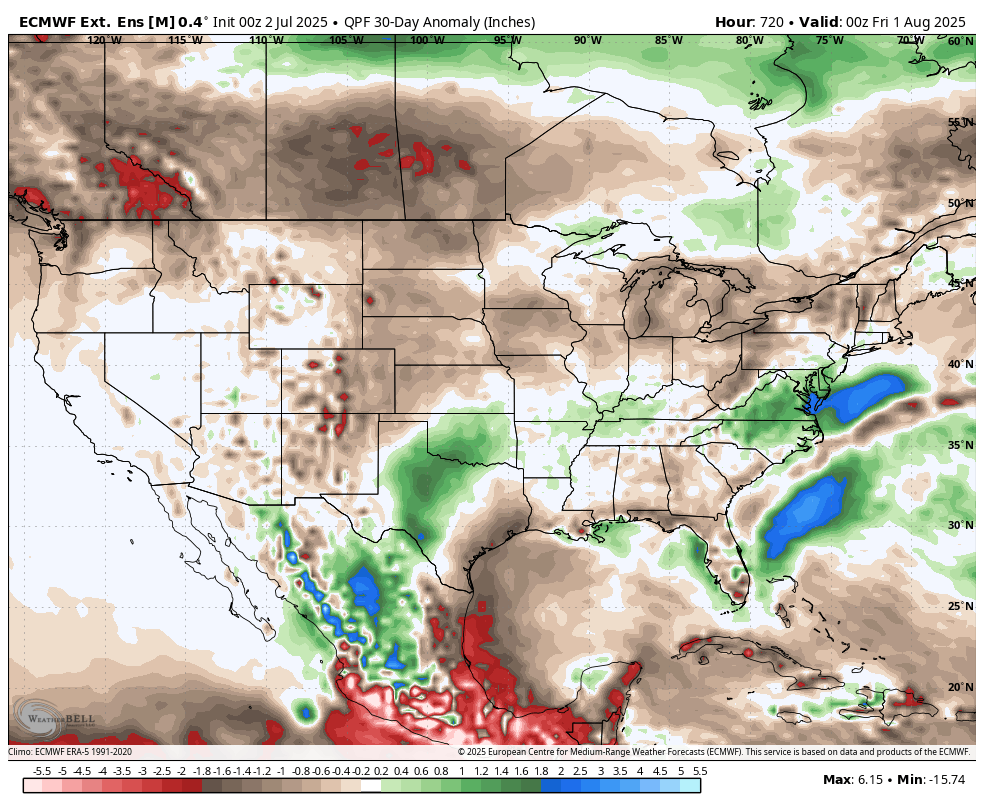
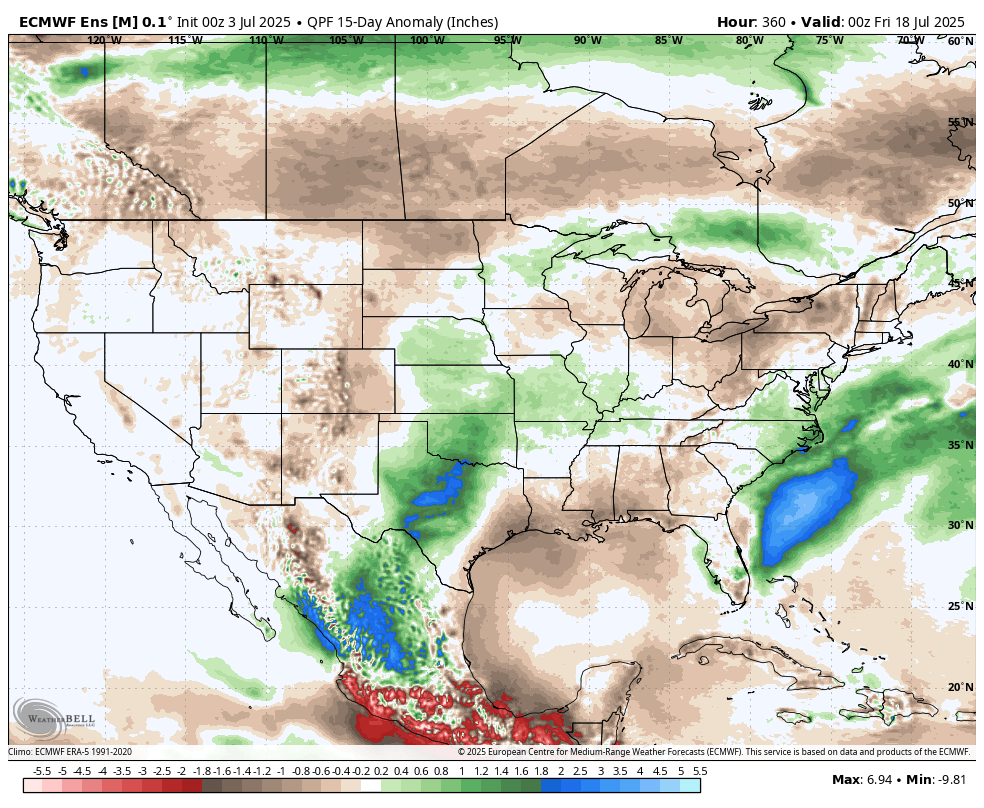
The European model is by far the driest: 2 week rain anomalies.
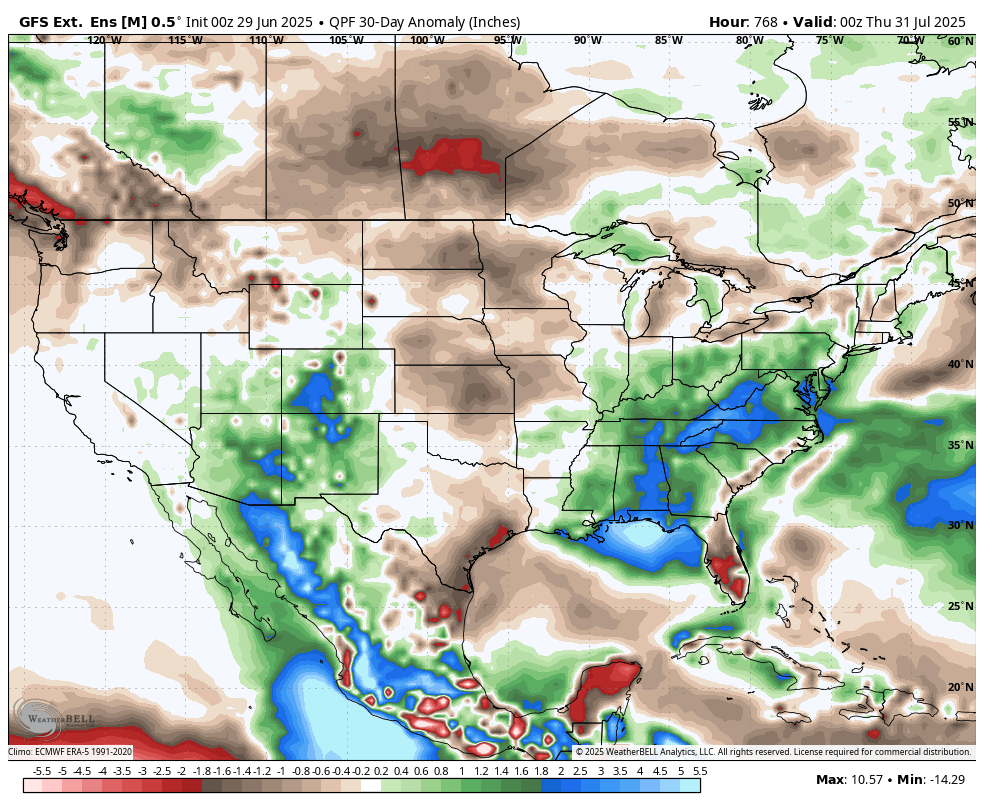
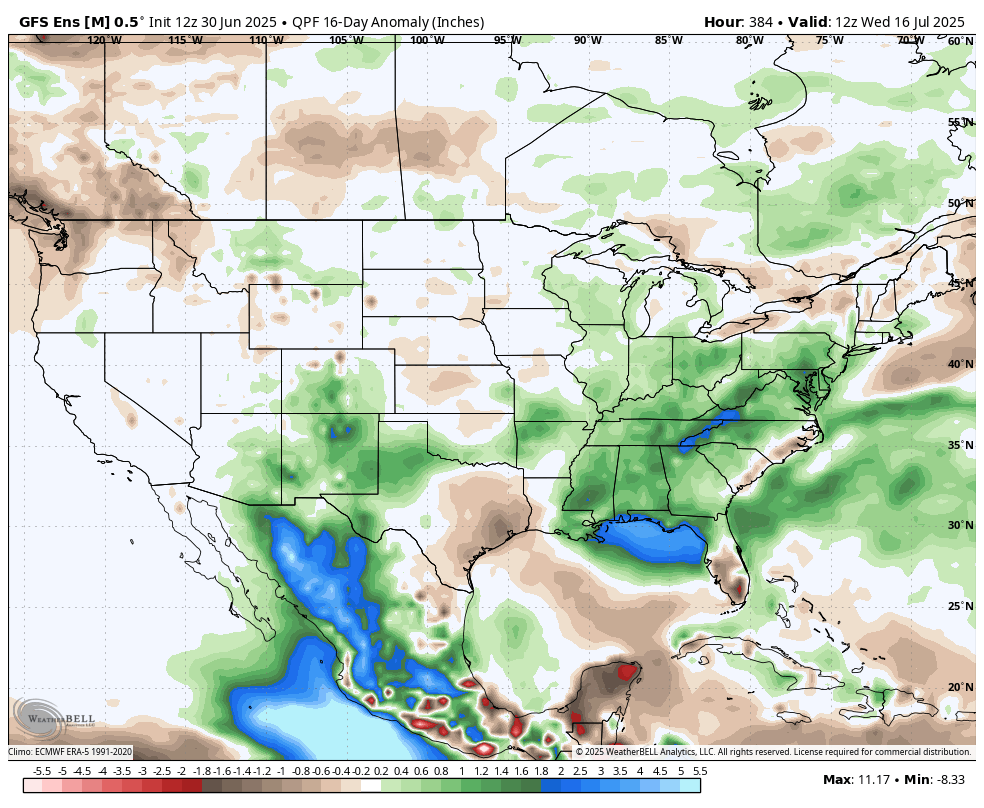
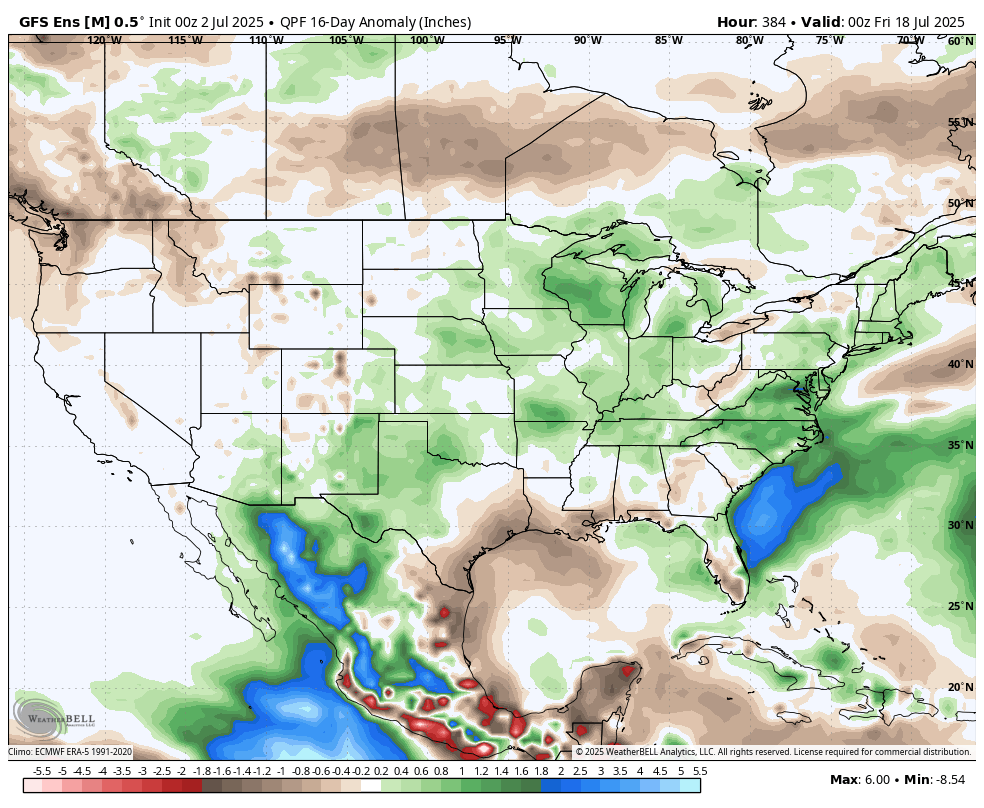
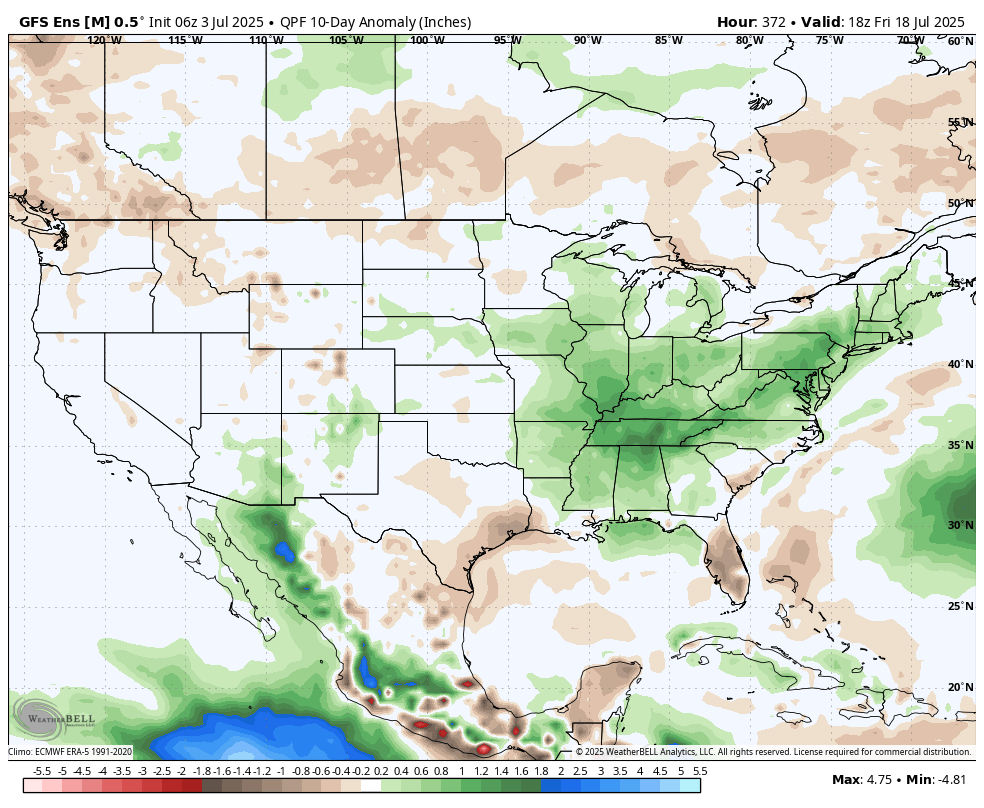
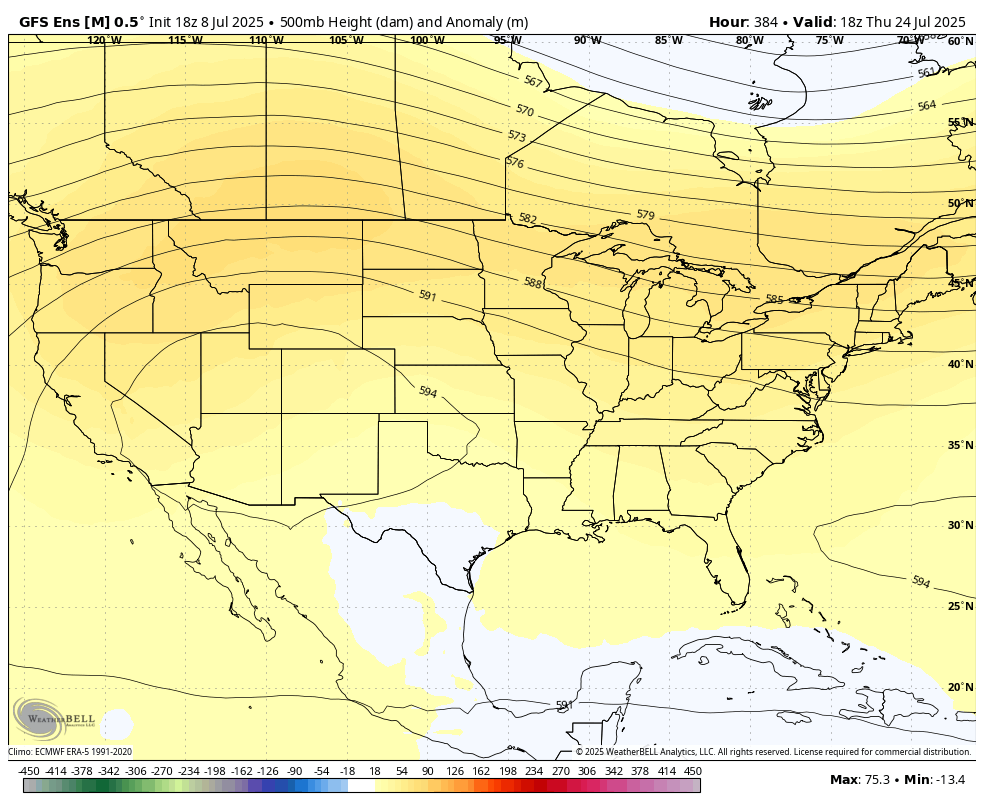
The American model below is not so dry, in fact its got above average greens in some places. What a contrast for the same period as the map above(next 15 days). Even if I was completely convinced of the map above, for prices to respond bullishly at this time of year, the big traders also have to believe in it.

Also, we are 1 hour after the release of the report. There could still be some lingering reactions vs expectations since the models have an incredible disparity in rainfall(with more cooling than Friday because the upper level dome retrogrades farther west than before).
I'm also still barely in the camp of us putting the lows in because the pattern turns more bullish in July but with less confidence than last week because the upper level dome is not as threatening and now we have much cooler temps than we did on Friday.
This not especially bullish or bearish.......at the moment but for Evansville IN, where we live its disappointing. We got .19 early this morning which was the first rain in almost 2 weeks and last weeks highs in the 90's has dried out the top layers of soil.
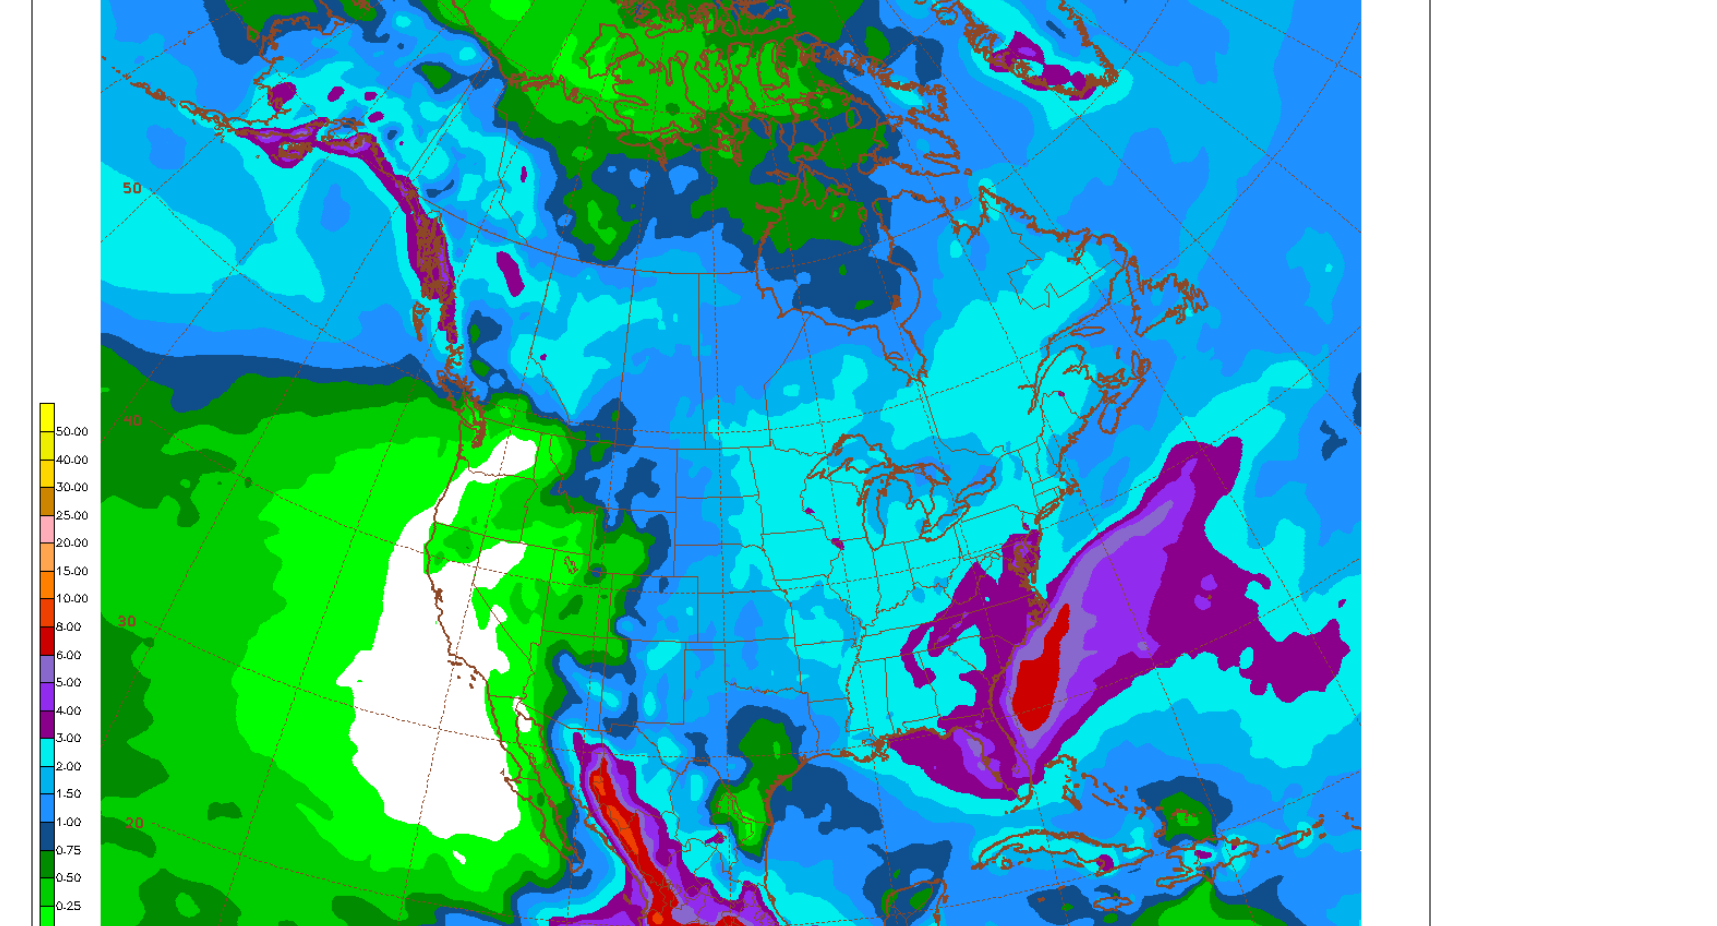
7 Day Total precipitation below:
http://www.wpc.ncep.noaa.govcdx /qpf/p168i.gif?1530796126

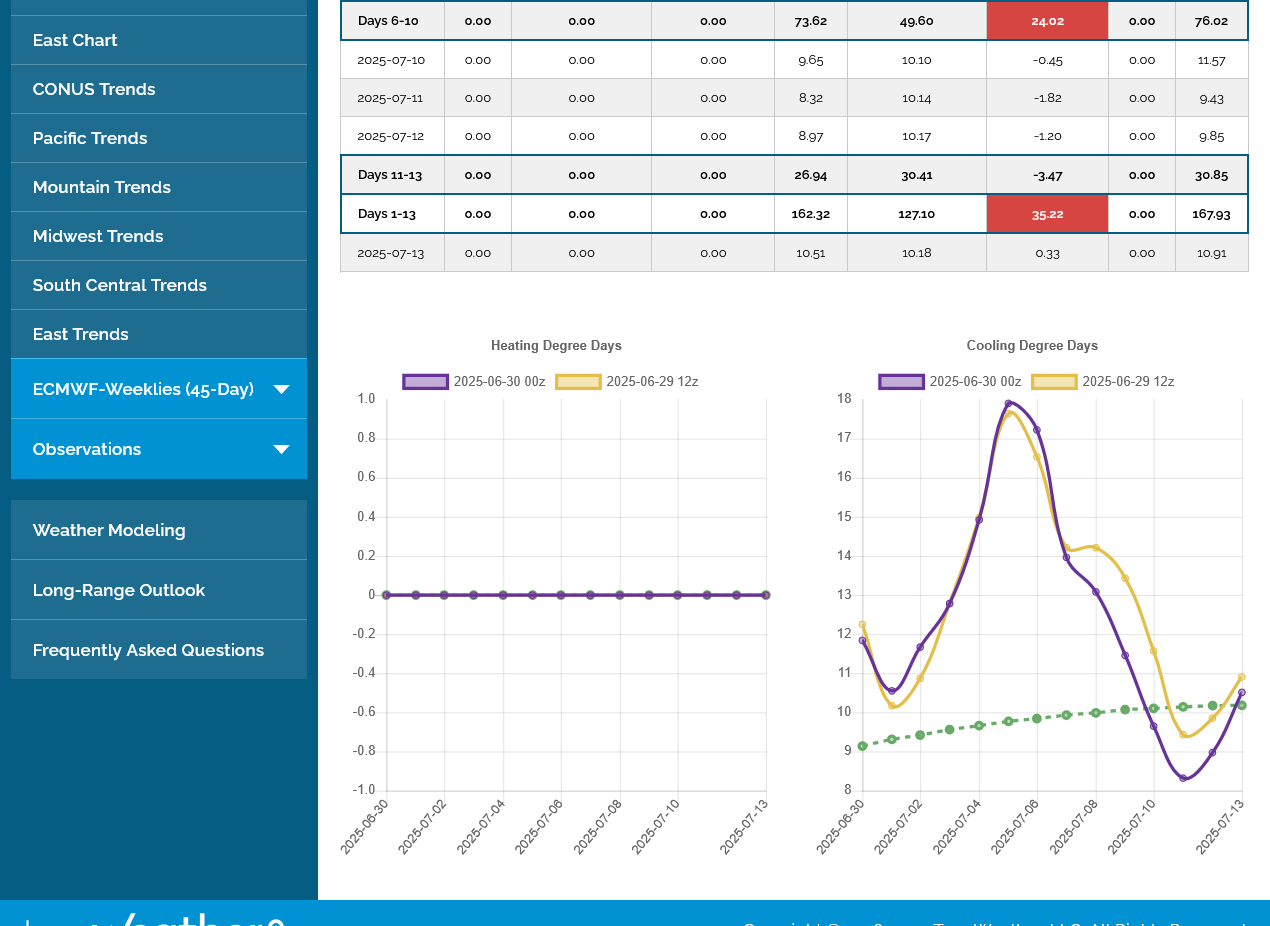
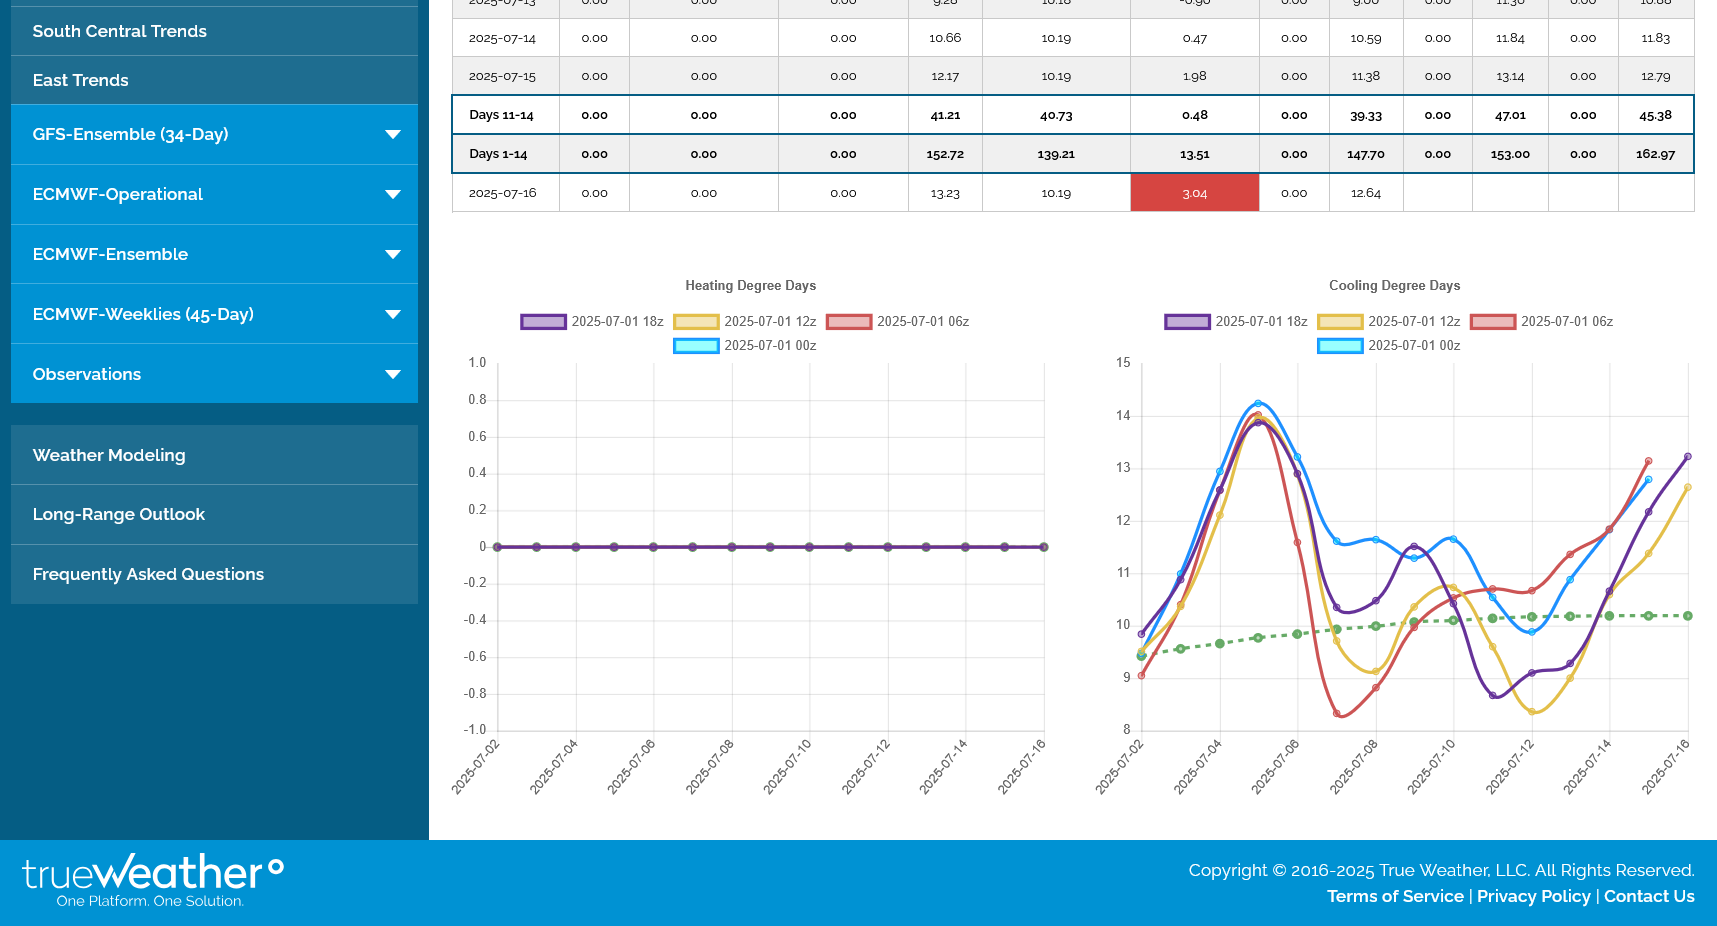
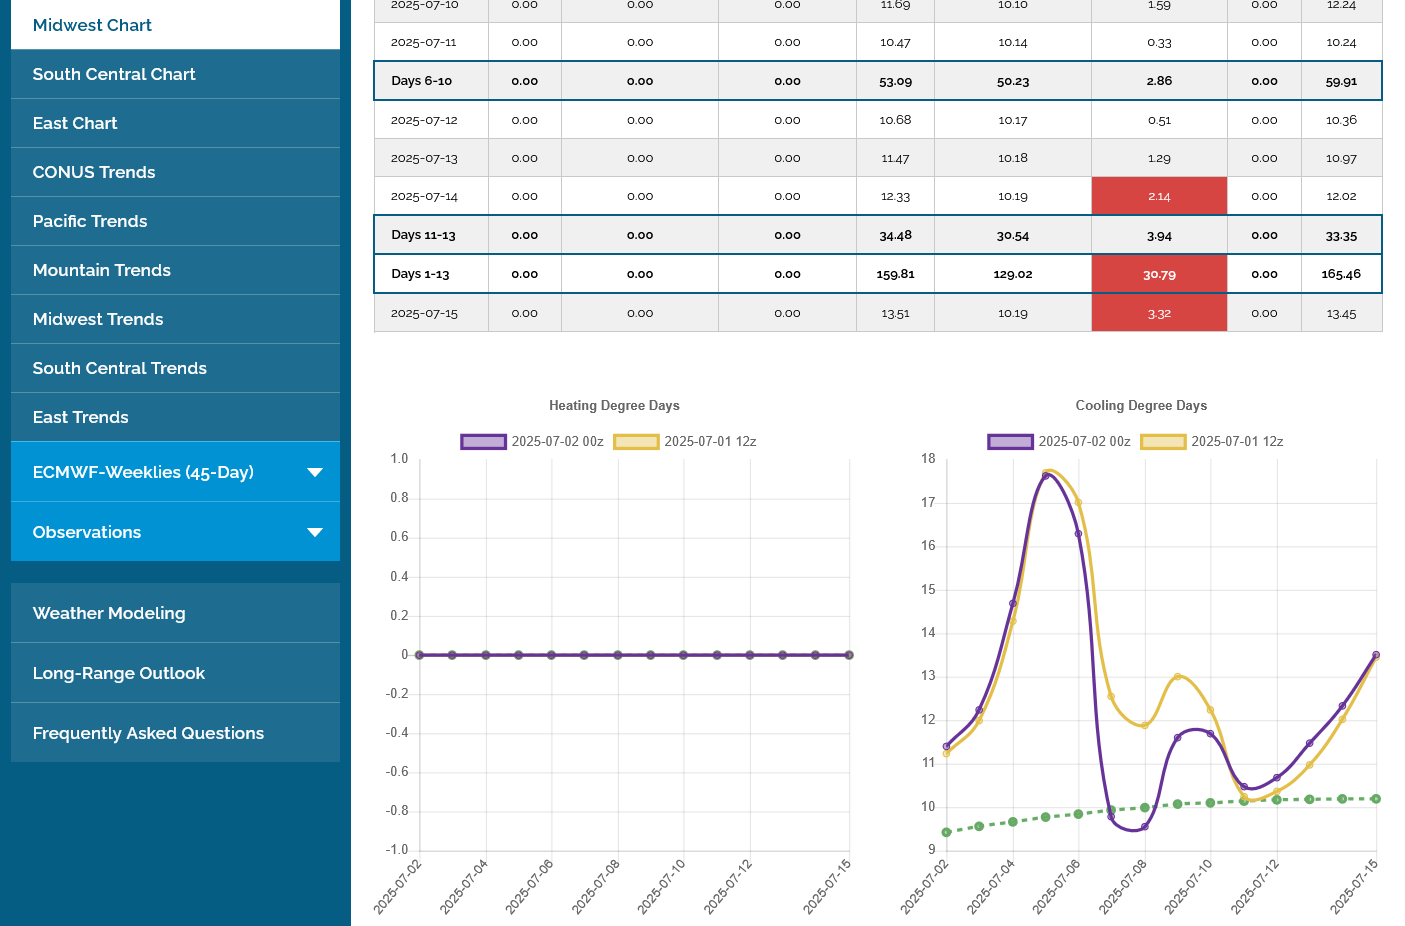
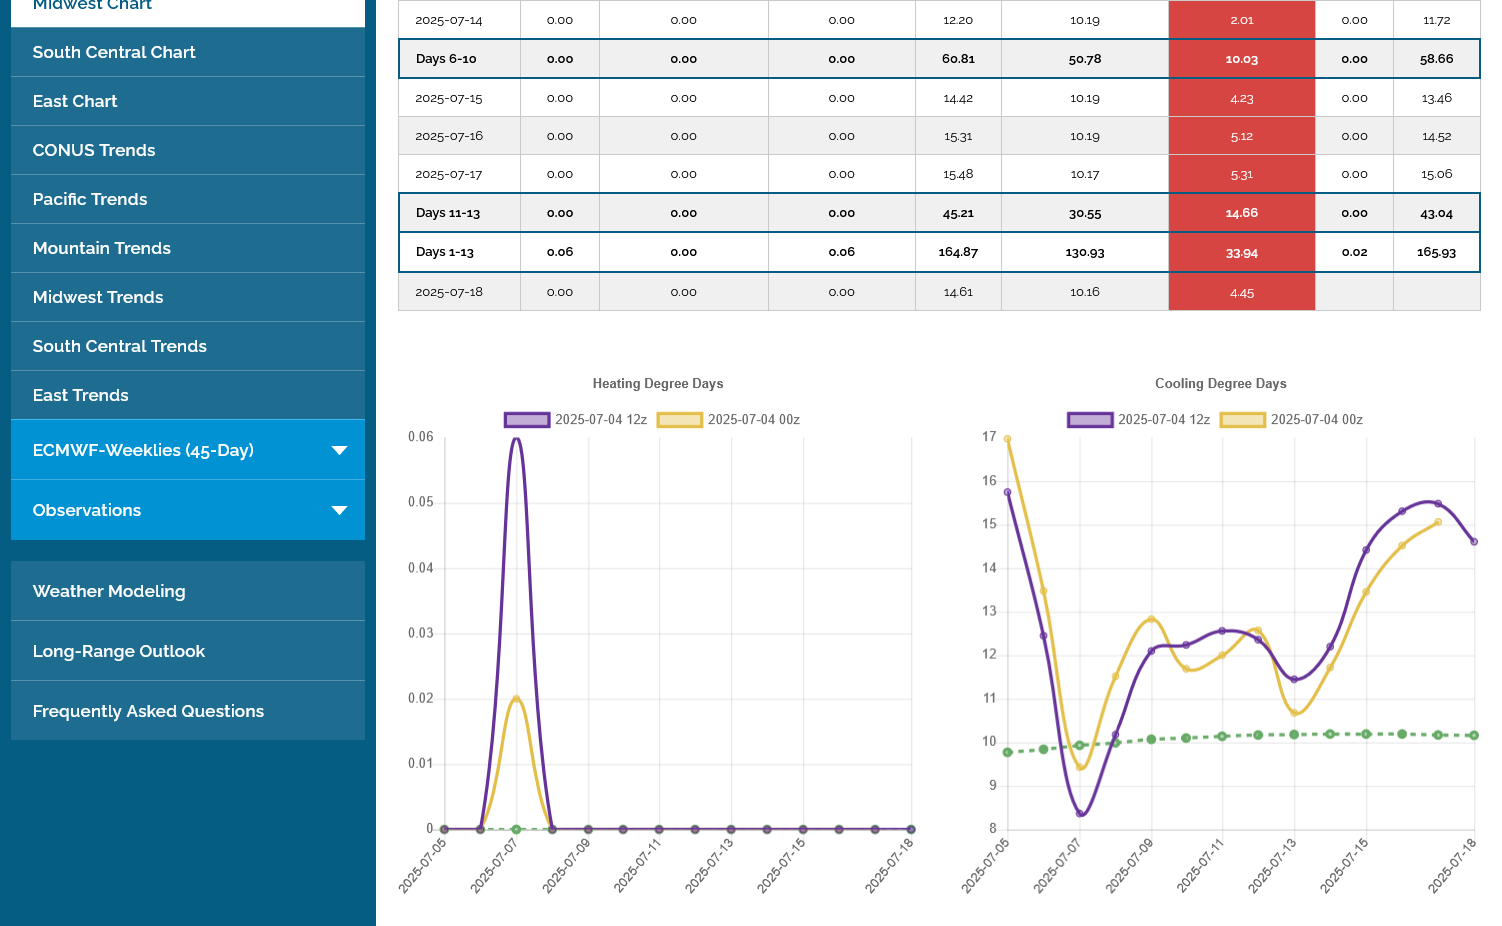
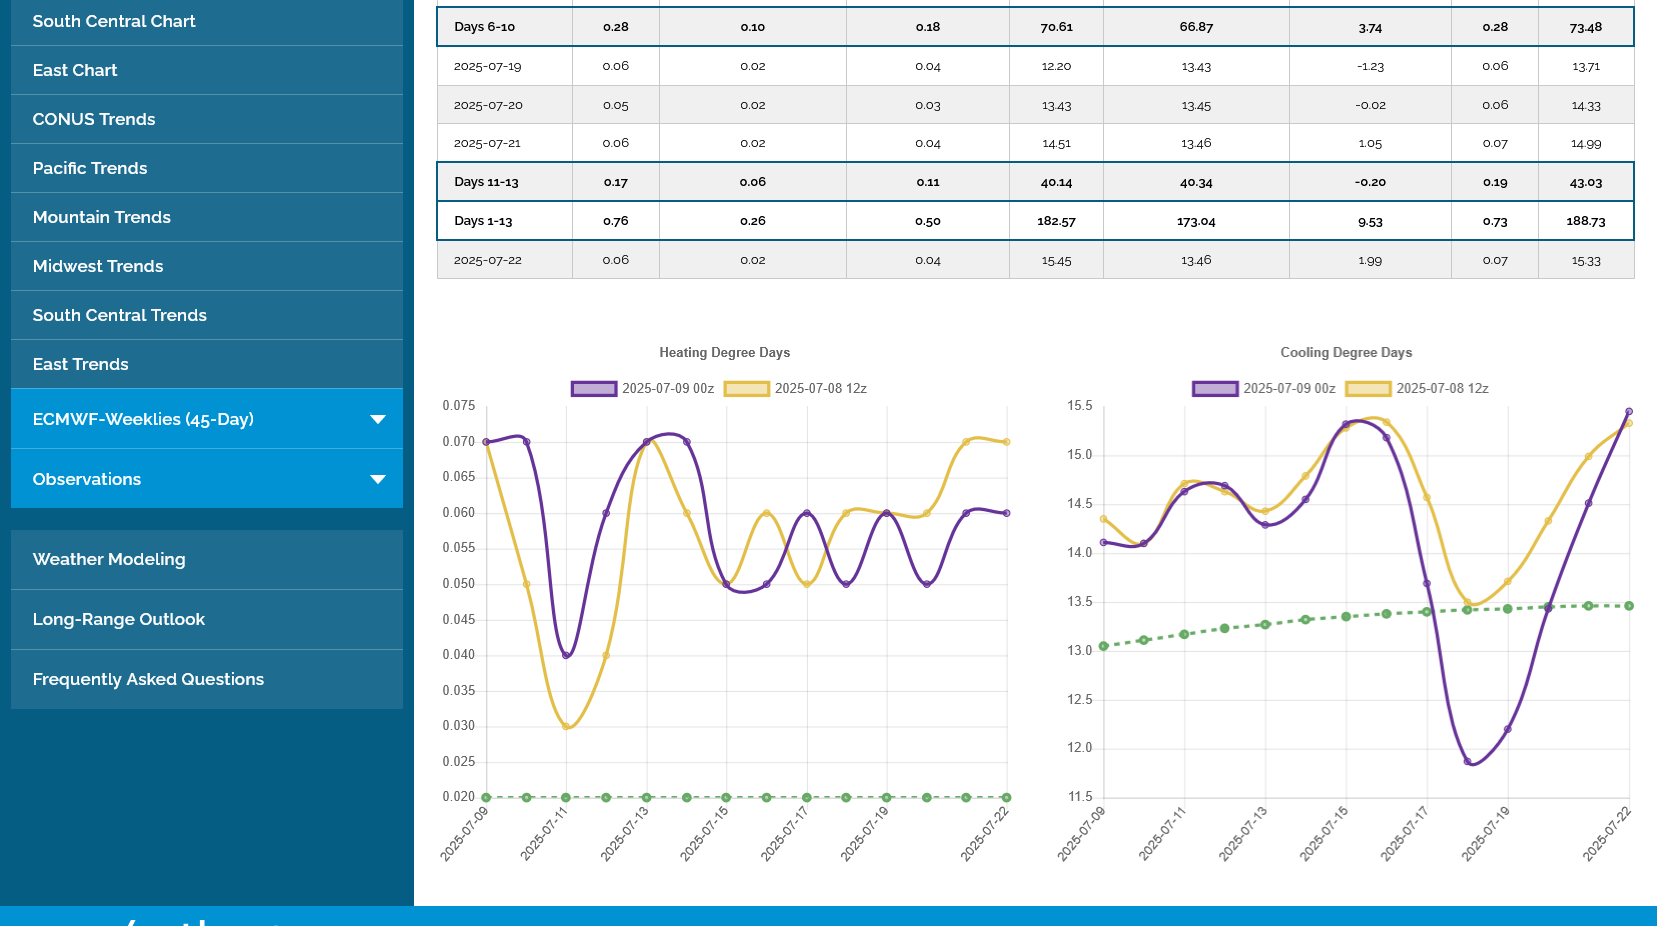
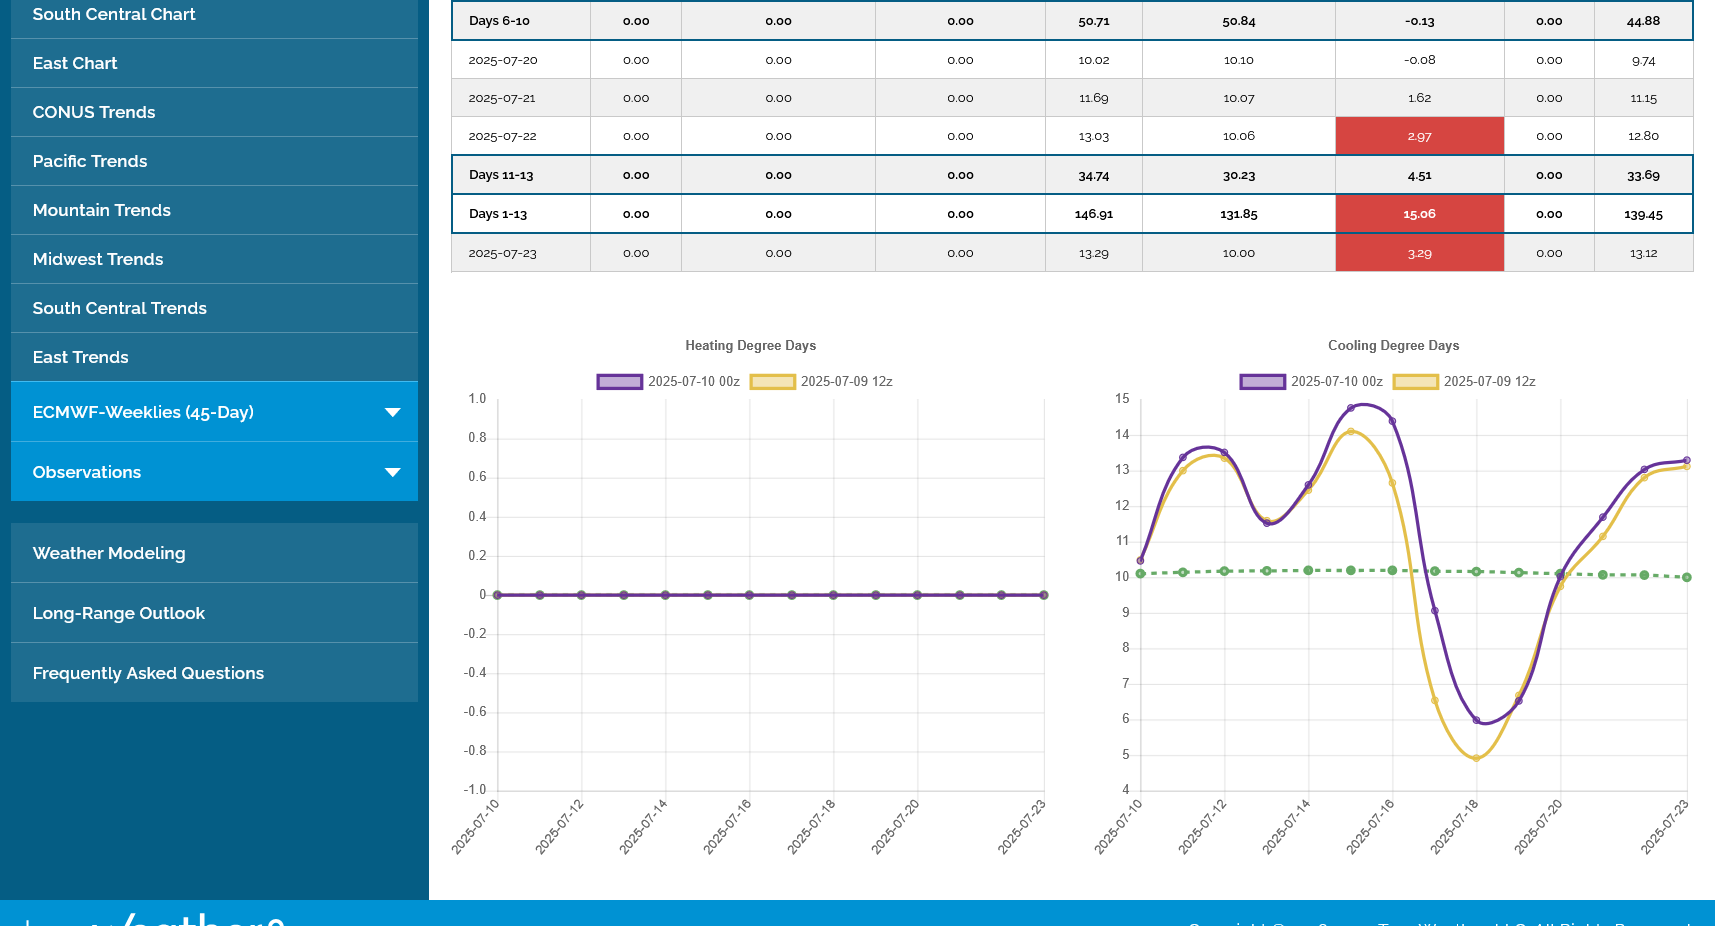
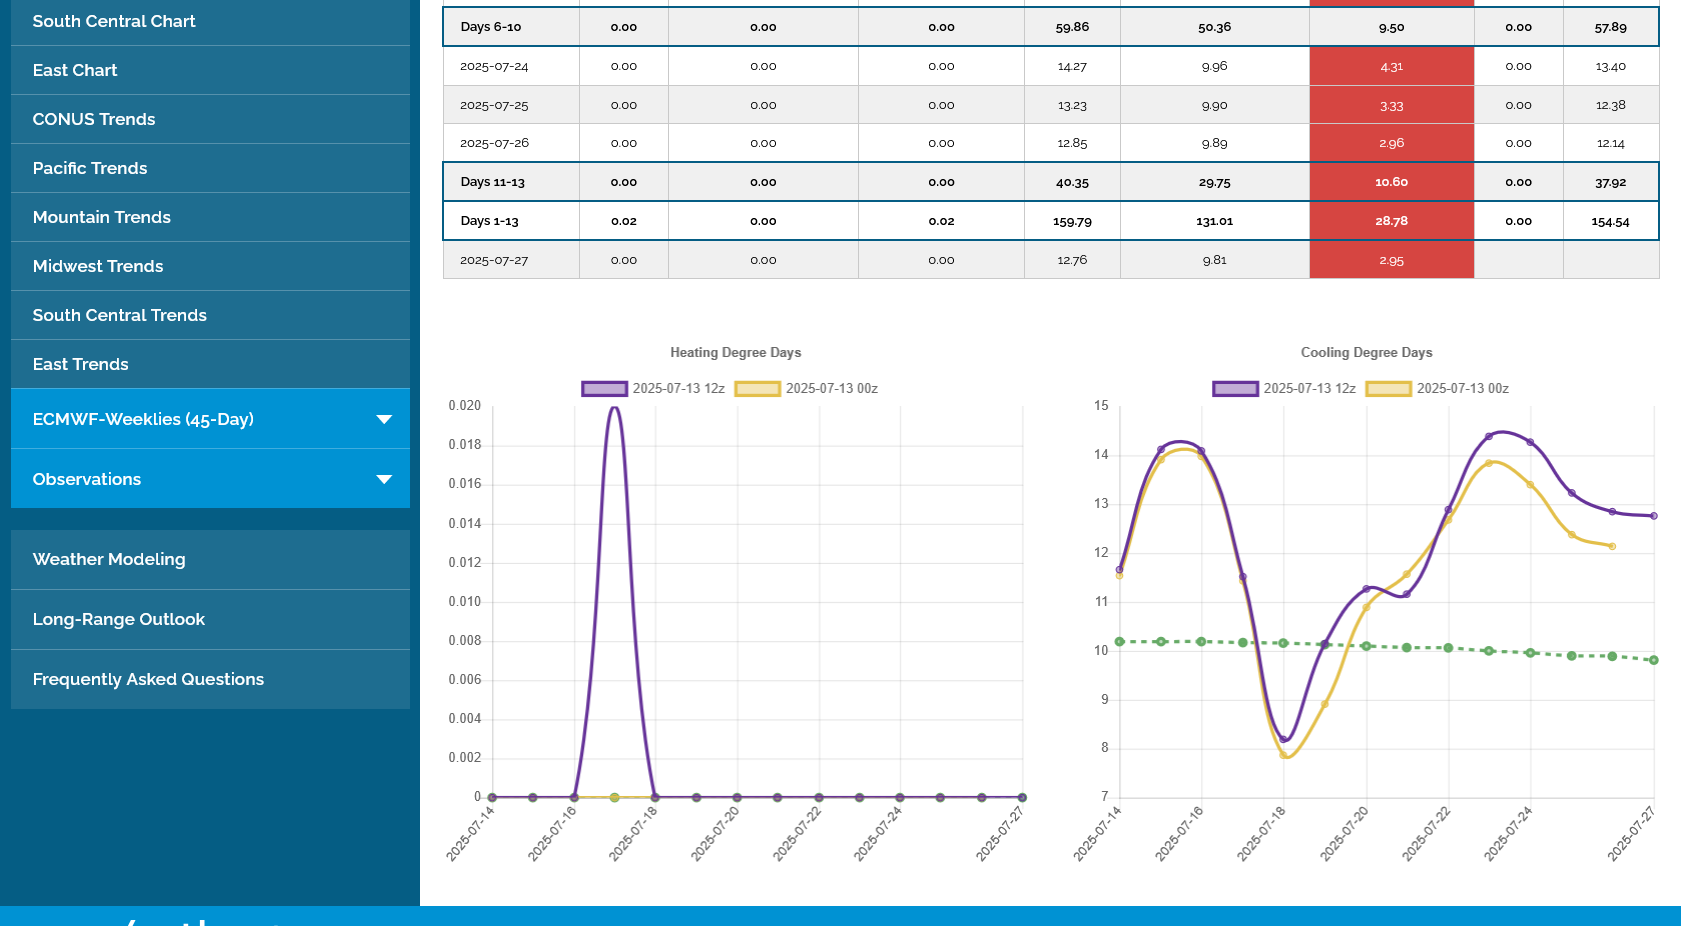
I plugged in the CDDs for just the Midwest the next 2 weeks on the European Ensemble model below on the right with the purple being the last 0z run. Its very revealing. Instead of heat in week 2 we now have temps CRASHING down to average and even a bit below average for several days. After the brief spike higher in heat later this week, these are BEARISH temperatures for beans and especially corn in July. Especially corn because this would be good for pollination.
Longer range forecasts like this have low skill!
This was the July rainfall anomaly map from the last GEFS(update every evening):
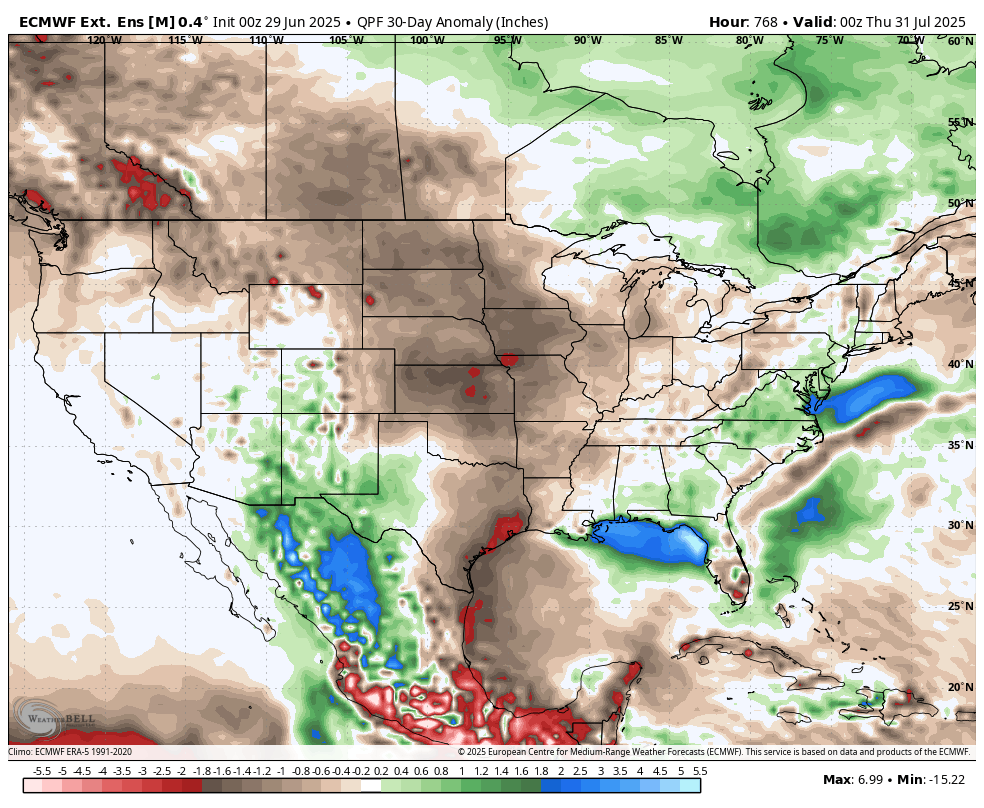
This was the same map from the last European model, updated late every afternoon. Much more bullish/drier:
These were the July Temperatures from the last GEFS. The heat backed up to the Plains and N.Rockies:
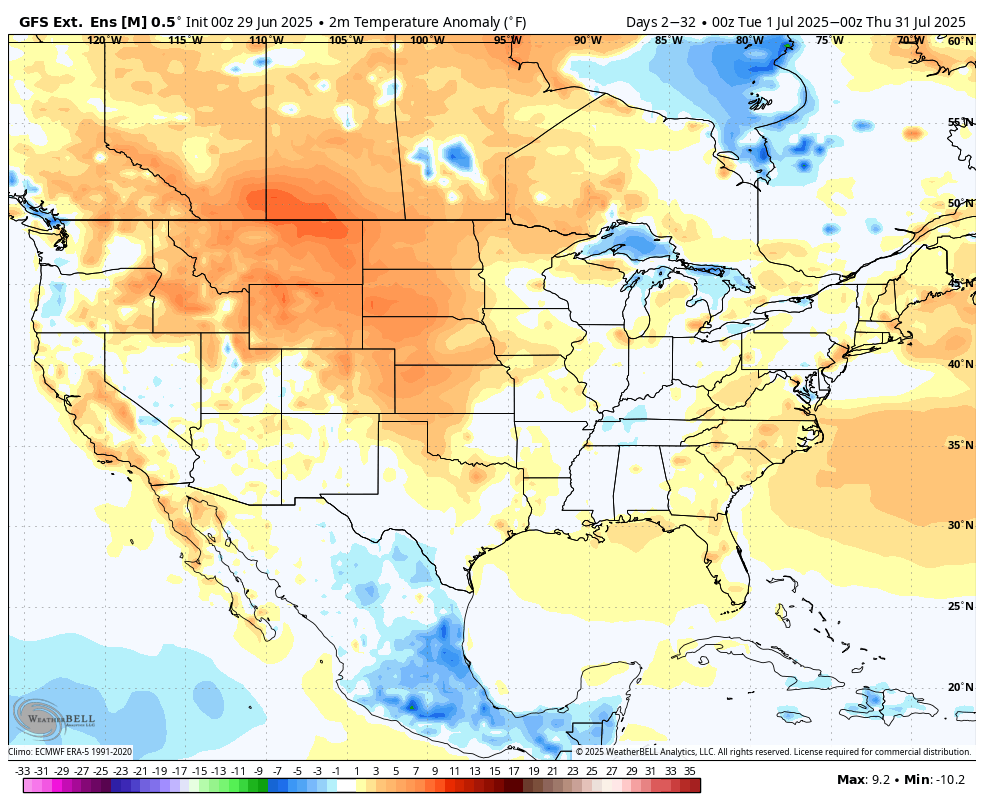
This is not much different than the same temperature map that the market had on Friday:
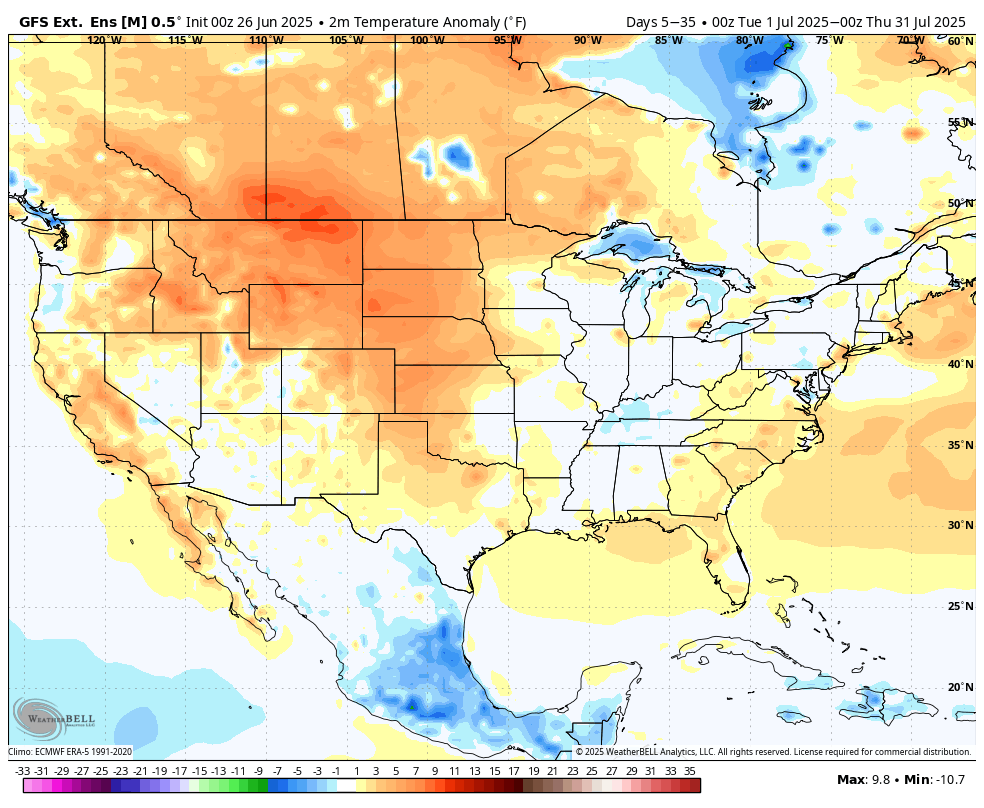
Again, long range forecasts that go out this far often have low skill but what we can assume with high confidence is that the hotter temperatures are mostly likely in the Plains to the WCB, which is where the least amount of rain is likely to fall.
The last 12z EE directly below added alot of rain compared to the previous 0z run, 2nd map below. This is the anomaly compared to average.
I'm intentionally making these maps small since this thread is going to get long with updates pretty fast.

This was the last 12z GFS for 2 week(16 day) rains, still pretty bearish. 2nd map was the previous 6z run.
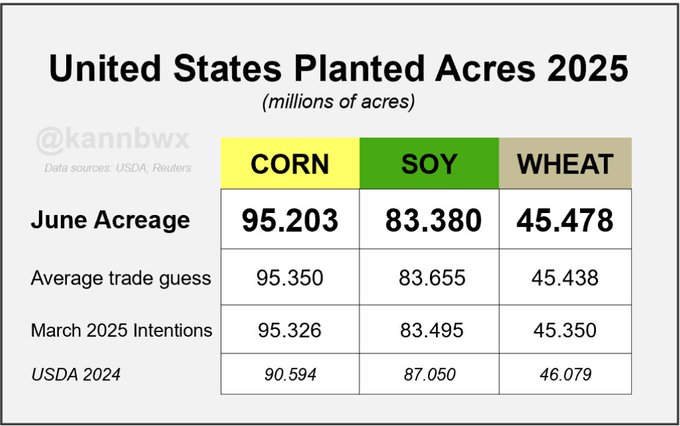
USDA's June area survey showed similar US #corn plantings as the March survey, though there were some differences by state. June acres came in lower than in March across many of the top producing states.
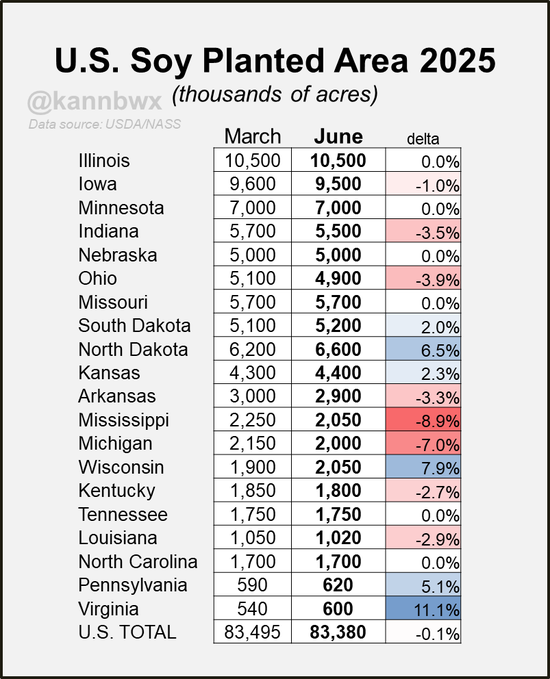
Similar to corn, US #soybean acres were steady or lower versus March across many of the top states. This represents the smallest soybean area nationally since 2020 and the third smallest of the last decade.
The third lowest bean area of the last 10 years (behind 2019 & 2020, which featured planting interruptions). So basically you can say that this is the lowest "natural" US soybean acreage since 2015. Remember when 90 million was the benchmark? Does 45Z impact this for 2026?
++++++++++++++++=
Get all the detailed USDA reports here:
Crop condition:
Corn unchanged
Beans +3%
Cotton +4%
HRS Wheat -1%
https://www.nass.usda.gov/Publications/
1. The 16 day rainfall outlook on the last 6z GEFS vs average continues to look BEARISH for the C and S markets.
2. The last 0z European Ensemble model is not AS bearish.
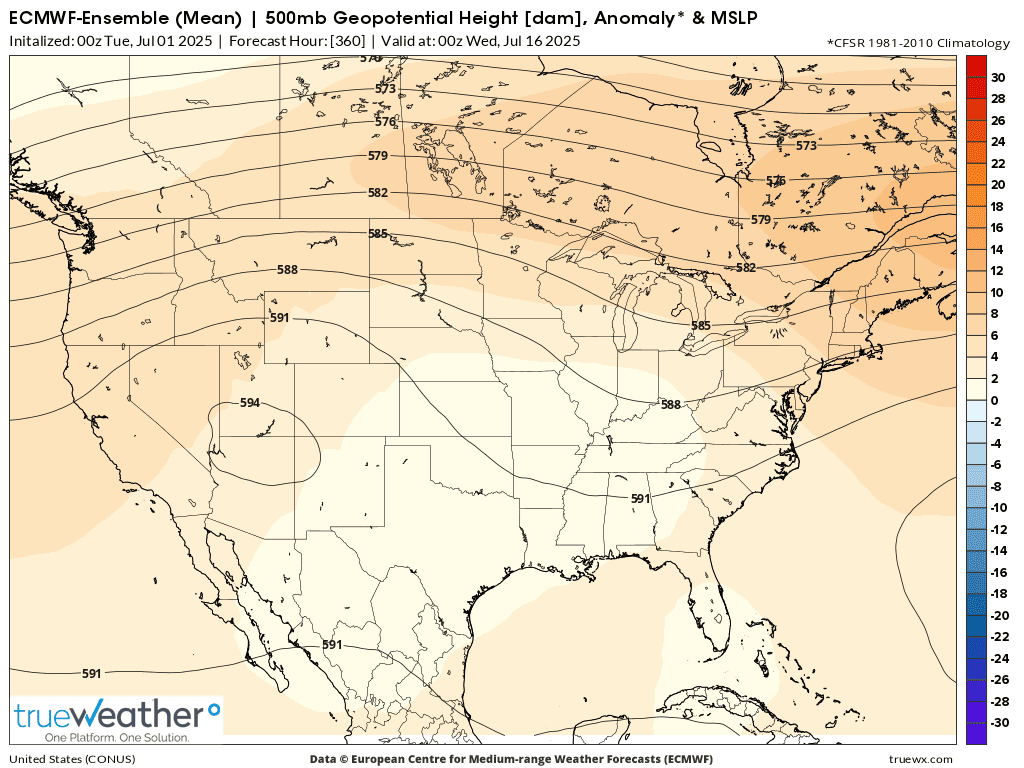
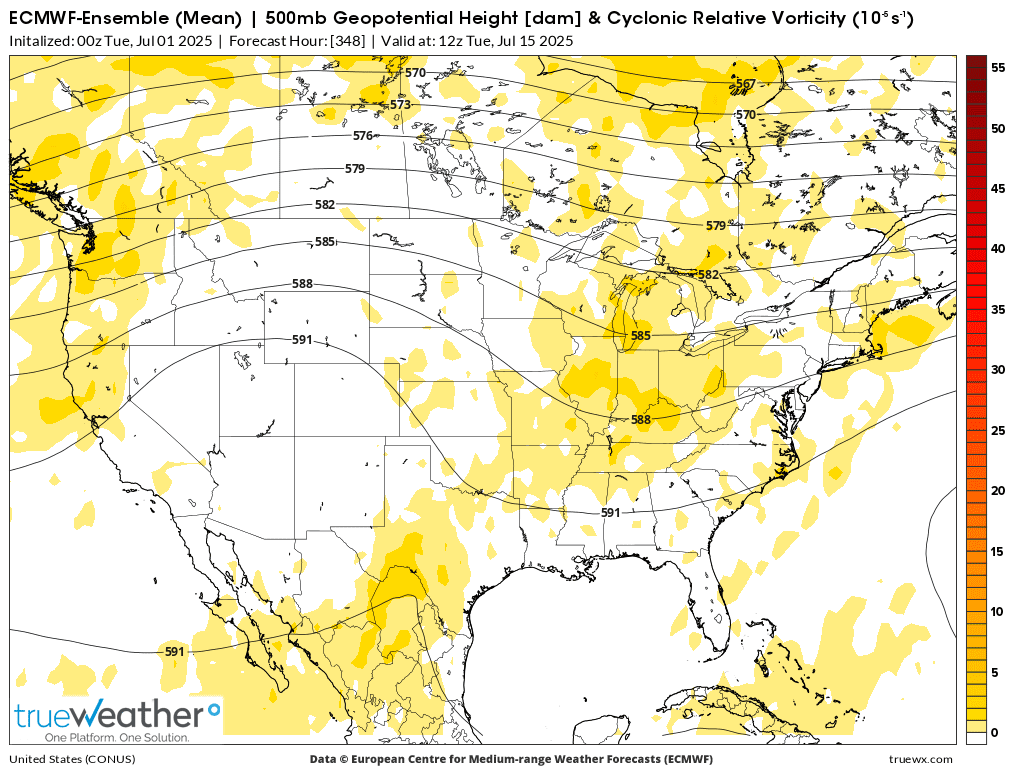
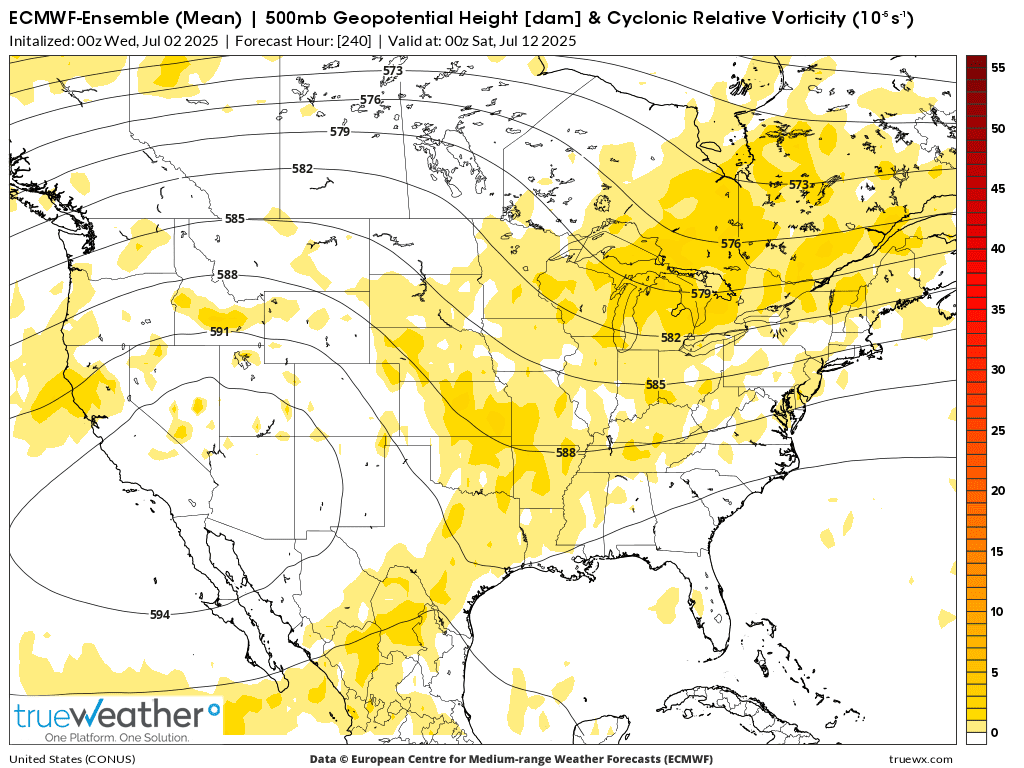
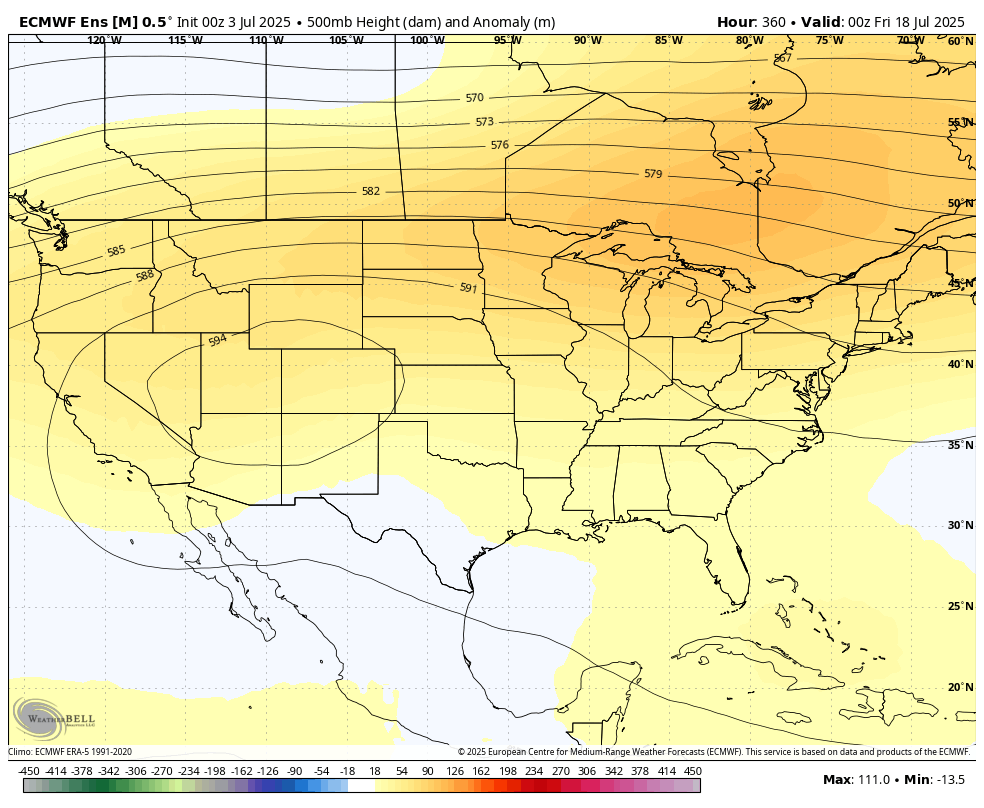
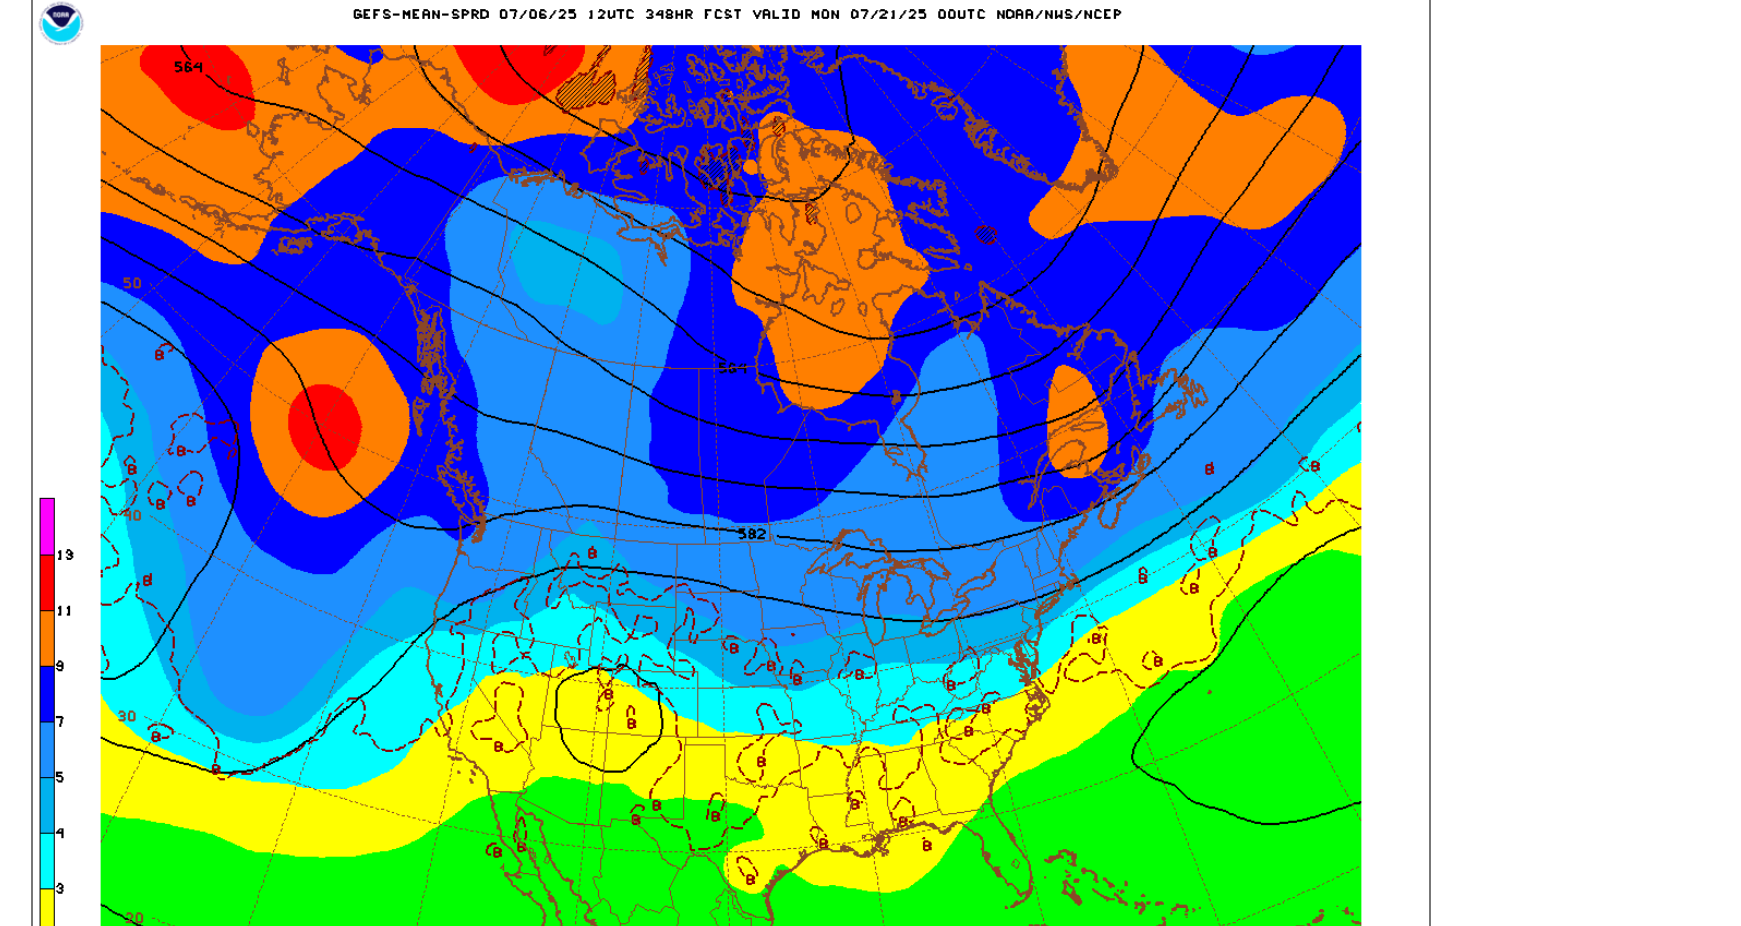
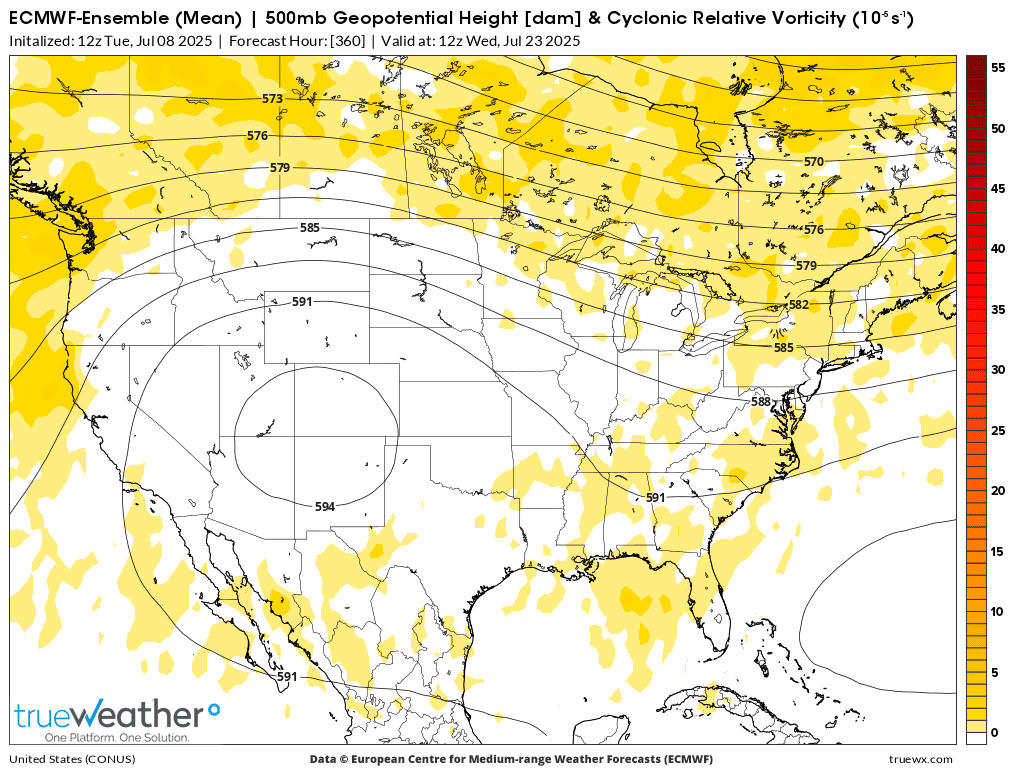
3. The heat ridge/dome backs up much farther west compared to last week. This was the last 500 mb map on July 15th from the last 0z EE. .........northwest flow in the Midwest which should feature active perturbations tracking around the periphery of the heat ridge in the Northern Rockies, then drop southeast and amplify in the positive tilted Great Lakes/Eastern Midwest to Western Gulf States trough.
4. Vorticity/spin in the atmosphere. This is what causes lift that leads to clouds/rain.
The 12z models were like night and day for rain.
The wettest, GEFS model was wetter with above average rain everywhere.
The driest model, EE was drier yet with below to much below rain everywhere. when back home, I’ll compare the markets reaction to the timing of market prices but it looks to me, that the late, complete recovery in the grains that were down modestly earlier in the morning might have been tied to that very dry 2 week solution on the EE model.
3pm ADDED: Looking at price charts, the recovery today was entirely from large specs jumping in to buy from the get go of the 8:30 am session! Price charts coming up.
i will say 1 thing with high confidence. If the very dry EE is completely correct, even with the forecast not as hot as last week…….THEN THE LOWS ARE IN FOR THE GRAINS!
If the wet GEFS is completely correct then we can make news lows from the crop getting closer to being made and not hurt that bleeds risk premium out as the calendar pages turn.
that risk premium gushes out in spurts and not X amount/day which might be the average over the growing season.
those spurts are usually timed with bearish rain forecasts and rain events……..before the actual rain falls. So it’s a sell the rumor type of function and buy the event if that event marks the end of a bearish pattern.
todays buying could be tied to this type of market mentality since we had so much rain recently, it was supposed to continue in July based on yesterdays maps.
The last EE is bullish enough to inspire solid speculative buying.
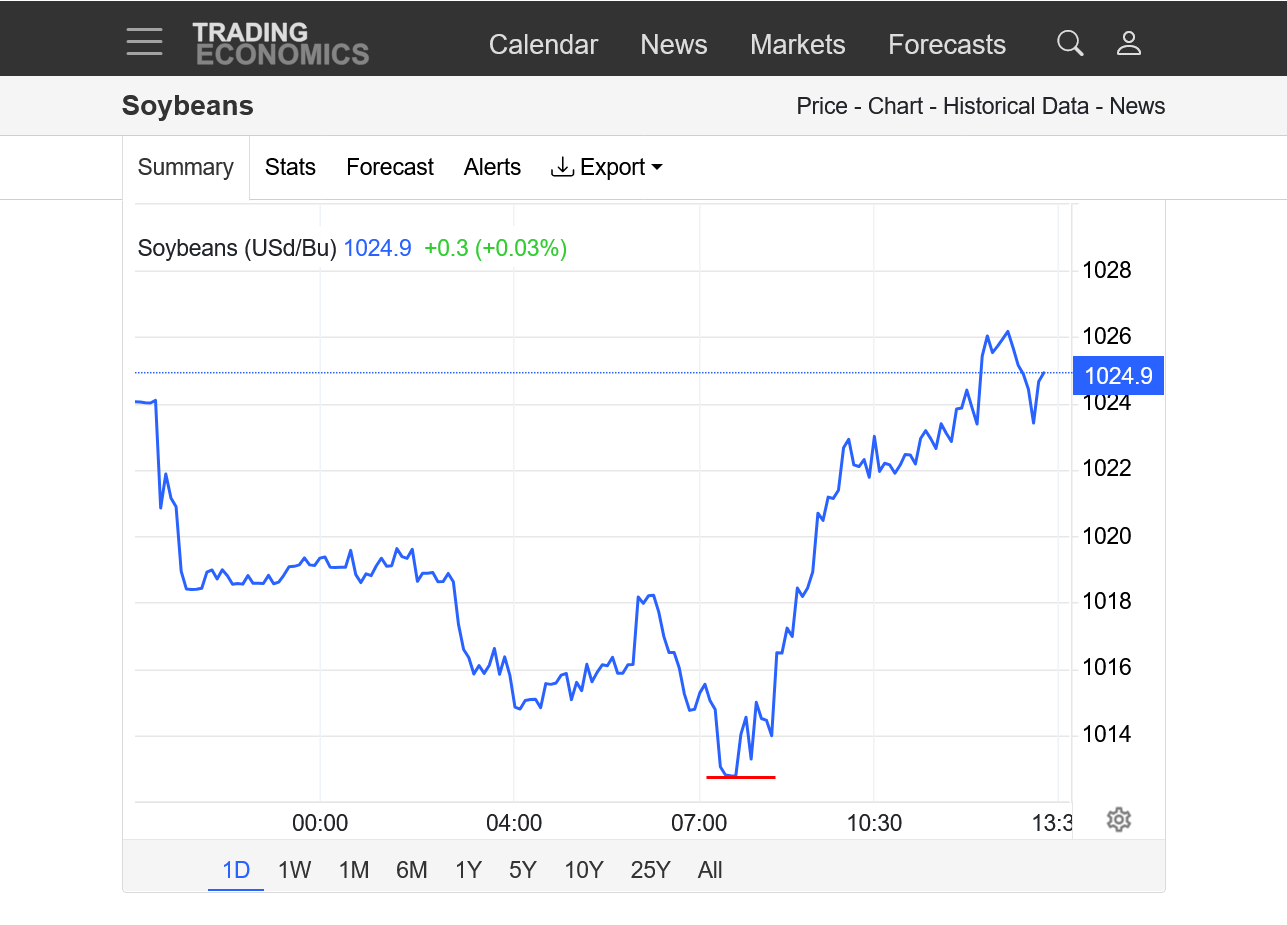
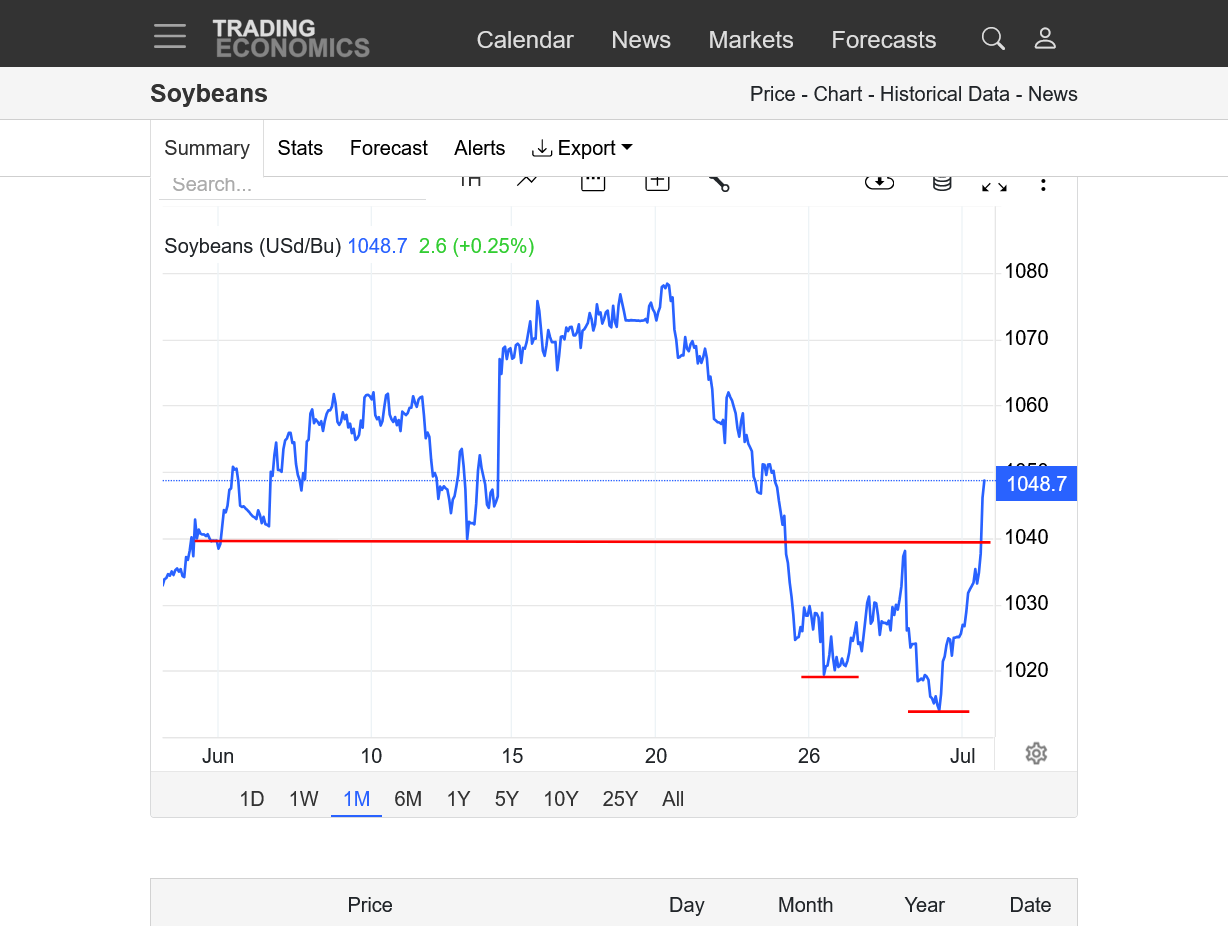
Beans:
https://tradingeconomics.com/commodity/soybeans
1. 1 day. Spike low from overnight pressure, followed by aggressive large spec buying all day right from the day session open. BULLISH HAMMER on candlestick chart! See below analysis.
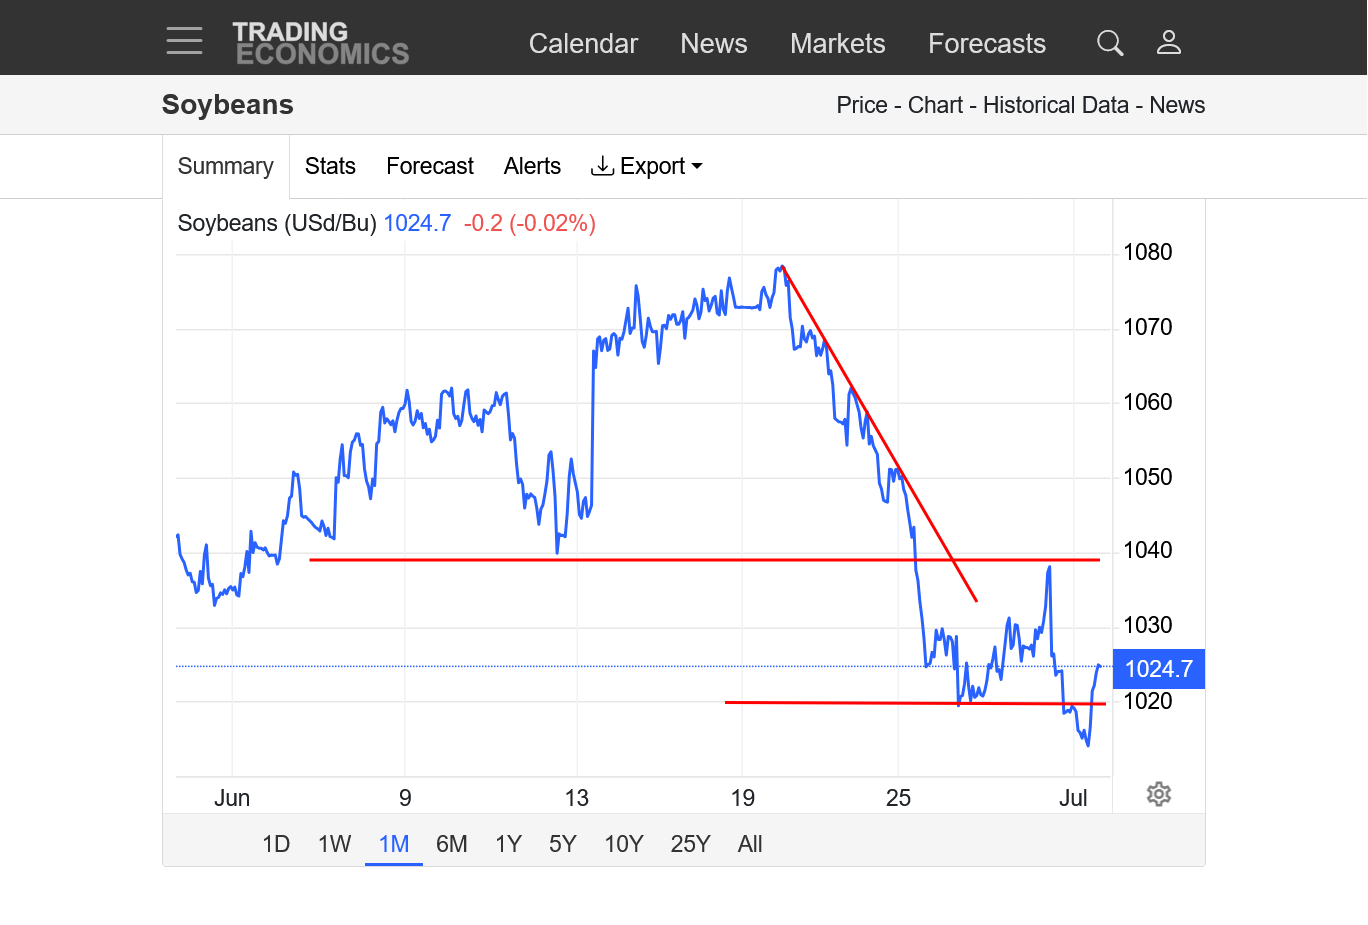
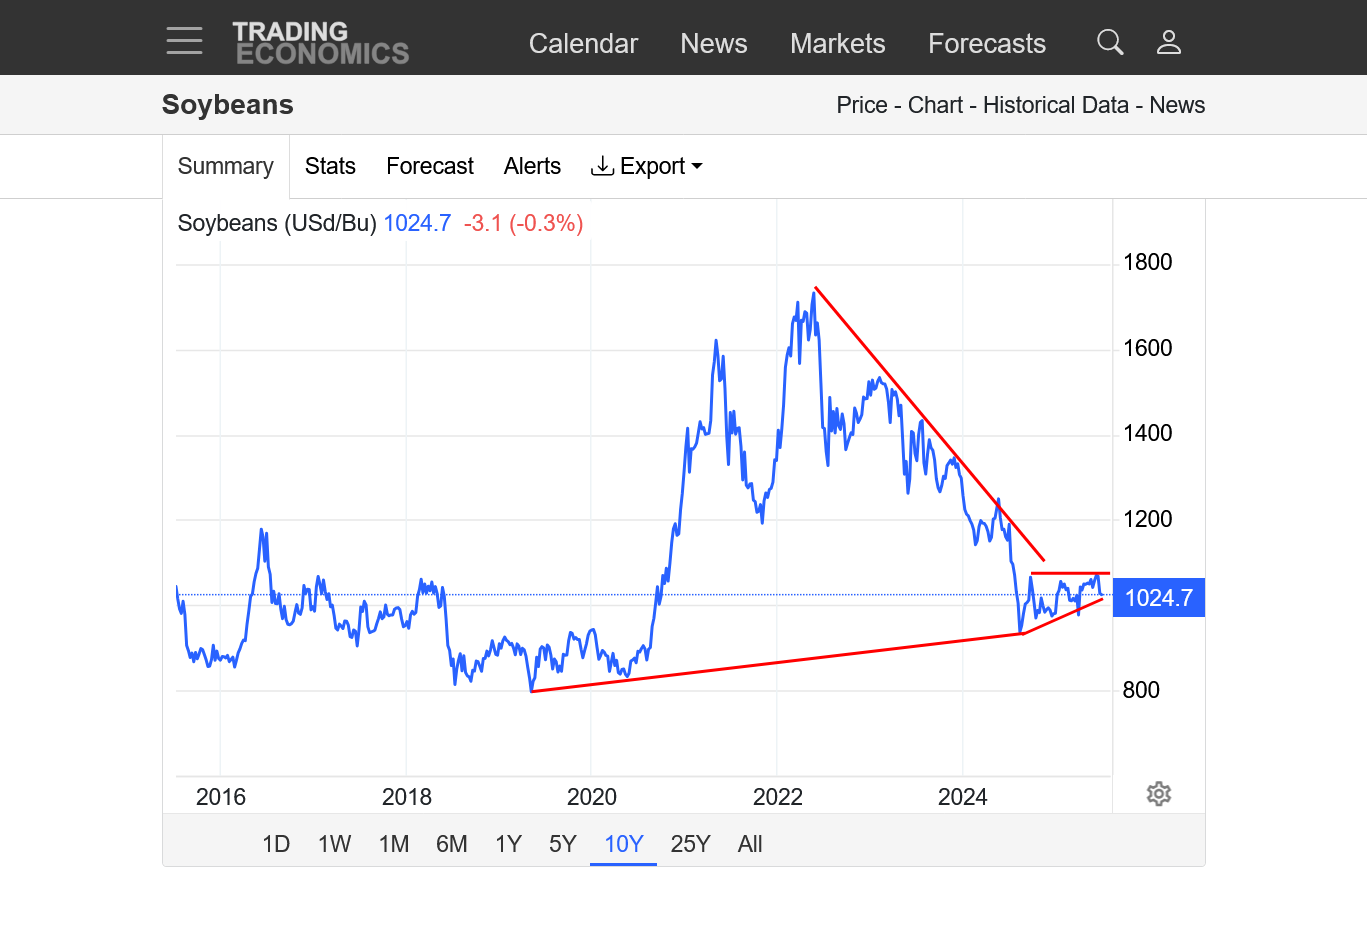
2. 1 month: 2 week downtrend the went thru 1040 support, then tested it as resistance before dropping more. We crashed thru 1020 support overnight but the fund buying(short covering) today caused us to close well above 1020 and near the highs and even a couple of ticks higher.
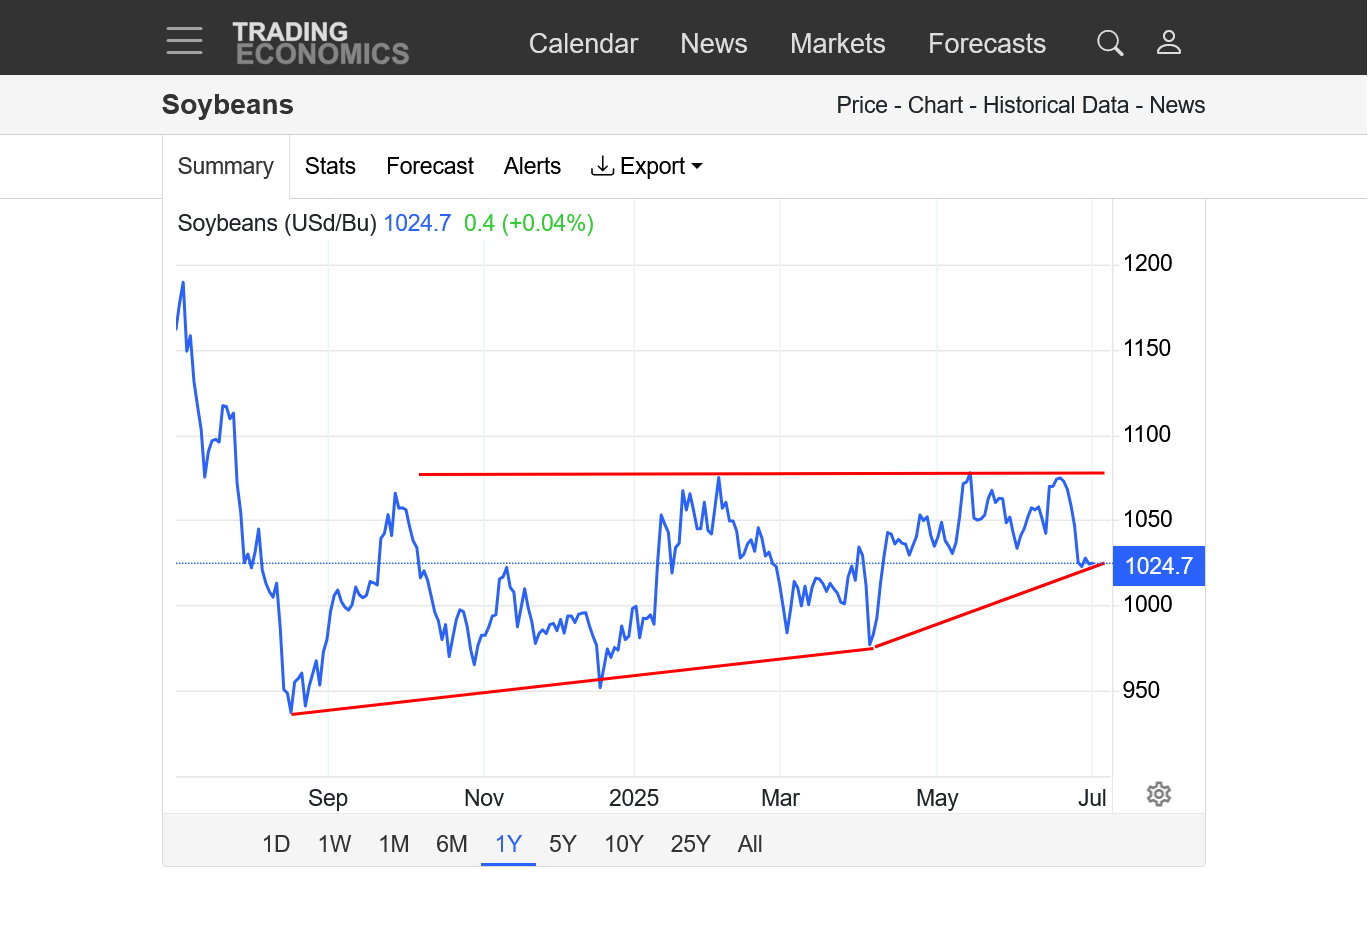
3. 1 year: Lows put in late Aug 2024 from the flash drought late in last years growing season that reduced final yields with horrible pod filling weather. Since then, a very modest up trend with slightly higher lows. Todays drop below, then back above 1020 support suggests the uptrend could be accelerating upward. If the drier European Ensemble solution is correct, then this is EXACTLY what is happening. Wetter weather will violate this bullish interpretation.
4. 10 years: Steep downtrend after the 1700 mega high in 2022. We've broken it with what could just be a pause and a bear flag OR it could be a major bottom.
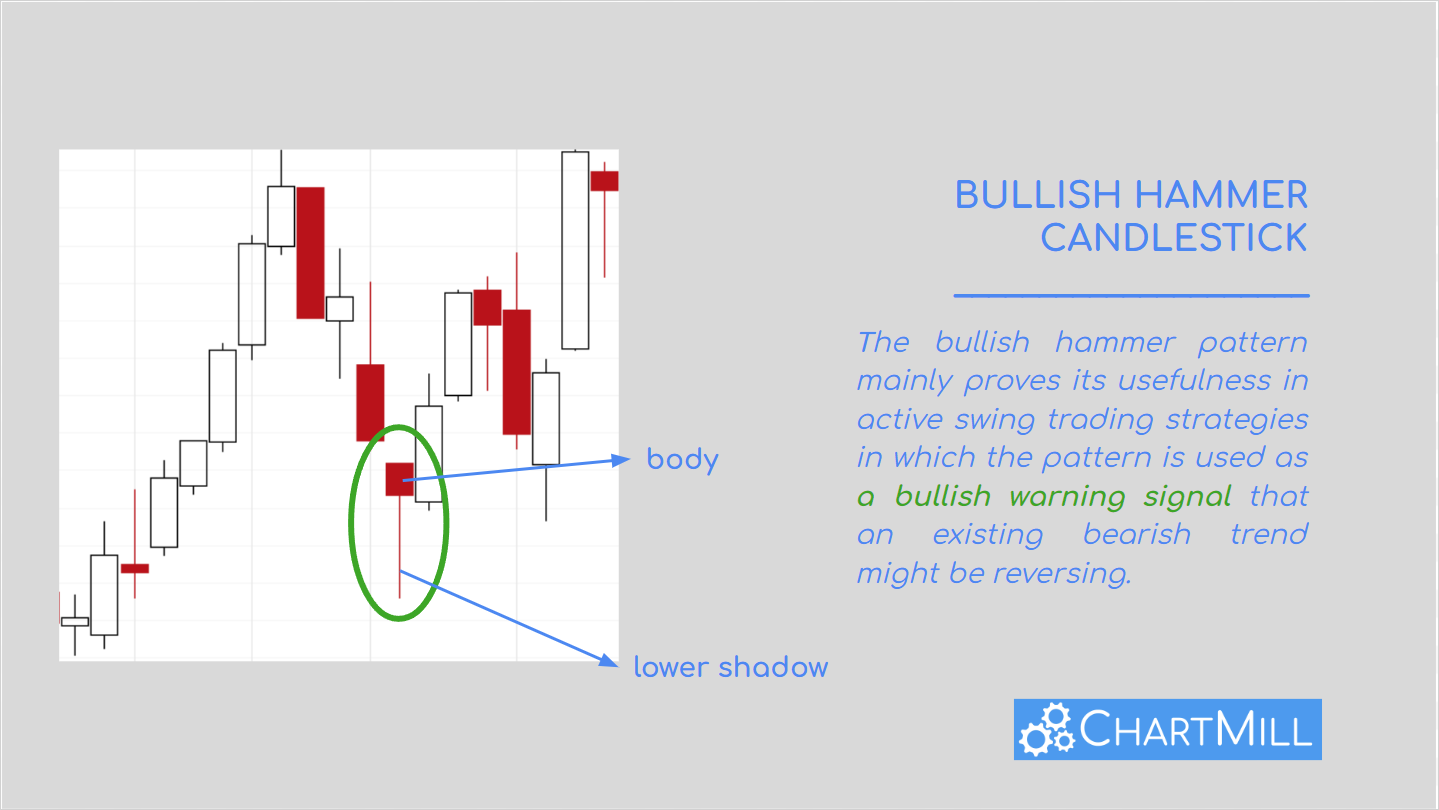
The reversal up from the overnight sell off that was especially strong in beans put in a bullish hammer type candlestick chart formation.
The candle has a small body at the top (difference between open and close) with a long shadow below it (from a spike low that was met with very strong buying)
Beans closed closer to the highs than corn and are A BIT MORE bullish here than corn.
This is a description of the pattern:
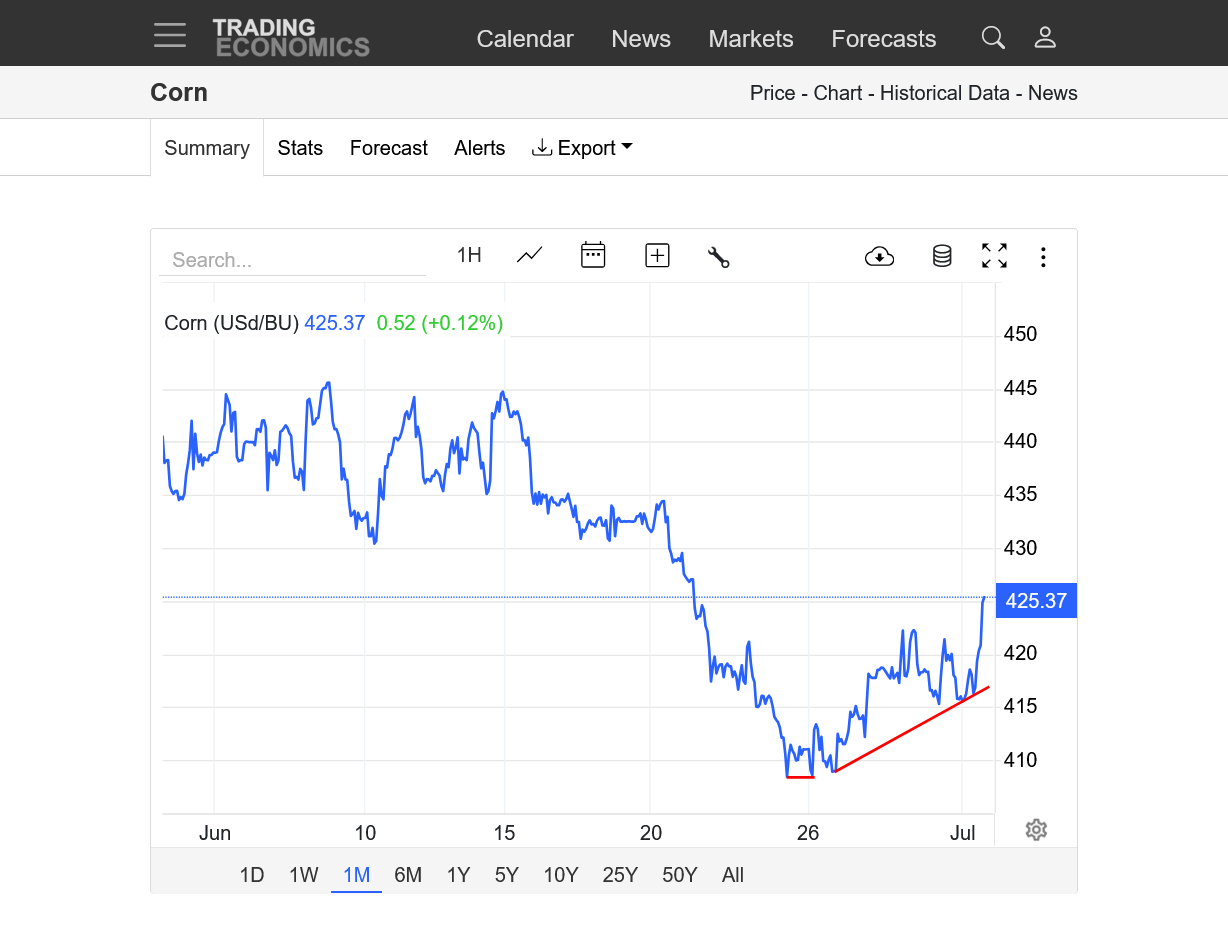
Corn:
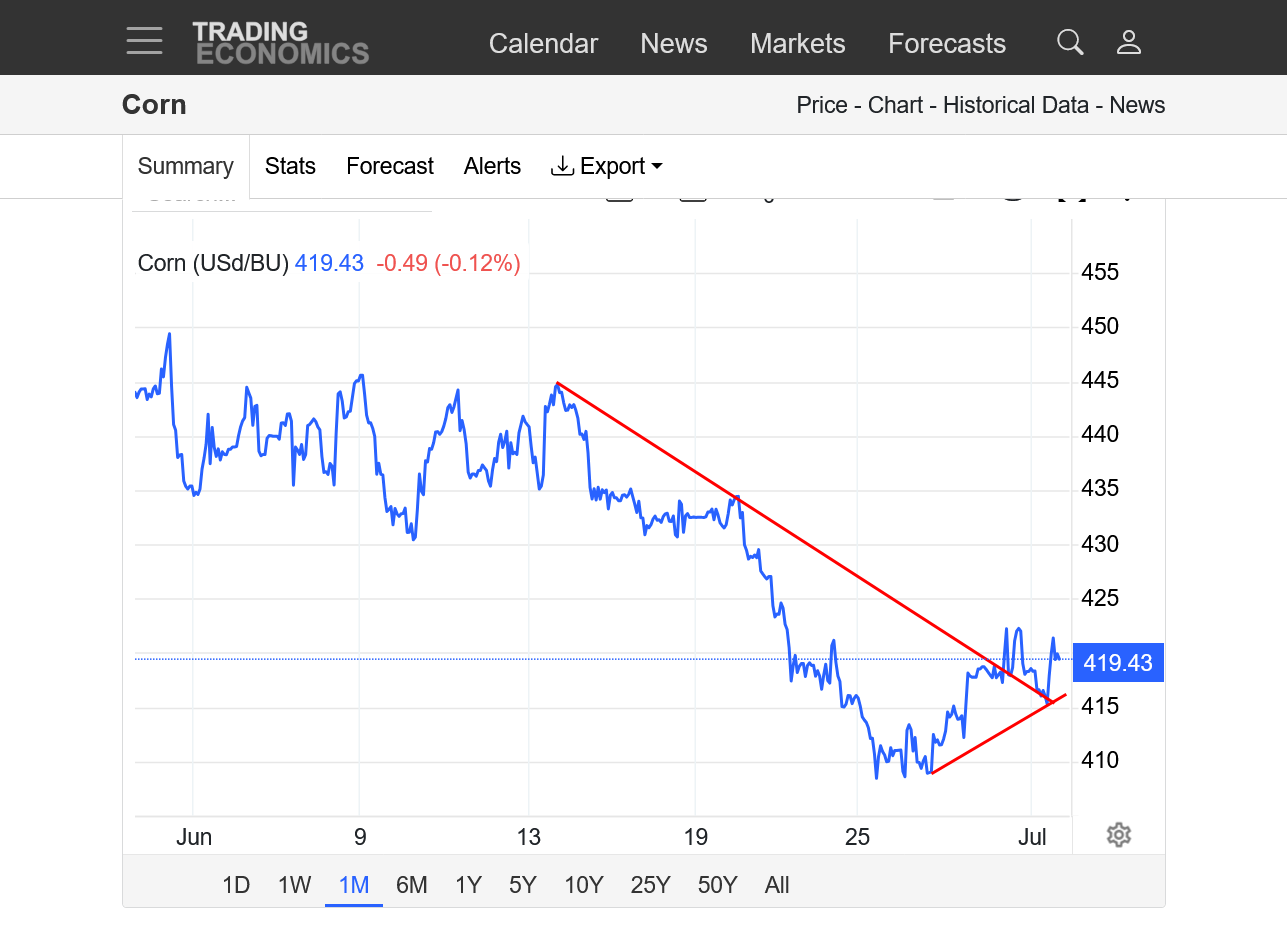
https://tradingeconomics.com/commodity/corn
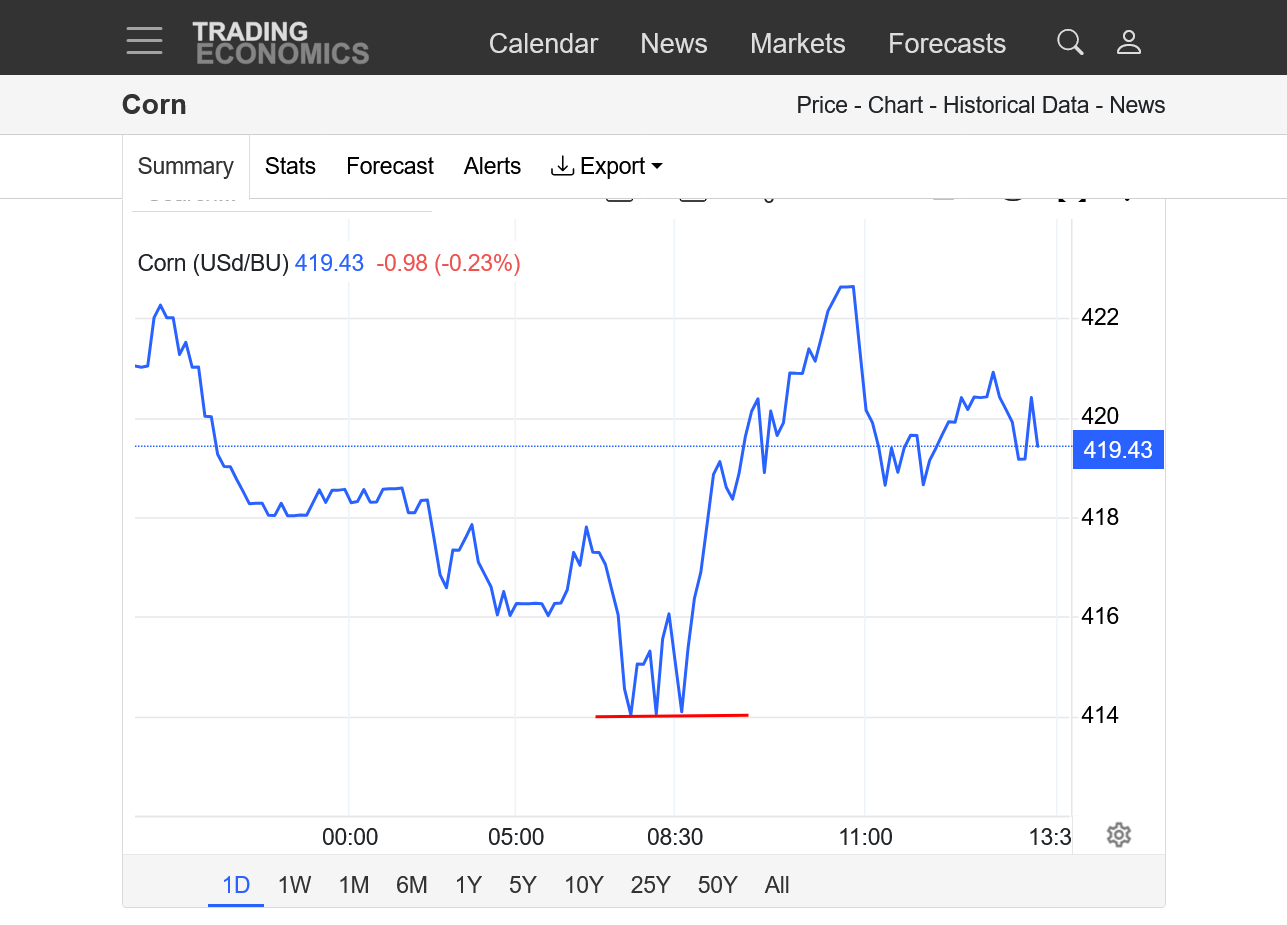
1. 1 day: Overnight selling reversed on the day open with large spec buying the first 2.5 hours
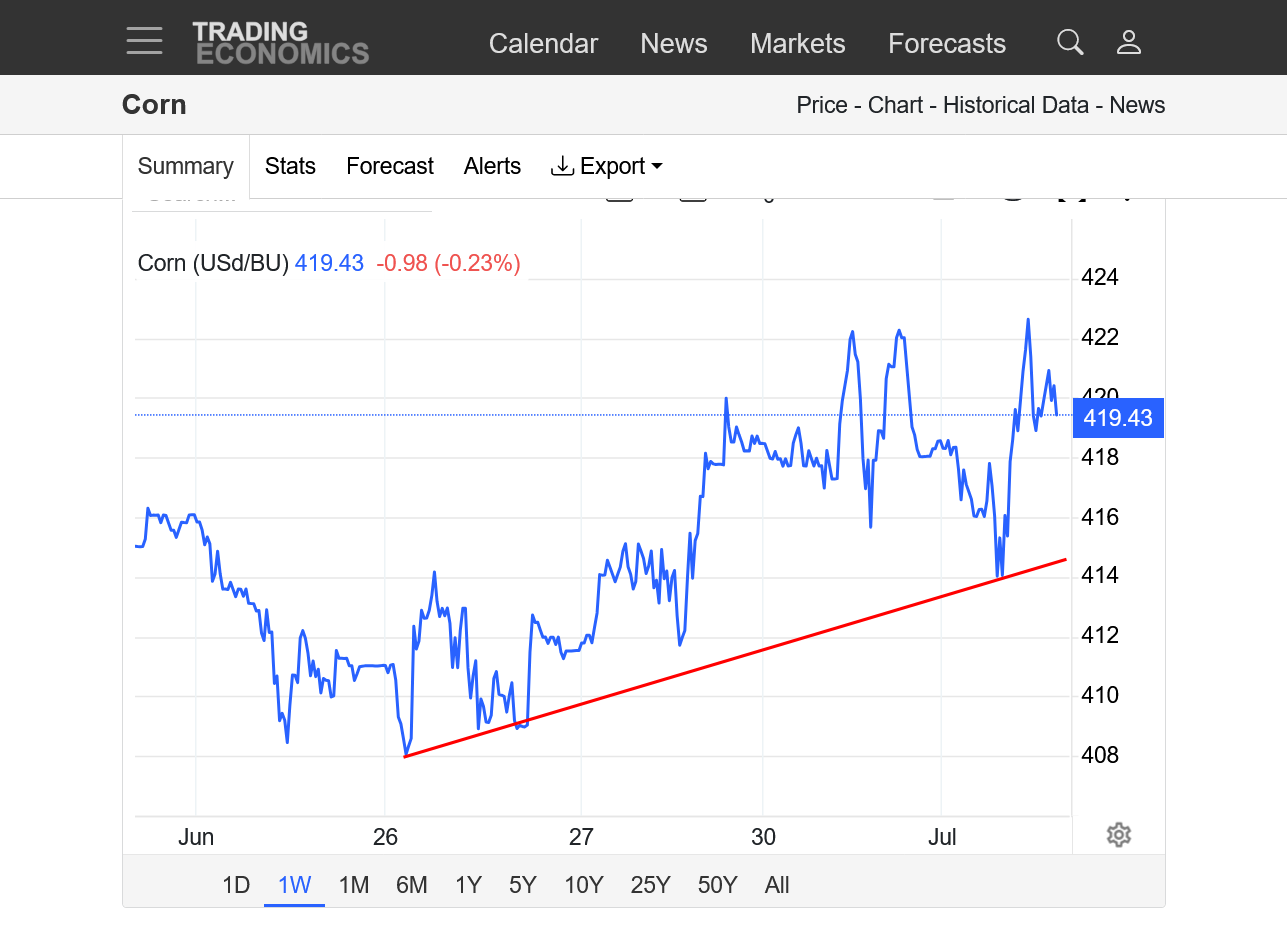
2. 1 week: Major low last week and new uptrend???
3. 1 month. Major low? Threatening to break out above the downtrend channel. Or is it a bear flag formation? The weather forecast will help decide.
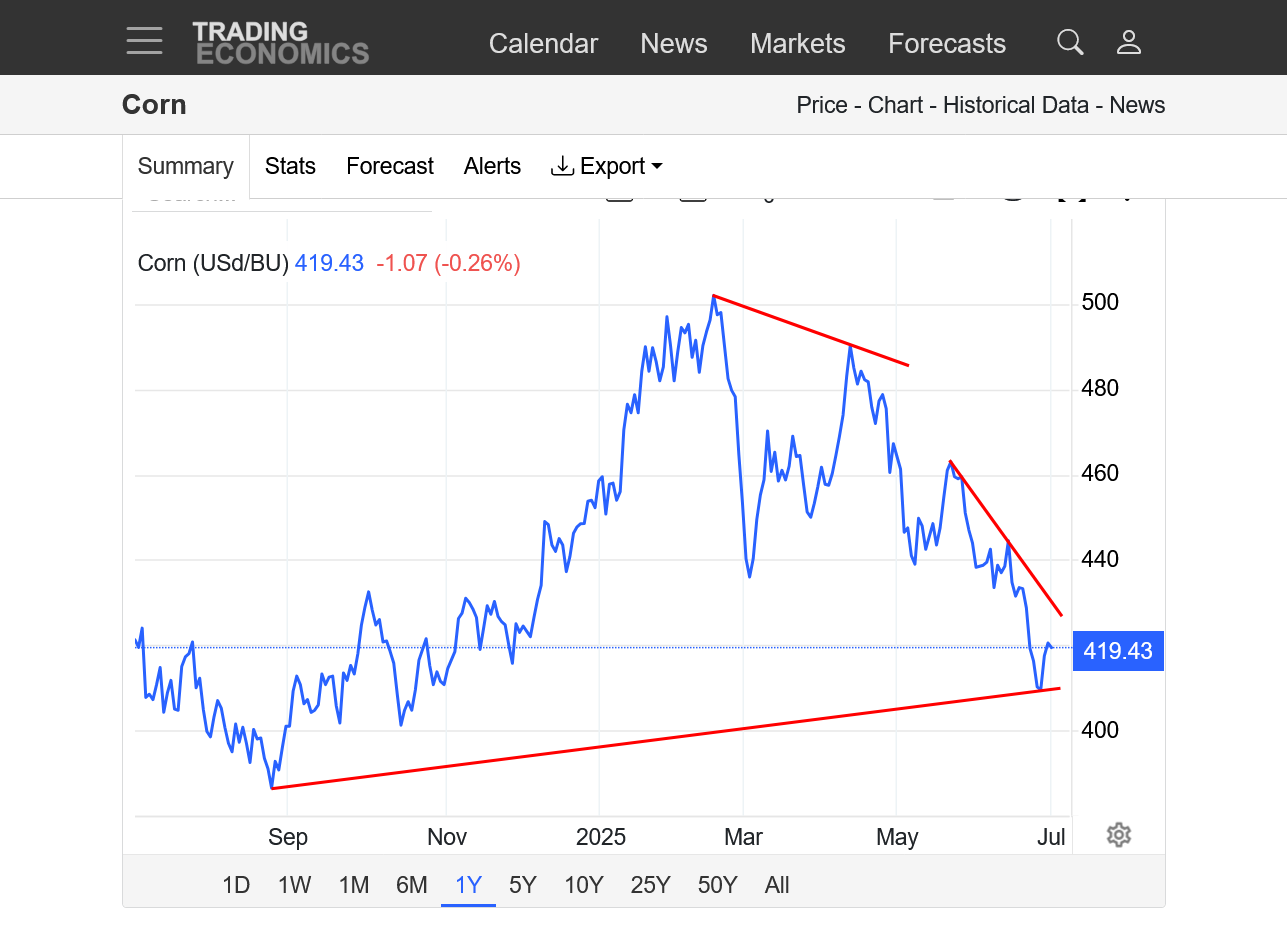
4. 1 year: Steepening downtrend since the Feb high. Still very bearish. However, did we just put in a bottom? Or will this just be another bear flag?
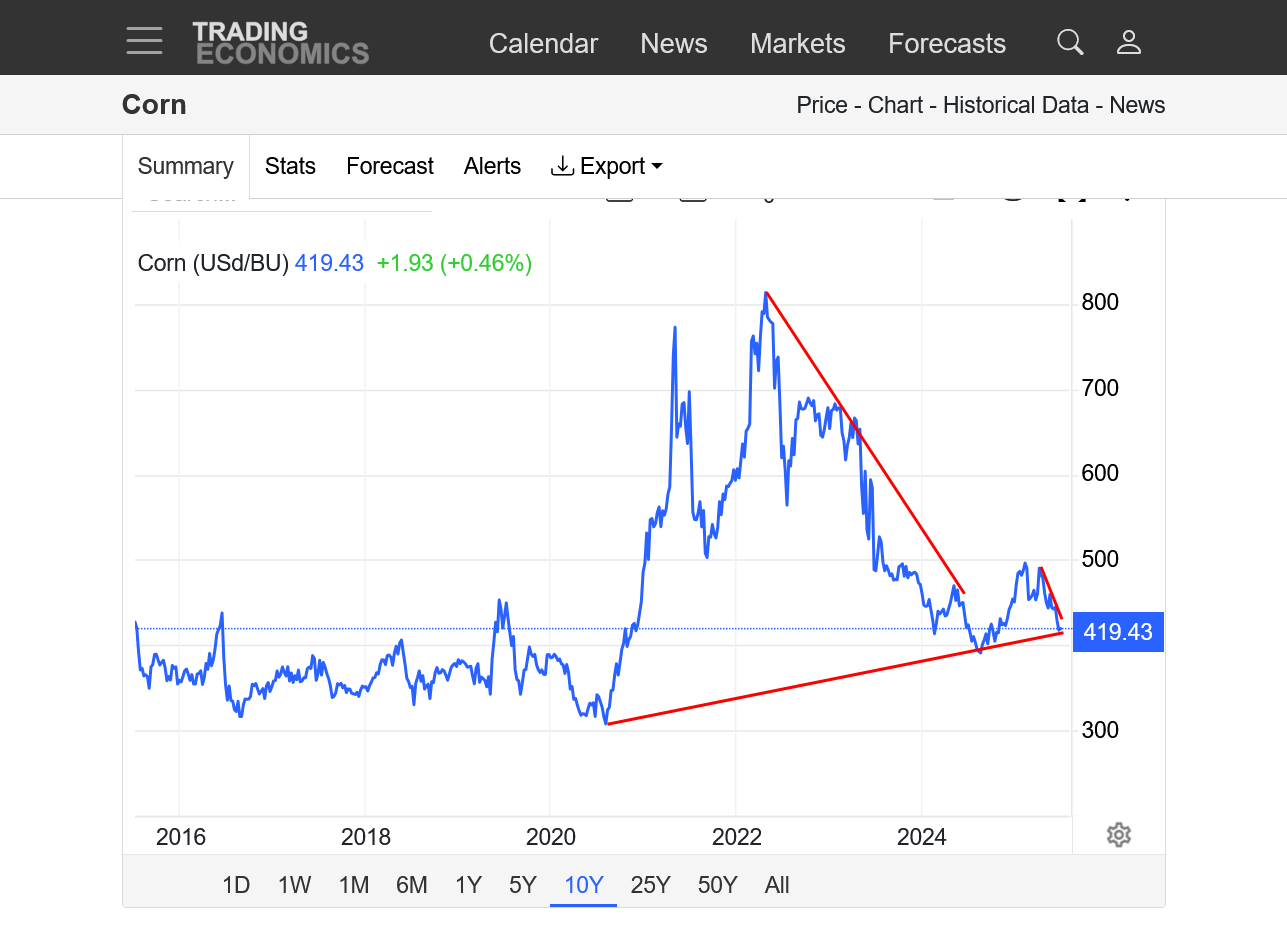
5. 10 years: Since the major high above $8 in 2022, a very steep down trend. We broke that with what could just be a bear flag formation. However, we held at a longer term uptrend line from a MAJOR COVID(2020) bottom. This uptrend with higher lows was touched first late last August because of the flash drought hurting late corn kernel fill and yields.
As always in a weather market, we can spend an hour doing a technical analysis similar to the last 2 pages on beans and corn..........and the overnight forecast weather models can change drastically and completely change many of the trend lines and interpretations.
This is exactly what happened to natural gas over the weekend/Monday. We went from looking extremely bullish on Friday to mega bearish on Sunday Night that continued today.
The last 18z GEFS has a bit more rain in it and after some heat this week, the week 2 forecast is average temps and even some below average. Pretty good for corn pollination. It MIGHT start heating up again in mid-July.
Total 16 day rains from the last GEFS:
1. Total rain
2. Departure from average rain
3. CDDs from the just out 18z GEFS for just the Midwest:
Still too much rain in the forecast to get more bullish, especially for corn with the temperatures dropping even more for favorable pollination.
7 Day Total precipitation below:
http://www.wpc.ncep.noaa.govcdx /qpf/p168i.gif?1530796126
+++++++++++++++++
1. Last 0z European Ensemble. More green than brown anomalies but the central, highest producing areas are brown.
2. The last 0z GEFS ADDED rains and is flat out BEARISH with the entire Cornbelt being great(above average rain)
3. CDDs for just the Midwest were -6 CDDs which is quite a bit cooler. It starts to warm up again late in the period but these are BEARISH additions to the forecast overnight.
4. This is the EE vorticity for day 10. Vorticity is spin in the atmosphere that causes lift which RESULTS IN RAIN. What has happened is that the weak, very positively tilted upper level trough has backed up even more overnight and instead of just northwest flow, with perturbations possibly hitting areas with rain, we have the upper level trough line backed up far enough to the west that there are even more favorable dynamics for rain imposed constantly that are enhanced even more when a perturbation hits. This is clearly bearish.
Corn is -2c and Beans are +5/6c. In strong weather markets, they both go in the same direction. There are other factors and the weather is actually more bearish for corn here with July weather being more important to corn than beans.
What will likely happen is that when we open at 8:30 am, it will be an entirely new ballgame. The large specs will be playing then and they could have a completely different idea than the overnight traders. Monday Night was a great example. Traders then were very bearish, leading to big price drops. Tuesday morning opened modestly/sharply lower from the overnight session and immediately found aggressive buying with the selling having been exhausted and we recovered all the losses in beans and much of the losses in corn before corn hit some selling to cap the bounce higher.
The markets WANT to go higher based on how they reacted yesterday in STRONGLY rejecting lower prices and a European model that gave traders some bullish ammo.
The overnight changes in the weather were clearly bearish, so it doesn't give traders and traction for buying from just this weather. Many traders may also be waiting until after the long 3 day holiday coming up. This holiday probably features the biggest impactful weather changes of any for corn and beans.
My biggest loss ever was from being long 100 beans and 200 corn over this long July 4th weekend 20 years ago. I got spooked from the -$286,000 draw down during the overnight session when we opened back up and sold/covered at the exact low for July and for the Summer............then we went straight up the rest of the month. Holding on would have resulted in a profit of over 1 million but I could never make myself buy as we continued to go higher and higher from the weather I bought just 1 trading session too early!!!
Previously, I would have been able to put that loss behind me and jump back in to buy as if that loss never happened. This is what you MUST DO to be do successful trading on a consistent basis. But that one devastated my psyche all month from watching the market go up and kicking myself as a calculated how much money I didn't make every single day!!!
I should have been buying..........exactly when I sold to cover my big long position. Biggest mistake based on emotions of my career. The position might have been too big but that's how I turned a 2k account into a 600k account in a decade, starting in 1992.
So the point here is that the weather models can change a great deal over any weekend in the Summer. When you add a day and make it a 3 day weekend, it increases the potential changes and it means the opening price after the weekend WILL NOT BE EVEN CLOSE TO WHERE WE CLOSED BEFORE THE WEEKEND. So you MIGHT want to keep your risk lower on position trades over this particular weekend.
On the other hand, taking risk is absolutely needed to make money. The greater the risk...........the bigger the profits when you ARE RIGHT!!!! The key is to be right most of the time and make smart entry points.
Usually, that should minimize sizable draw downs. If you are RIGHT with the timing of an entry, the market will almost always respond positively in short order.
7am: Corn is -4c but beans are +5c. We may be seeing spreads with buying beans and selling corn, especially with this weather being most bearish the corn and August weather being more important for beans.
By metmike - July 2, 2025, 7:21 a.m.
What will likely happen is that when we open at 8:30 am, it will be an entirely new ballgame. The large specs will be playing then and they could have a completely different idea than the overnight traders. Monday Night was a great example. Traders then were very bearish, leading to big price drops. Tuesday morning opened modestly/sharply lower from the overnight session and immediately found aggressive buying with the selling having been exhausted and we recovered all the losses in beans and much of the losses in corn before corn hit some selling to cap the bounce higher.
The markets WANT to go higher based on how they reacted yesterday in STRONGLY rejecting lower prices and a European model that gave traders some bullish ammo.
+++++++++++++
The exact same thing happened this morning that happened Tuesday morning!
BEANS:
https://tradingeconomics.com/commodity/soybeans
CORN:
https://tradingeconomics.com/commodity/corn
1. The NWS 7 day forecast is BEARISH!
2. The NWS 6-10 day is BEARISH!
3. The NWS 8-14 day is BEARISH!
4. All the weather here: https://www.marketforum.com/forum/topic/83844/
7 Day Total precipitation below:
http://www.wpc.ncep.noaa.govcdx /qpf/p168i.gif?1530796126
https://www.marketforum.com/forum/topic/83844/#83852
But the corn and beans won't drop anymore, even with BEARISH weather news. Yesterday gave us the big clue. On Tuesday's open, the large specs emphatically rejected lower prices with an apparent selling exhaustion from all the traders who wanted to be short on bearish weather, already in the market and very little FRESH selling to offset all the buying. That put in the hammer, reversal up candle formation that we showed you yesterday.
The reversal up from the overnight sell off that was especially strong in beans put in a bullish hammer type candlestick chart formation.
The candle has a small body at the top (difference between open and close) with a long shadow below it (from a spike low that was met with very strong buying)
Beans closed closer to the highs than corn and are A BIT MORE bullish here than corn.
This is a description of the pattern again:
Re: Re: Re: USDA June 30, 2025
By metmike - July 1, 2025, 4:03 p.m.

https://www.youtube.com/watch?v=lDm21j410B8
1. This was the just updated late afternoon longer range European model rain departure forecast for july.
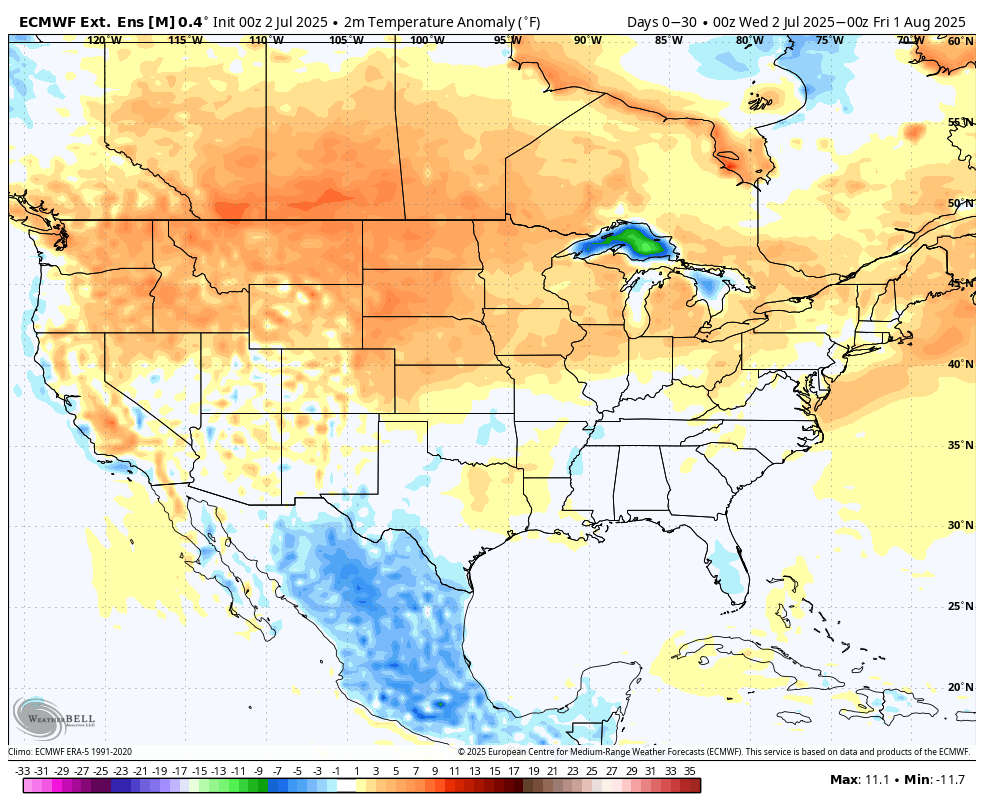
2. This is the temperature forecast, departure from average.
It's basically the only weather forecast product that I can find that looks pretty bullish for the grains.
If the latest forecasts for tons of rain and cooler temps next week verify, I feel that this will just look like a bear flag, short covering bounce and prices will plunge next week. Funds have huge shorts on right now that are making the market vulnerable to short covering. They are not willing to get even more short and have more at risk at these levels with the long weekend coming up that sometimes results in a weather pattern change.
If July DID turn hot and dry, the current massive fund short would be sitting ducks when the market had upward surges from bullish weather. Just look how the market has been acting the last 2 days without much help from the weather forecast!
Anyway, this may just be a sell the fact ahead of the last round of huge rains and buying the fact after they fell.........with the market waiting for the next round of widespread rains.
Despite the very bearish 2 week forecasts from all the models, the Pacific Ocean temperatures still favor heat, especially in the northwest half of the belt and also drier than average. Similar to the above but the above outlook spreads that pattern much farther east.
Not a great deal of change. However, it looks like we will start heating up again, especially later in week 2 which will bring on "heat fill" for the corn crop after pollination from rapidly accumulating GDDs and accelerated maturity that reduces the time the plant fills kernels which also reduces the amount of sugars/carbohydrates pumped into the kernels, which reduces kernel size and yield. Even with ample moisture. It's even worse with dry soils.
Here's our best thread for explaining and illustrating this principle:
HeatFill for Corn
Started by metmike - July 14, 2023, 2:47 p.m.
https://www.marketforum.com/forum/topic/97257/
++++++++++
These were the CDDs for JUST THE MIDWEST for the last 4 runs of the GEFS. The just out 6z GEFS is in purple on the right. The major heat in the 2nd half of July WILL BE in the WCB/Plains and Upper Midwest. 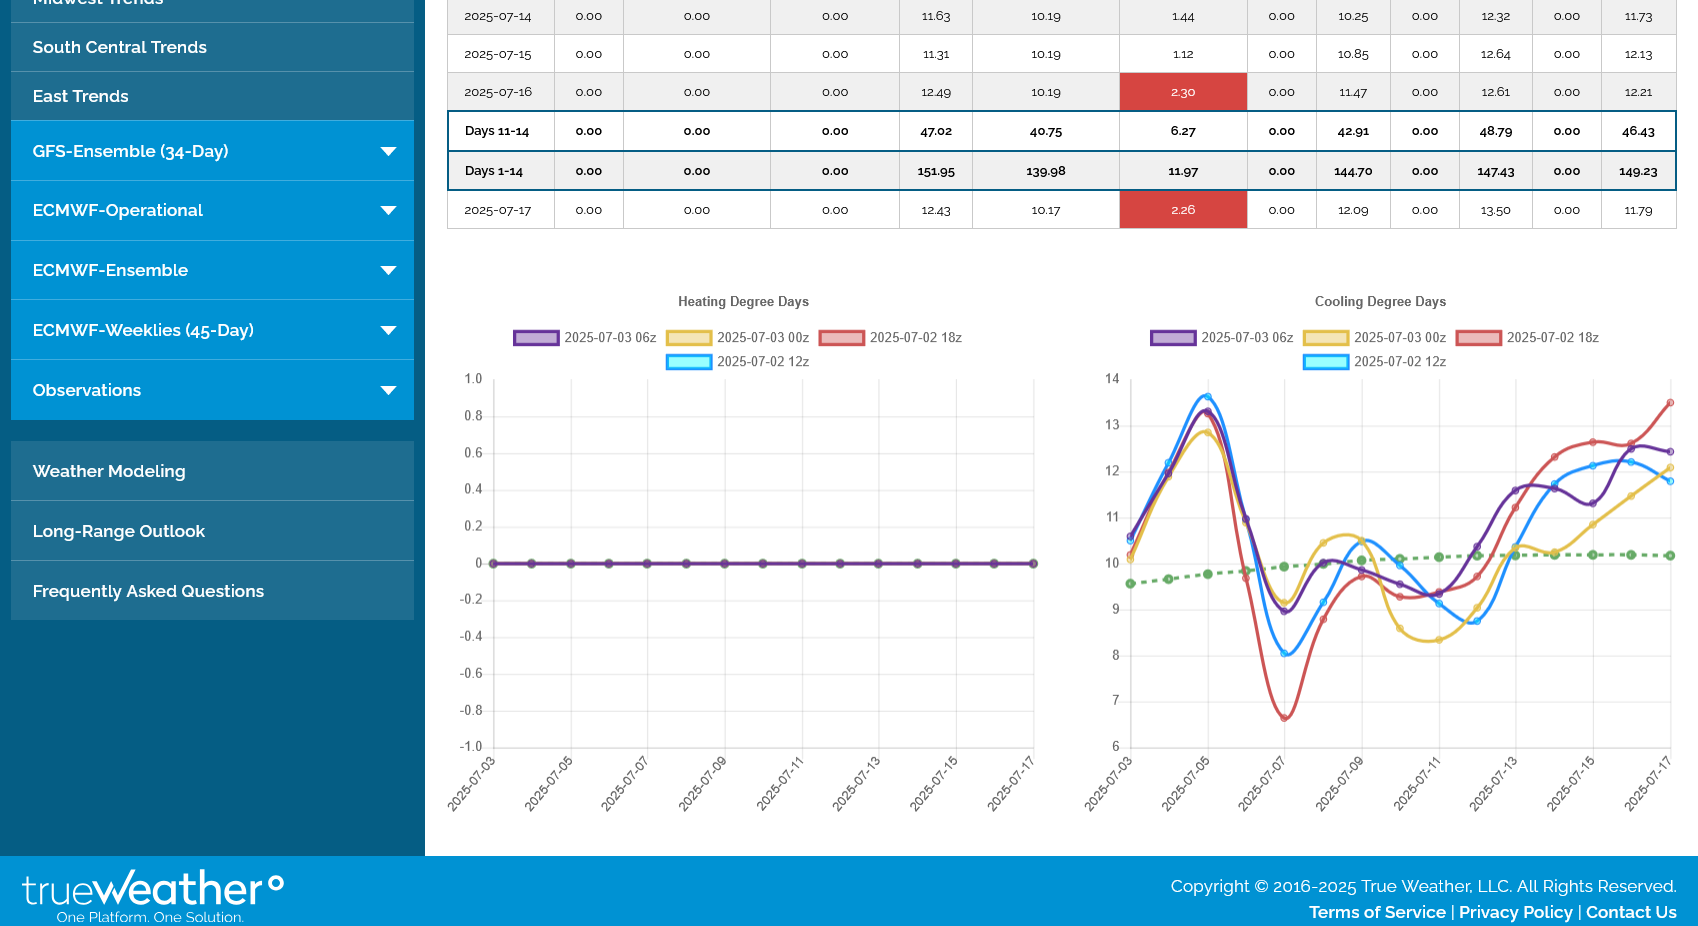
+++++++++++++++++++++++++++++++
7: 53 am: Will the large specs be interested in huge short covering during the say session for the 3rd day in a row?
This might be what we are facing next week when we open on Sunday Night and rain makes grain in July:
7 Day Total precipitation below:
http://www.wpc.ncep.noaa.govcdx /qpf/p168i.gif?1530796126
++++++++++++++++
1. This was the last 0z EE model 2 week rain anomaly forecast
2. Below that, the last 6z GEFS rain forecast. If this is right, the price at the end of next week will very likely be lower than where we start Sunday Night..........except for #3.
3. The upper level ridge from the last 0z EE model IS THREATENING on July 17th. This is potentially very bullish for the 2nd half of July!
Thanks for the timely weather updates ! Would like to price more new crop grain. Will be watching your comments.
YW!
I'll do my best for you bowyer!
I wish prices were much higher and that you could earn more for your hard work and enormous risk but we greatly appreciate our food producers.
We're 2+ days away from the markets opening again, so the Friday outlook means nothing.
This was the just updated NWS weeks 3-4 outlook. I agree with the temperatures but would add even more heat in the N.Plains/Upper Midwest and extend the below rains much farther southeast, covering at least the northwest 50% of the Cornbelt. That would be bullish weather for the 2nd half of July.
https://www.cpc.ncep.noaa.gov/products/predictions/WK34/
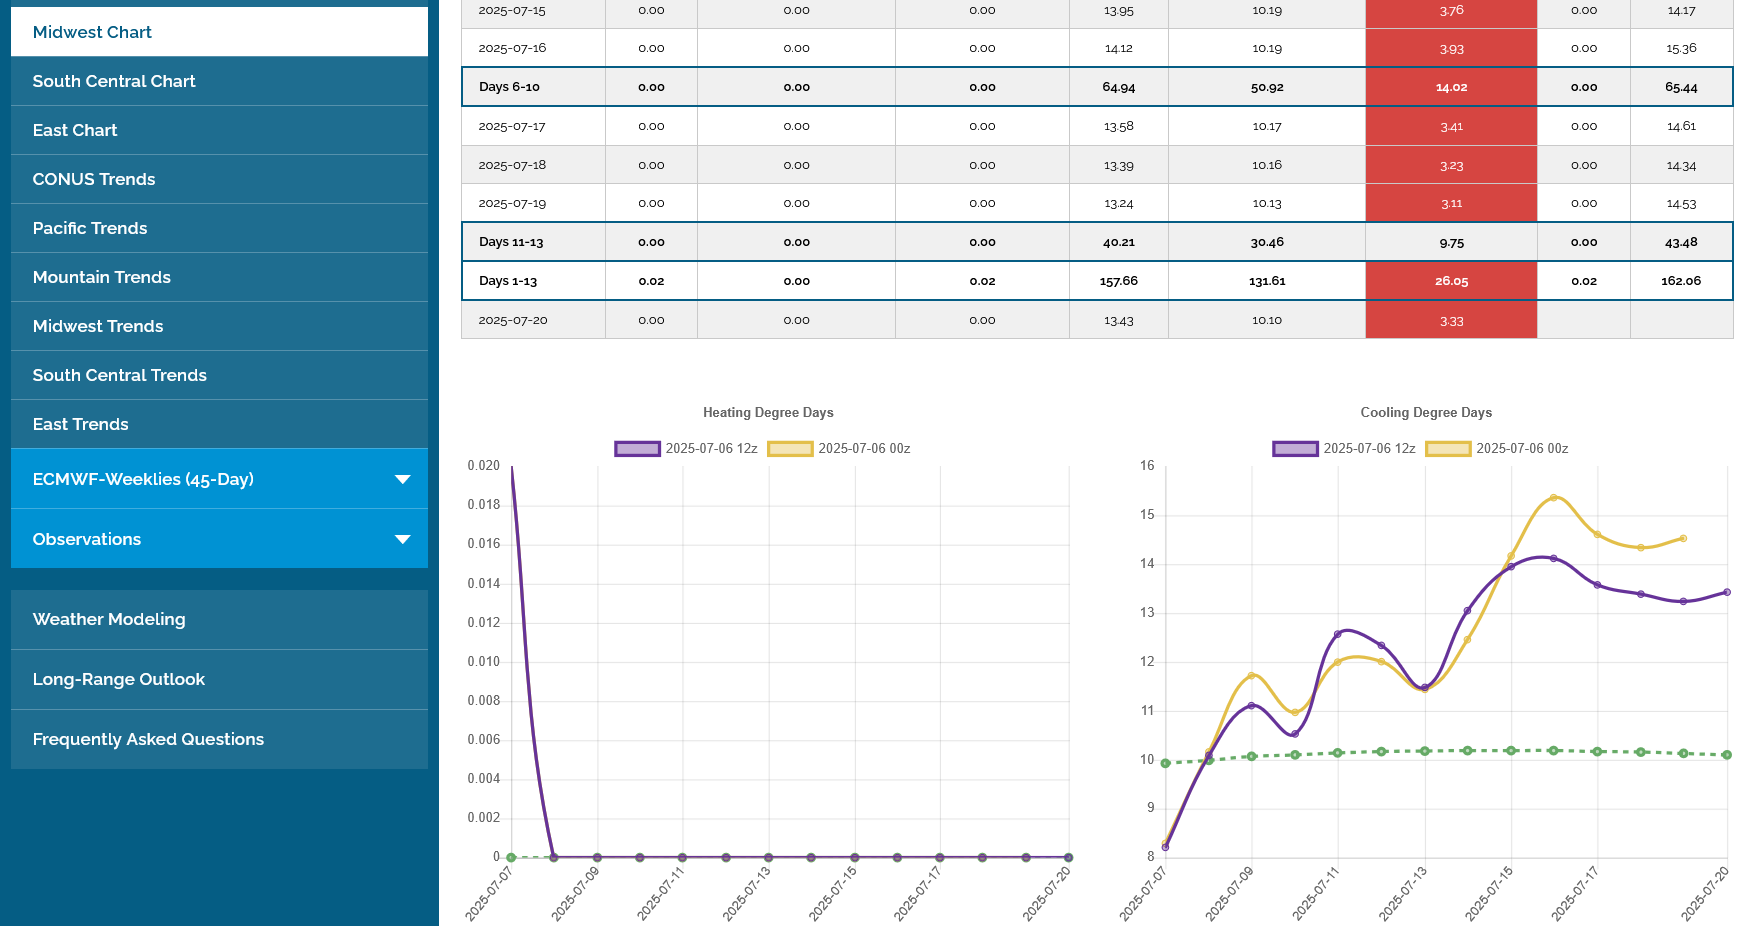
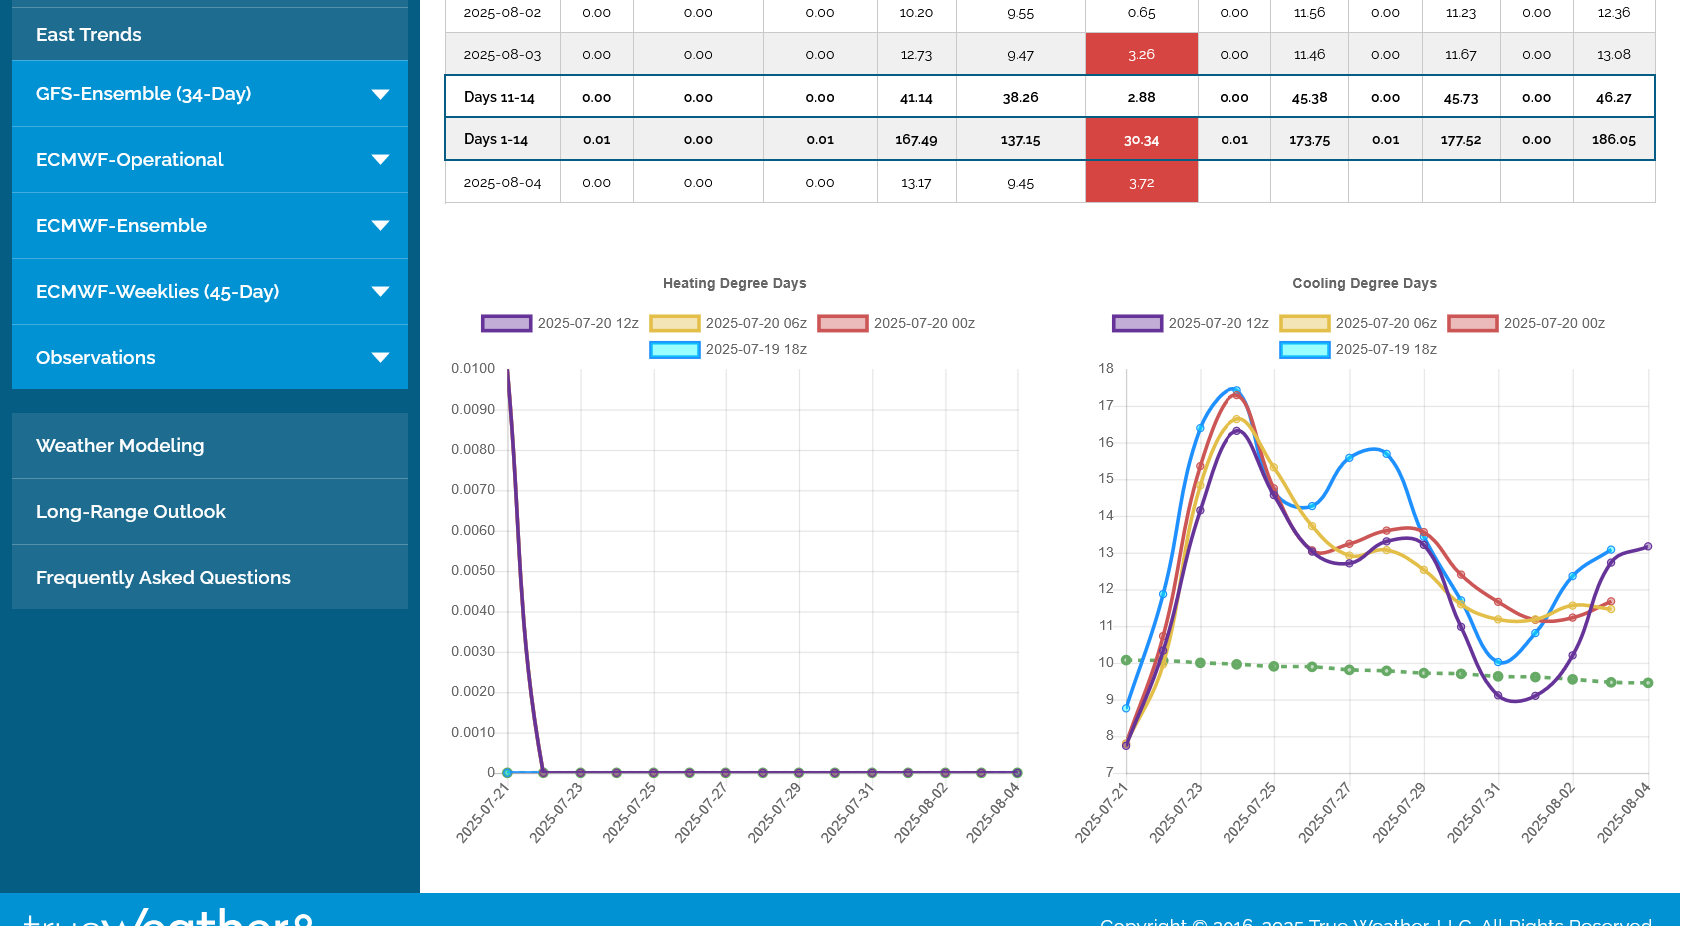
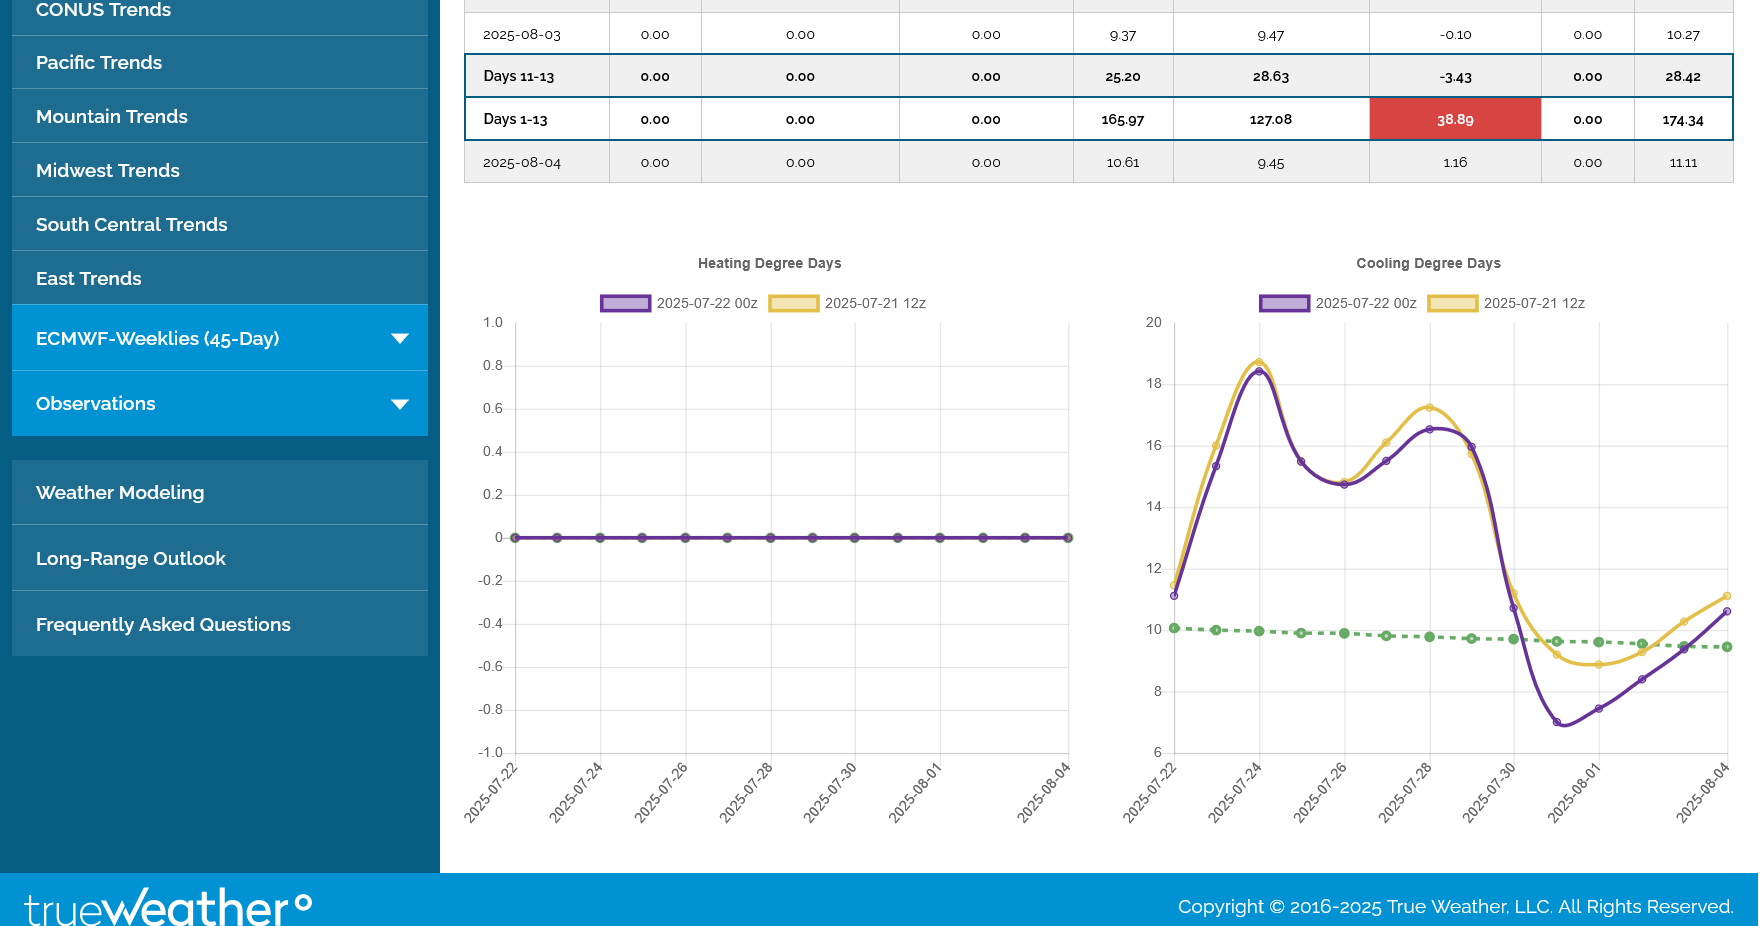
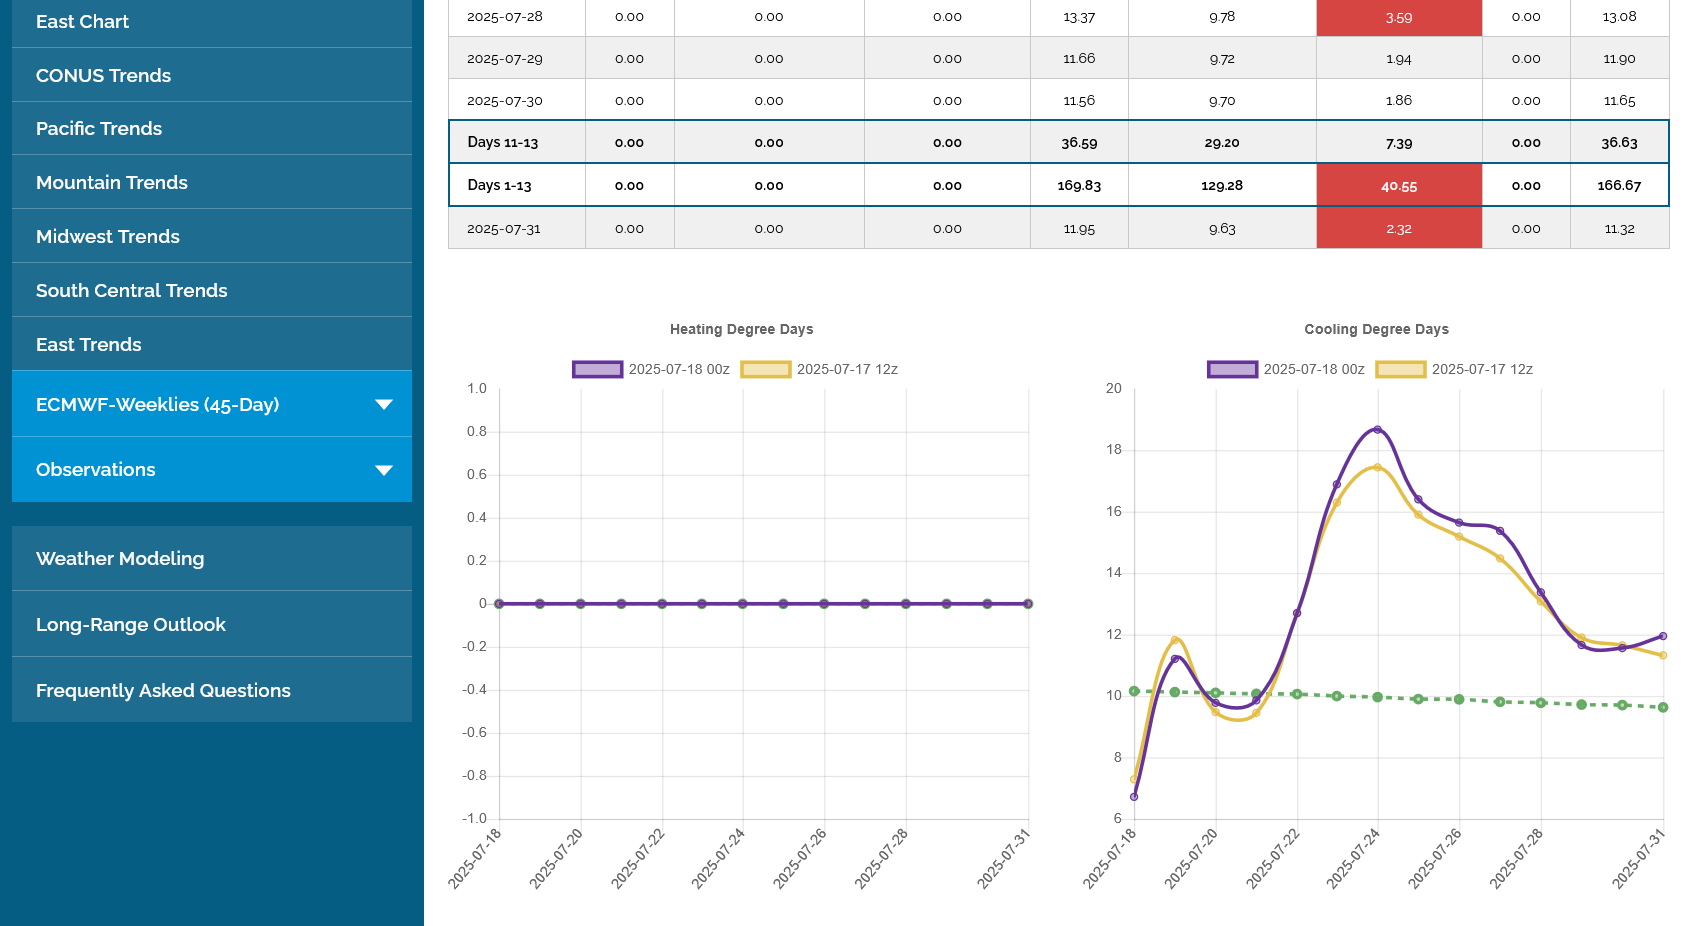
This is the forecast for CDDs for just the Midwest from the just out 12z European Ensemble model the next 2 weeks.
Very elevated during the 2nd half of week 2 which equates to well above average temperatures.
The seasonal/climatological peak in temperatures is seen with the dashed green line leveling off in mid July.
Sorry for the delay. We were in Louisville for our 9th grade grandson's basketball tournament and I've been trying to catch up today.
The tricky thing was the fact that Friday and Saturday actually looked very bullish with the heat dome spreading across the Midwest to East...........that changed overnight and now the forecasts look LESS bullish here on Sunday as evidenced with the modestly/sharply lower prices to start the new trading week.
The heat ridge has shifted much farther west to the Southern Rockies with a weak upper level trough from the Great Lakes to Northeast keeping the most intense heat farther west, from the Rockies, spilling into the N. Plains.
1. Here are the CDDs from the last 12z European Model Ensemble for just the Midwest. It's going to get HOT for sure but the heat is tapering off during the last 5 days in purple compared to the previous 0z run in tan.
2. Upper level map in 2 weeks, on july 20th. Upper level ridge centered in the S.Rockies, extending north from the last 12z GEFS model. Very weak troughing in the Great Lakes/Northeast.
The biggest thing right now is that we have frequent rain events happening this week.
https://www.marketforum.com/forum/topic/83844/#83848
7 Day Total precipitation below:
http://www.wpc.ncep.noaa.govcdx /qpf/p168i.gif?1530796126
All the weather:
https://www.marketforum.com/forum/topic/83844/
+++++++++++++++++++
However, in week 2 the forecast should turn drier and be pretty hot still. The problem is that it also features the heat ridge in the Southwest US and NOT over any part of the Cornbelt.
To get bullish we need the heat ridge to get positioned at least 600 miles farther northeast, preferably more like 800+ miles northeast of the current forecast.
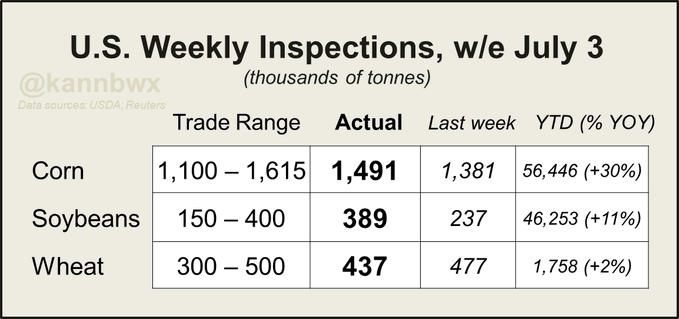
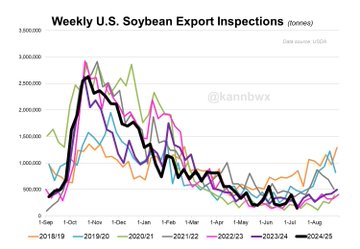
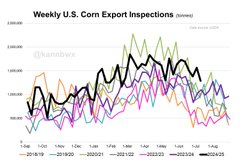
Pretty healthy US export inspections all around last week relative to expectations. 2025/26 wheat inspections finally pulled ahead of last year's, though the marketing year just started on June 1.
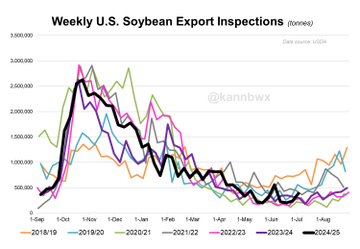
Corn inspections are still rolling. Very impressive. Soybeans aren't doing too badly either.
++++++++++++
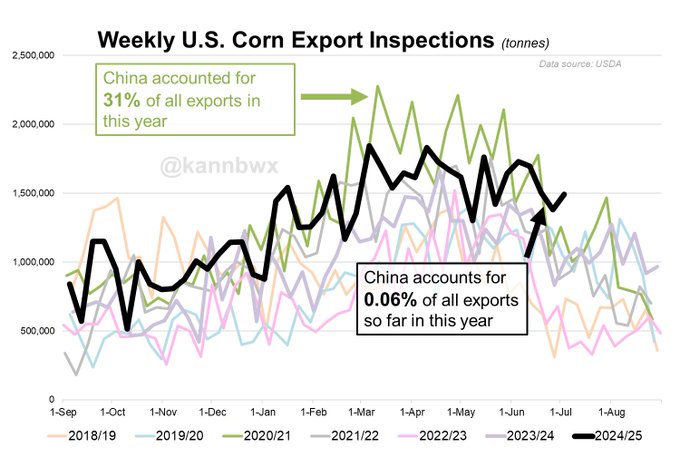
Image where we would be if Trump hadn't shut down all of our China exports!!!
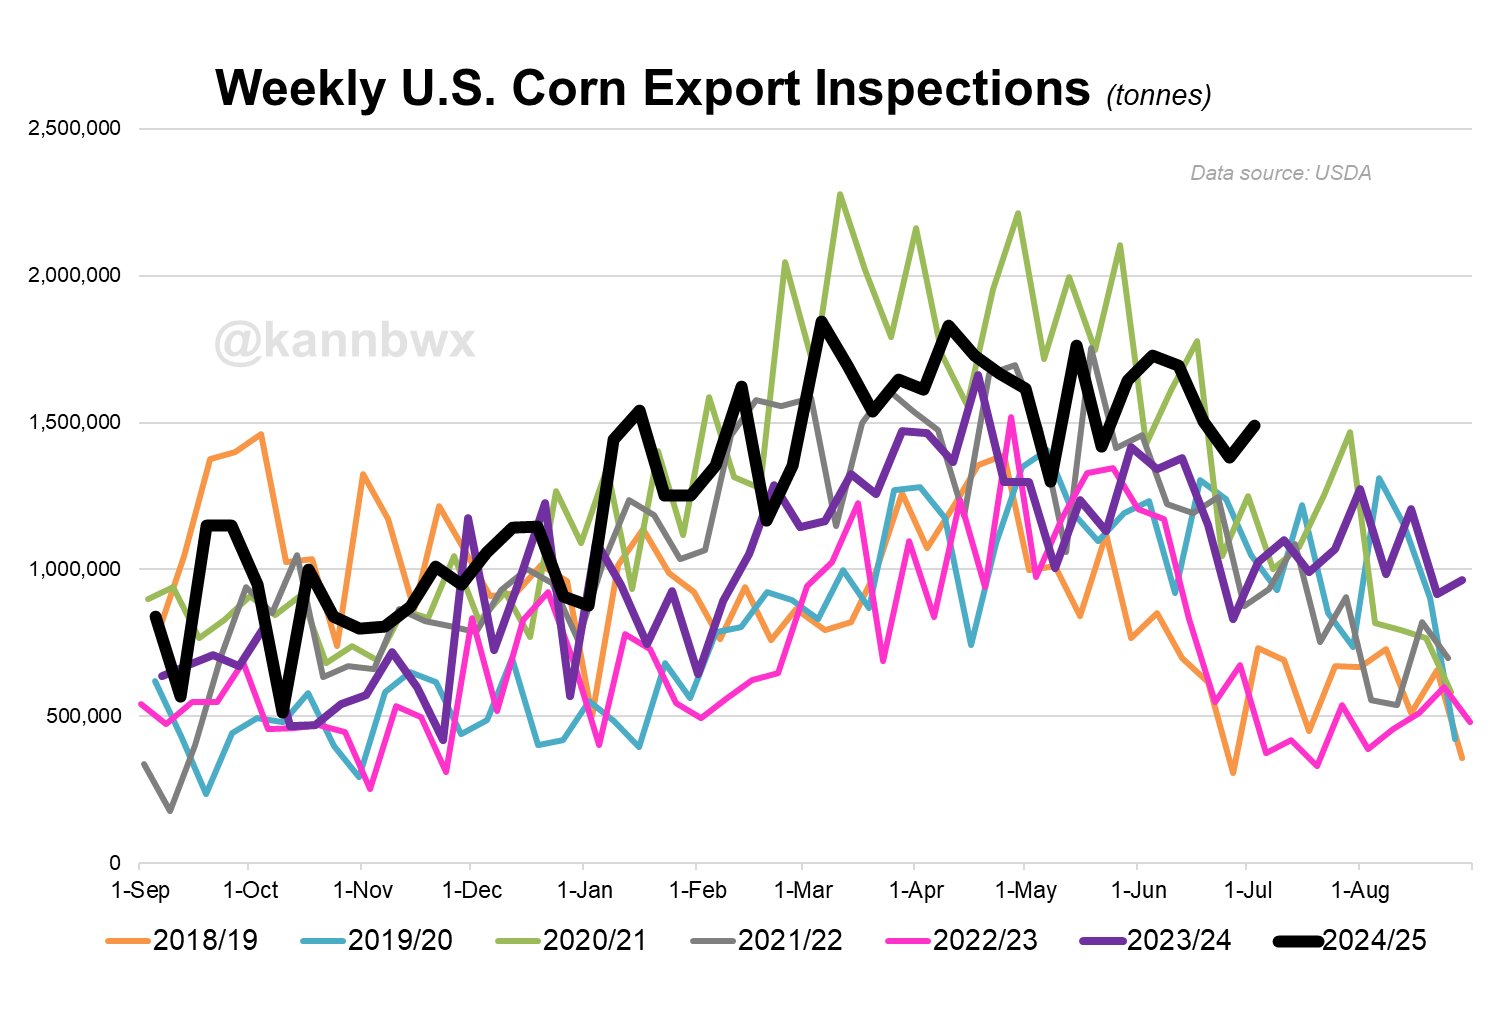
I've posted this before but it's worth repeating. Look at weekly 2024/25 US #corn export inspections versus those for 2020/21. China accounted for 31% of US corn exports in 2020/21. This year? Basically none. To date, 24/25 inspections are roughly 4% behind 20/21.
++++++++++++
metmike: The weaker dollar is helping to increase our exports FOR SURE.
Tracking and analyzing the US Dollar
https://www.marketforum.com/forum/topic/112846/
+++++++++++++++
https://www.cmegroup.com/insights/economic-research/2022/strong-dollars-impact-on-grain-exports.html
++++++++++++++++
https://www.ers.usda.gov/data-products/chart-gallery/chart-detail?chartId=58344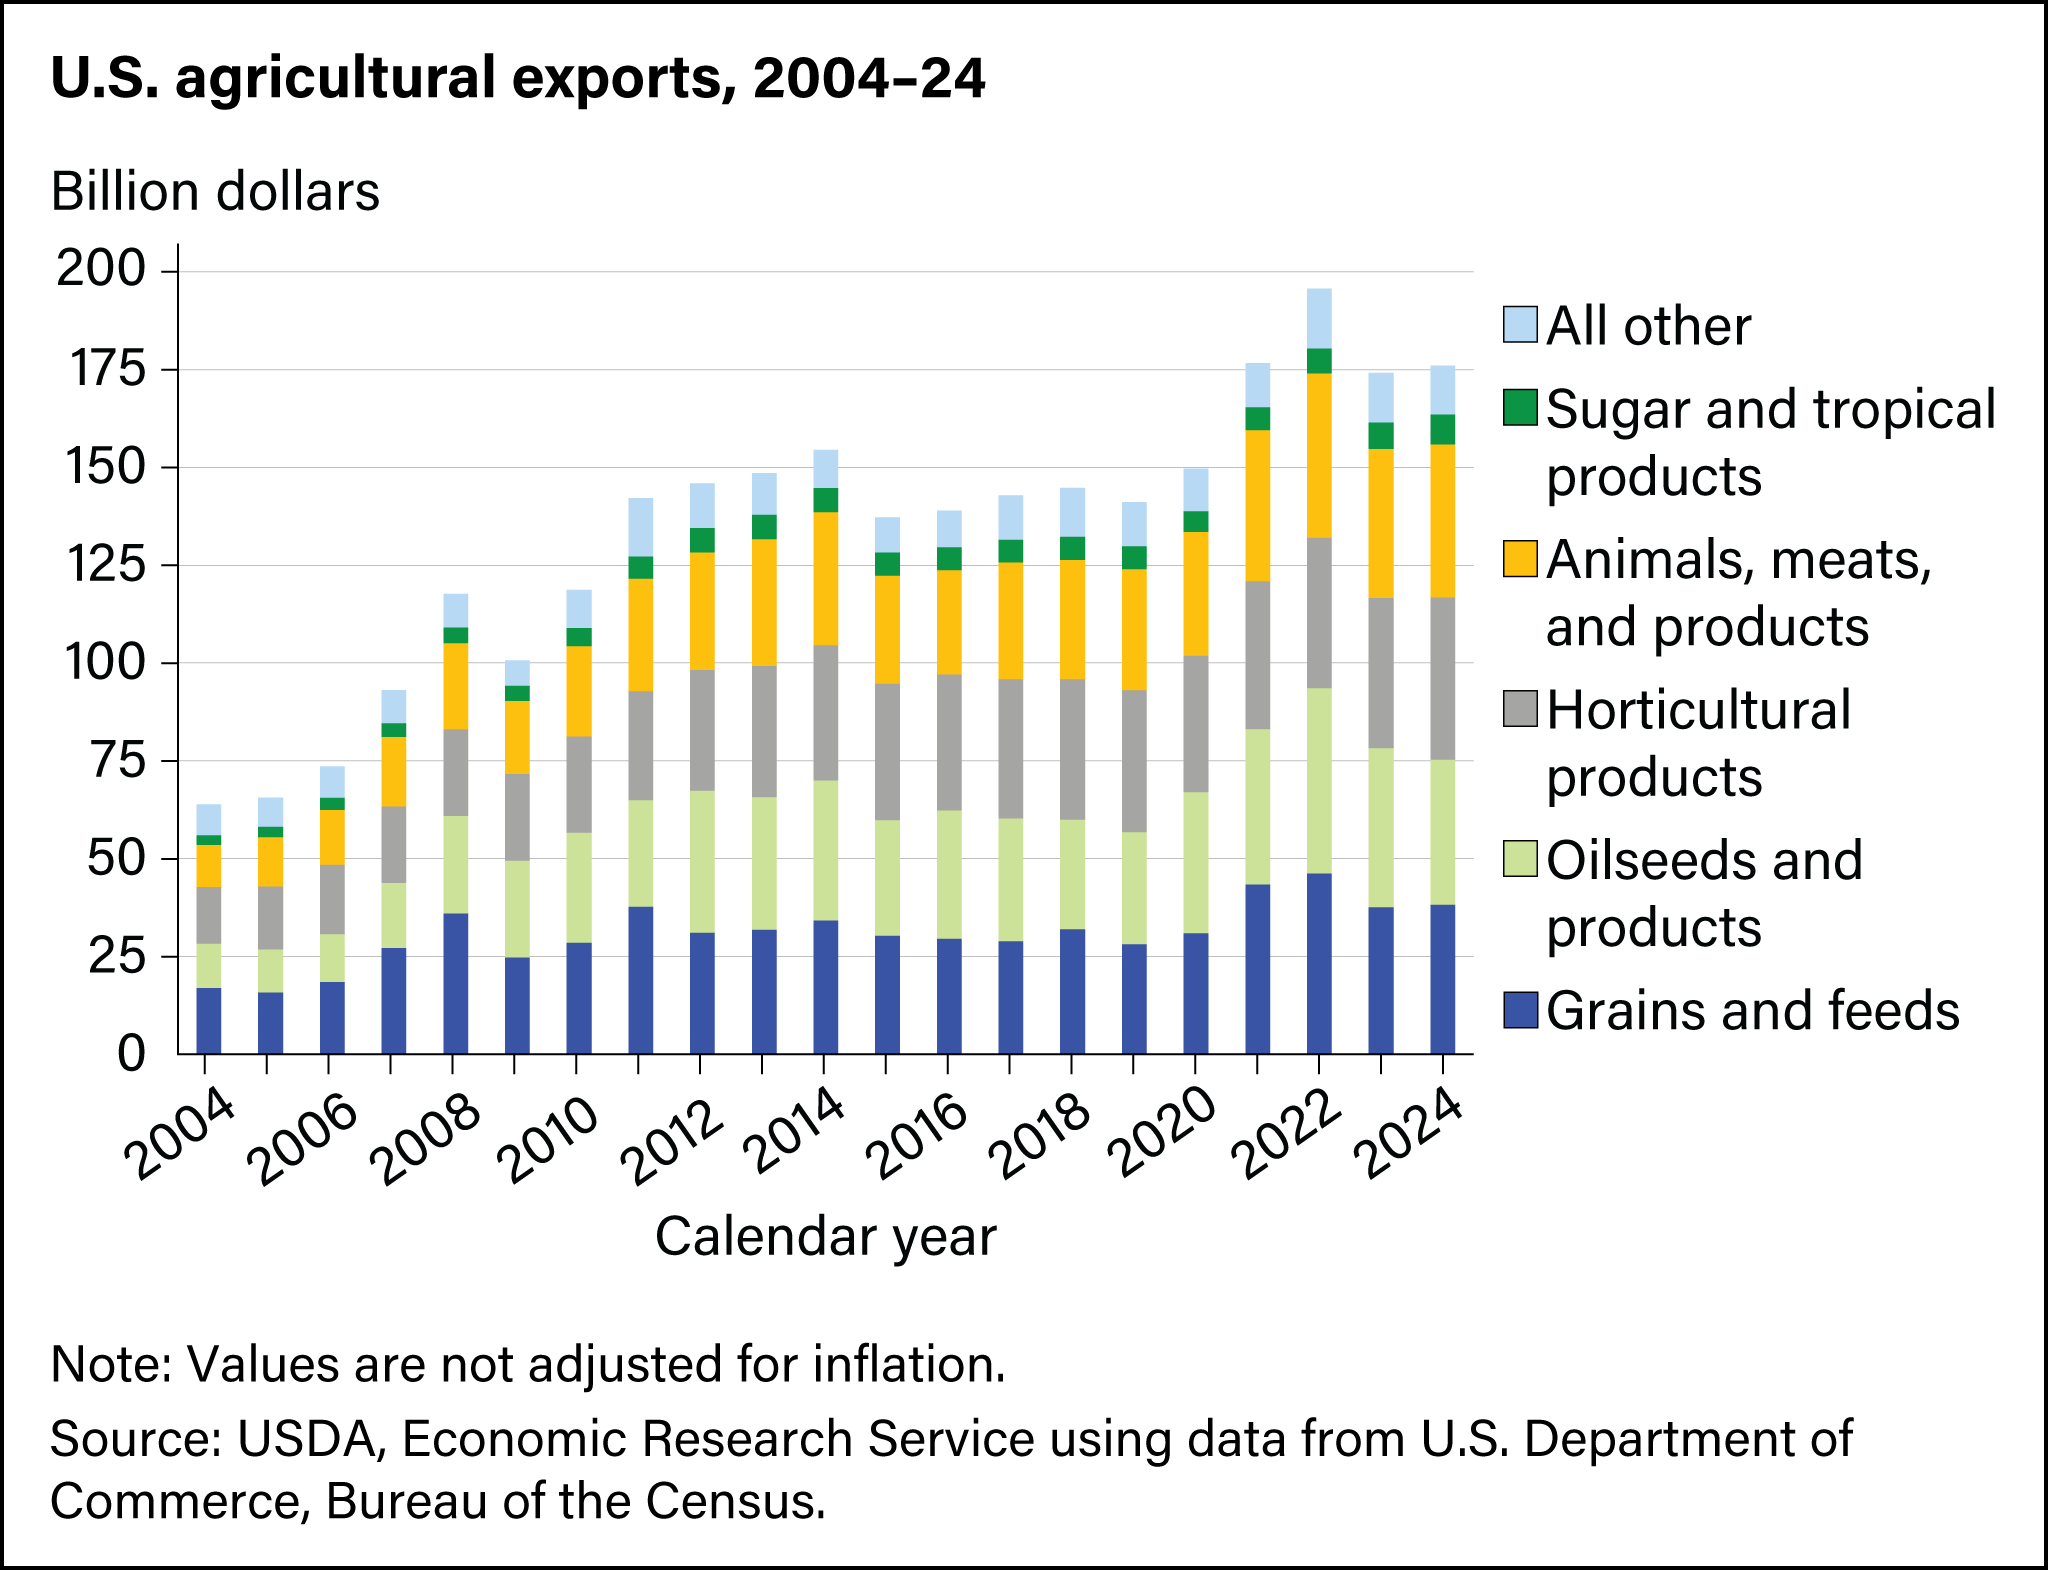
+++++++++
Days 9-12 were much cooler in the middle of the country on this last 12z EE(from a stronger cold front) which also increased the rain a bit in the Cornbelt for that period. That will NOT be in this afternoon's NWS extended guidance which will be using products that came out BEFORE then.
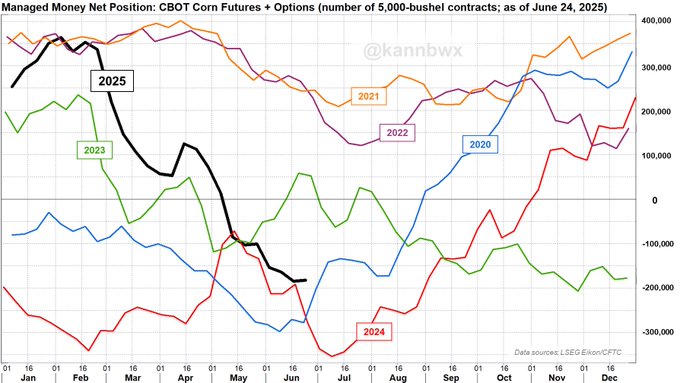
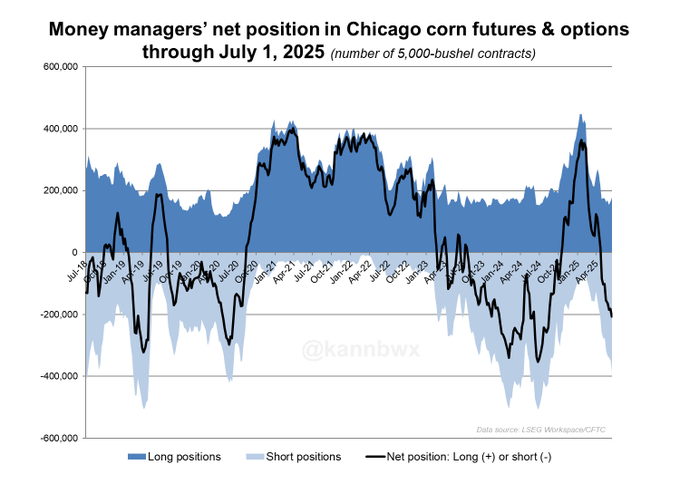
Funds sold CBOT #corn again last week, pushing their net short to 206,463 futures & options contracts - the most bearish since last August. Of interest: the number of gross long positions hit an 8-week high, but funds have added shorts at a faster rate.
The comment about gross longs is to suggest that obviously some investors think a bottom has already been found in corn.... it's just that they are outnumbered for now. Money managers have added new gross short positions in 18 of the last 21 weeks, quite a streak.
The overnight forecast got even MORE bearish.
Adding rains and taking out heat on most runs. With the heat ridge backed up farther west.
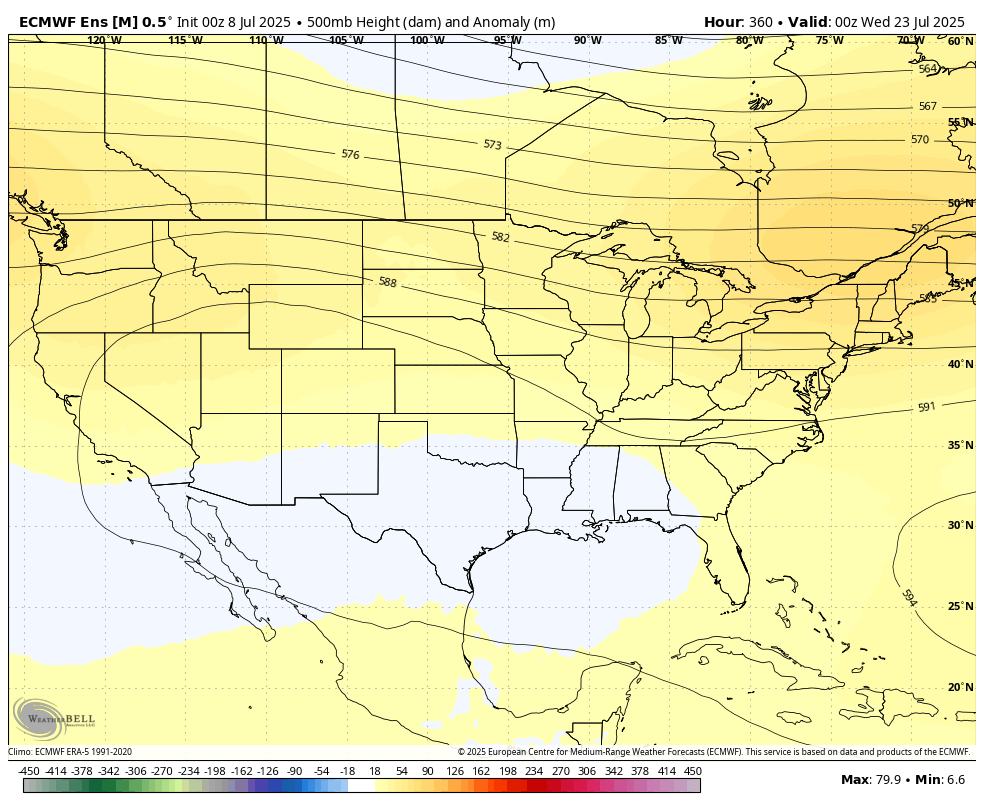
1. 0z European model last 500 mb map for July 23. Northwest flow into the Midwest. That MIGHT dry up?
2. The last 6 GEFS model tries to bring the heat/ridge dome farther northeast at the end (again). This makes sense based on the meteorology but has failed to actually develop or even stay on weather maps for more than a few days. I think the models are struggling with their equations that don't properly dial in the impact of massive photosynthesis and massive transpiration from tightly packed corn plants that have literally created a huge, protective microclimate across much of the Midwest. Almost as if it was a pseudo ocean.
3. In the short run, still too much rain with no dome of death in week 2. Every day that the calendar page turns is a day closer to "making the crop". This is a buying set up for me, especially with some heavy big spec shorts but only with the dome of death/upper level ridge shifting much farther northeast.
7 Day Total precipitation below:
http://www.wpc.ncep.noaa.govcdx /qpf/p168i.gif?1530796126
https://www.youtube.com/watch?v=fYO4PoQi6GE
Thanks ! Crops look really good here.
YW, bowyer!
crops look pretty good here but in my backyard, we‘ve had just under .5“ total the past 2 weeks with 90s/70s for temp ranges and elevated moisture needs with soils drying out.
high dew points keep us from drying as fast during the day but last week featured some drying from wind But they keep temps elevated at night That adds a bit to plant stress after a HOT day.
We all had a cool May but have caught up on GDDs.
More of this heat after pollination will mean HEAT FILL for kernels and reduce yields, no matter the rain amounts. More with dry weather.
Weather for August looks hotter and drier than this bs average but the long range models have been too hot and much to dry.
however, northwest flow tends to dry up in August too with this type of pattern.
Extended NWS guidance today dialed in the more bearish changes:
https://www.marketforum.com/forum/topic/83844/#83852
++++++++++++++++
It's always fun to listen to other thoughts on upcoming weather. They often will make a couple of points that I wasn't thinking about!
BAM weather:
https://www.youtube.com/watch?v=mOxRHJgswzI
+++++++++++++++
https://www.youtube.com/watch?v=pWA4y5Ilhxg
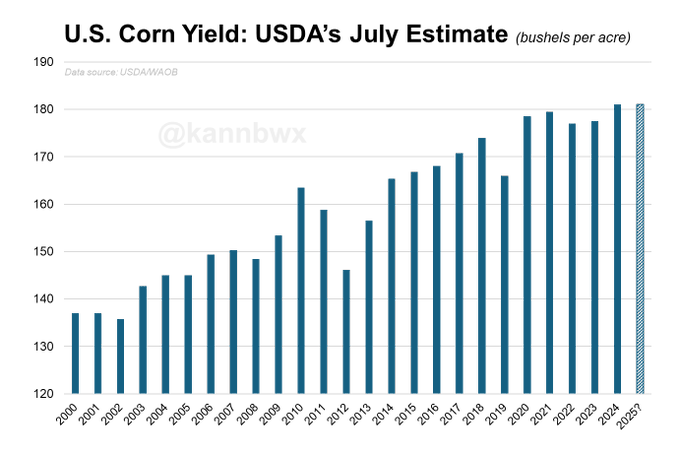
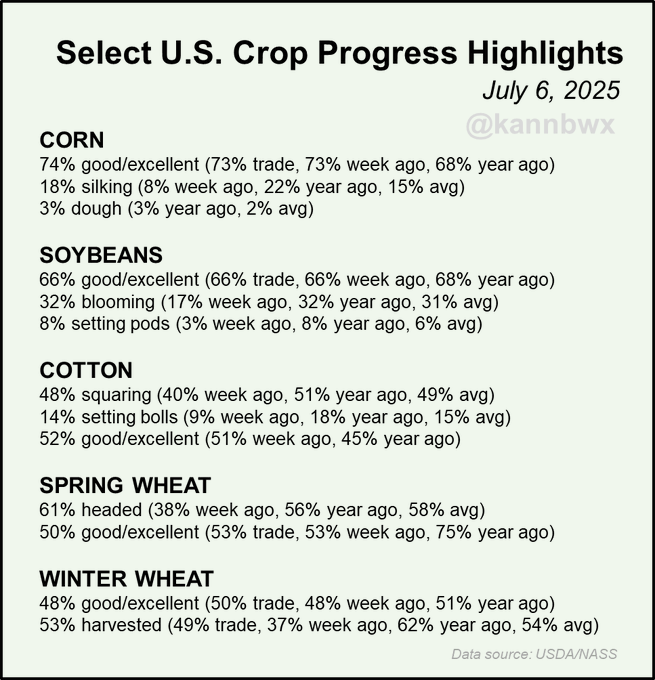
Could USDA actually raise US #corn yield on Friday??? Very unlikely, as there's not really a mechanism in place for it. Prob stays at 181 bu/acre. But USDA can technically do whatever it feels necessary, so the chances are never 0. Last time corn yield rose in July? 2003.
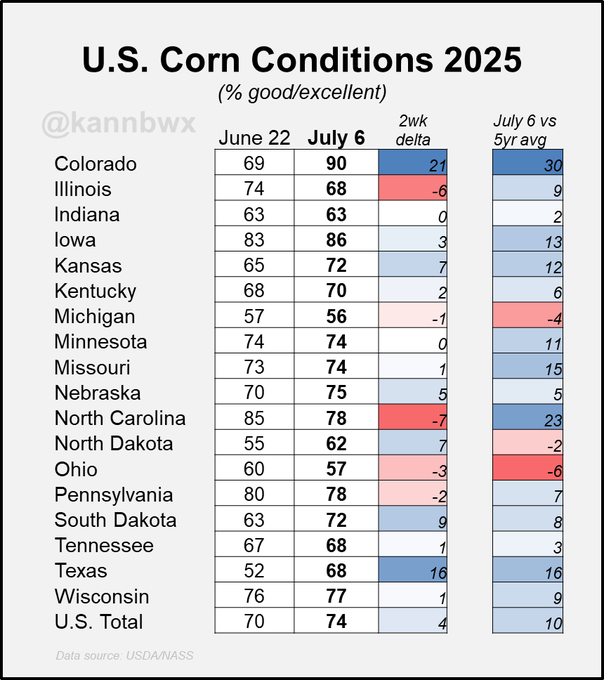
Market seems resigned to a massive US #corn yield. Are there any weak spots? Can crop conditions help identify them? The two-week trend is mixed, but comparing July 6 conditions w/ the 5yr average reveals only Ohio, North Dakota & Michigan lagging. Those lags are small.
This guy is sharp. Our producers know who he is:
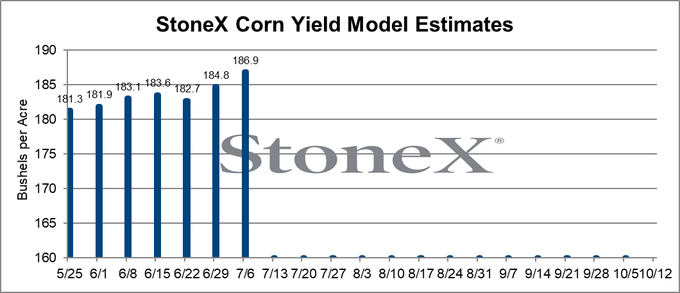
This week's #corn condition index score of 385 is tied for the 4th highest of the 2000's for this week of the year. Yield models are rising well above trend. That's why the market doesn't care about near-term tighter stocks. It's focused on new-crop dynamics. #oatt
++++++++++++
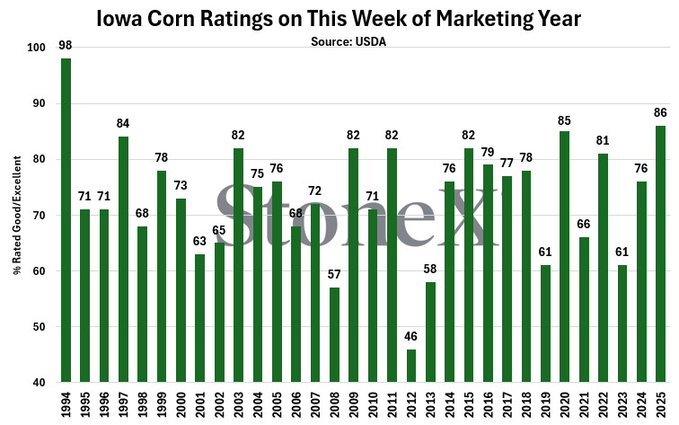
At 86% good/excellent, Iowa (the top US #corn producing state) is now looking at their best #corn ratings at this time since 1994. At the national level, US #corn ratings are their best at this time since 2018, rising 1% week-on-week to 74% G/E. #oatt
metmike: I actually remember 1994 extremely well! Amazing growing season!
++++++++++
#Corn prices are down because trader yield models are rising. Here's a look at mine. I've heard others higher. It's still early, with a lot of growing season ahead, but this is what traders are focused on now. #oatt
++++++++++
SoybeanTrader88@SoybeanTrader88
#soybeans #corn #oatt I'm officially throwing my hat into the yield forecasting mudslinging! I unveil, for free, my model! Violà! ABOVE TREND YIELDS (disclaimer: as of July). Eat that and weep!
++++++++++++++++
Marketing year to date #soybean export inspections exceed the seasonal pace needed to hit USDA's target by 66 million bushels, matching the previous week's pace and halting what had been a steady decline of the gap
Marketing year to date #corn export inspections exceed the seasonal pace needed to hit USDA's target by 148 million bushels, and the gap continues to grow. Look for USDA to raise that export target again on Friday.
 HTS Commodities@HTSCommodities
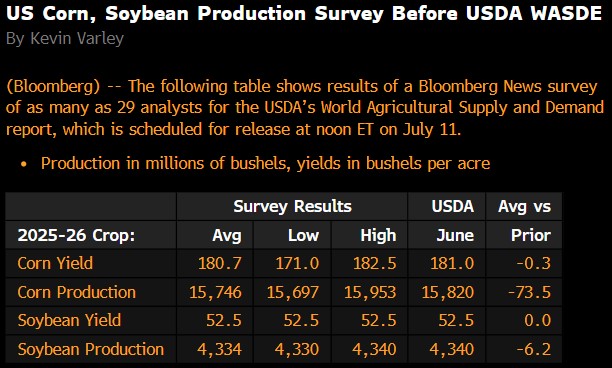
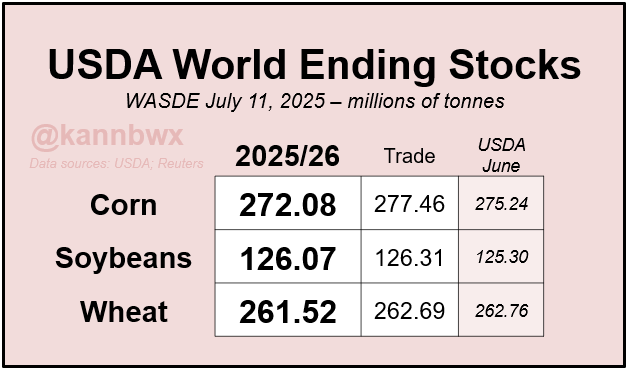
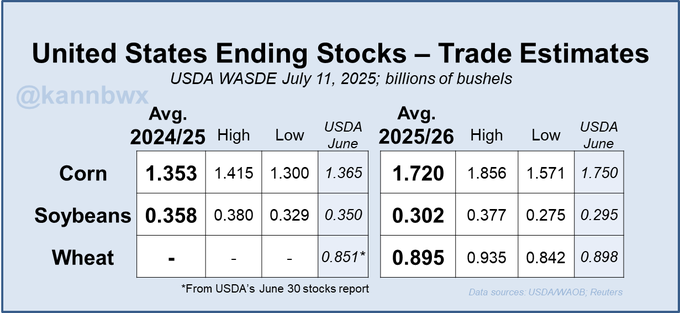
Bloomberg's July WASDE crop production estimates for #corn #wheat #soybeans Good luck!!!
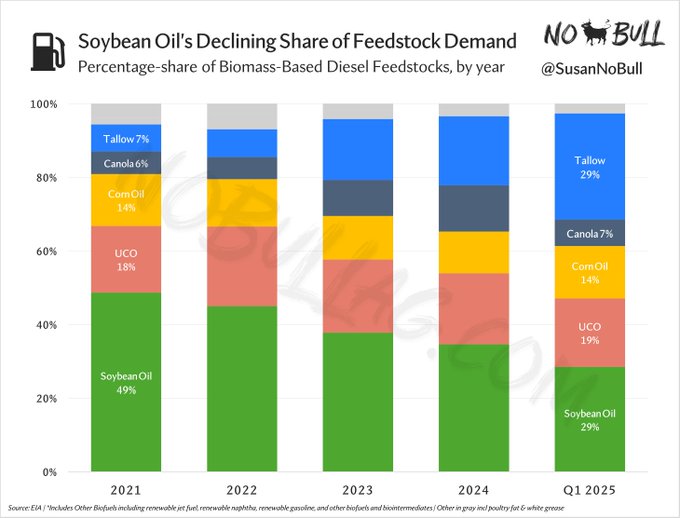
The HOT TAKE is out! Tallow use in biofuels has surged ~500% since 2021, with its share of total feedstock demand climbing from 7% to 29% Meanwhile, #soybeans oil’s share has fallen from ~50% to 29% -now neck and neck with tallow That’s a lot of beef fat… and that’s no bull!
++++++++
The last 12z EE(1st map) and 18z GEFS(2nd map) models having increased their bullishness at the very end of their 16 day forecasting period.
IF this continues to get closer and shifts an additional 600 miles northeast, then we are close to the lows for the Summer right now.
Big IF but that's what we need.
The crop is in great shape. The weather has been great. The big specs are loaded short and vulnerable to short covering and the market has been trading this for weeks which has depressed prices.
Huge weather pattern changes to the opposite weather in July are the ideal weather trading set up for corn and beans. However, there are almost 2 weeks of good weather before then and this can change back to more bearish which has been happening a lot this Summer.
So we should be very skeptical but alert in case it DOES happen because prices have tremendous upside if a dome/heat ridge moves into the northwest 50% of the Cornbelt at the end of July!
The last runs were more bearish.
1. This last 0z European model with vorticity/spin shows more vorticity in the northwest flow into the Midwest which would continue to maintain a favorable trigger for rain systems tracking around the periphery of the dome( and dropping southeast into a Eastern Midwest trough) which continues to be threatening BUT TOO FAR SOUTHWEST.
Everything needs to shift 600+ miles to the northeast!
2. There were HUGE much cooler changes(bearish) overnight. The CDDs in purple on the right for just the Midwest were a whopping -6 CDDs vs the previous 12z run!
This 7 day rain forecast continues bearish. 2 inches of rain for most of Iowa in the middle of July is pretty bearish! Most other places in the Cornbelt get decent rains. We keep missing in our backyard from close but no cigar rains
7 Day Total precipitation below:
http://www.wpc.ncep.noaa.govcdx /qpf/p168i.gif?1530796126
Overnight, the CDDs in the Midwest on the 0z EE jumped +7CDDs! The cool shot that wasn't there last week at this time is still there but should be dialed into the price now.
With more heat in the forecast, rains will be especially important late in the month.
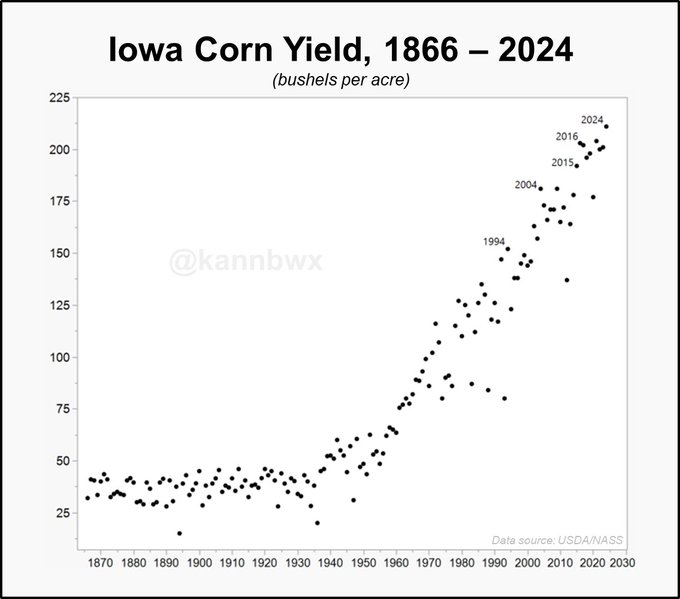
Iowa #corn yields, 1866-2024 In 2015, Iowa beat its corn yield record by 11 bushels. In 2016, yield bested 2015 by another 11 bu. Yield in 2024 hit 211 bu/acre, up 7 bu from 2021's high. Iowa corn health is the best for July since 1994. Another yield leap coming in 2025?
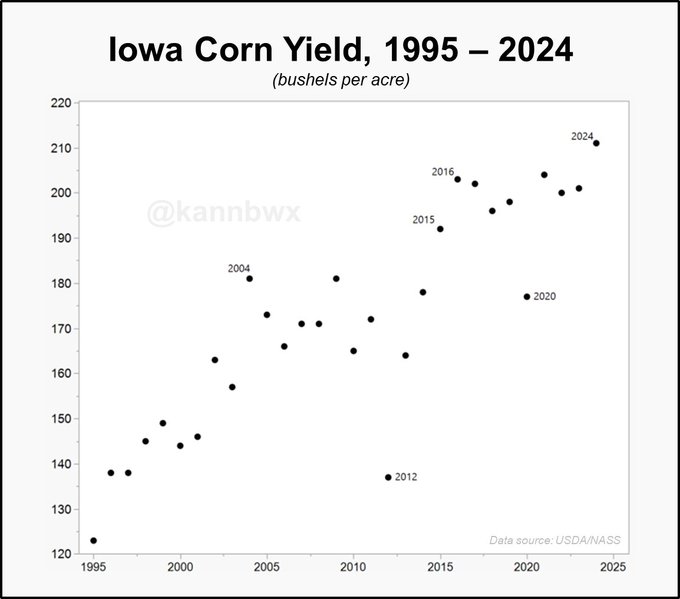
Here is a more zoomed in chart to examine the last 30 years. Iowa's #corn yield in 2002 topped the state record by 11 bu and then 2004 broke that record by 18 bu. Lots of strides made in the last couple of decades. But what is the further upward potential? Plateau or no?
metmike: The market was trading expectations for tomorrows USDA report on Thursday.
Analysts expect USDA to cut US #corn ending stocks even further in Friday's report. Trade will be watching old-crop exports for a potential bump. USDA is very likely to keep US corn/soy yields unchanged, but they will update harvested areas after the June 30 report.
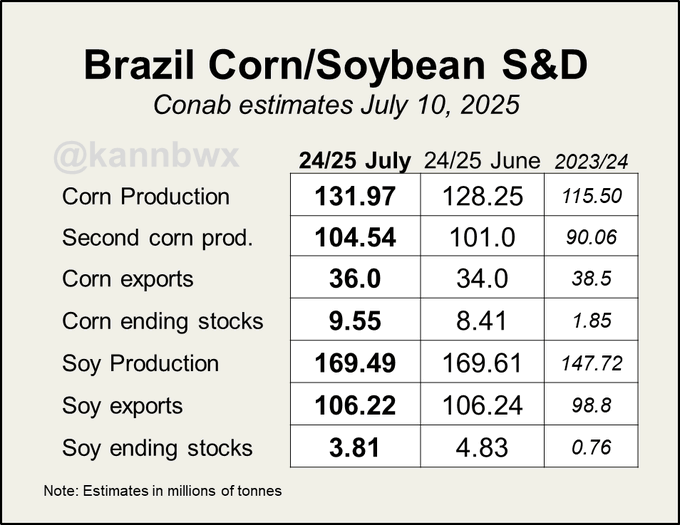
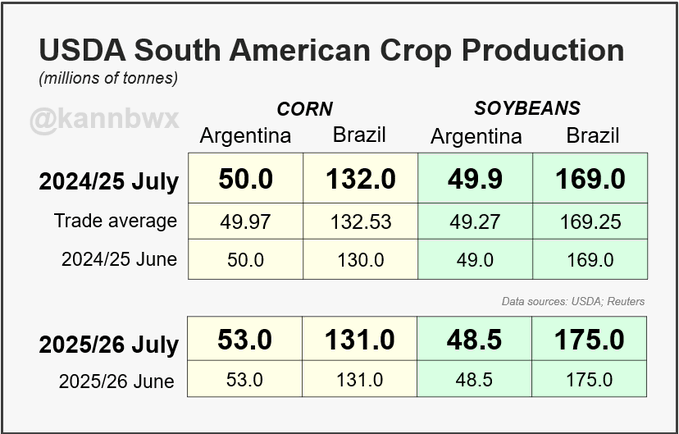
Conab projects Brazil's 2024/25 #corn crop to be record large, slightly edging out 2022/23's high. The new estimate of nearly 132 mmt is up 10% from Conab's initial forecast last October. The soy crop was trimmed slightly this month.
+++++++++++++++++++++++++++
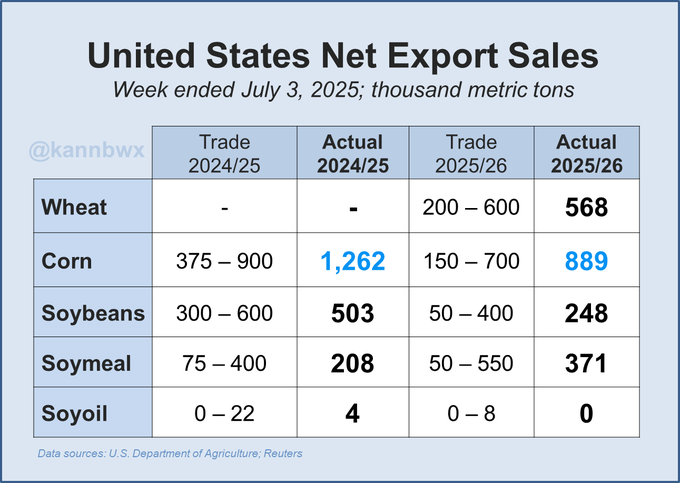
US #corn export sales blew past all expectations last week, particularly old crop and led by Mexico & Japan. The corn sales were well above average for the week. Still no China on new-crop #soybeans - the first time China had nothing booked by early July since 2005.
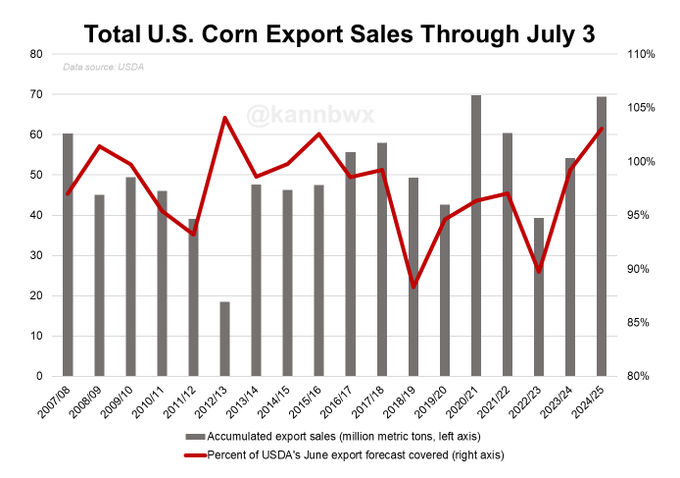
2024/25 US #corn export sales, July 3: 2.731 bln bushels USDA 2024/25 export forecast: 2.65 bln bu There were 3 other times in the last couple decades where July 3 sales > USDA's forecast. Final exports were at least 4% higher than the June forecast in all 3 years.
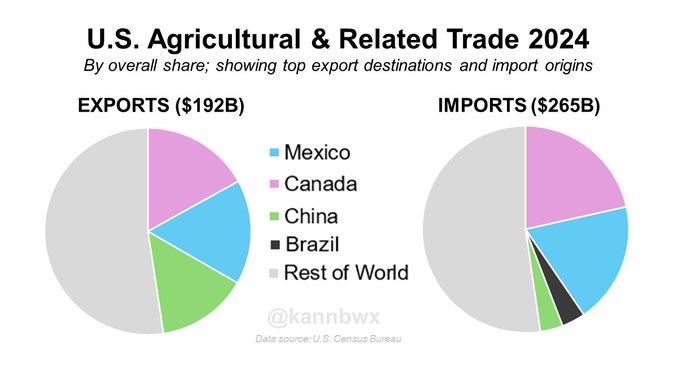
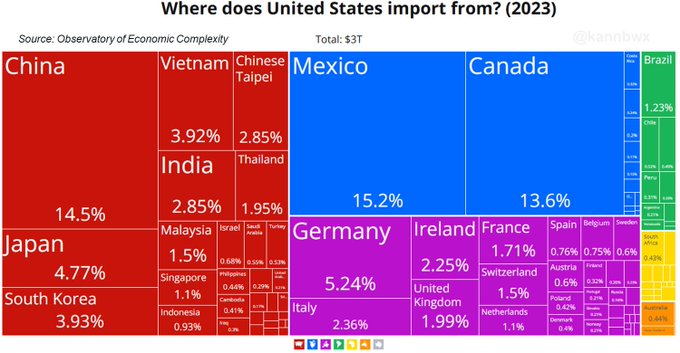
Trump slaps 50% tariffs on Brazilian products starting August 1. In 2023: Brazil accounted for 1.2% of US imports ($37B), representing 10.4% of all Brazilian exports.
Brazil was the destination for 2.2% of US exports ($40B), representing 15.7% of all Brazilian imports.
@kannbwx
The Brazilian real tumbled over 2% on the news, which is unfavorable for US farmers. A weaker real makes corn & soy prices more attractive for Brazilian farmers. After record weakness in December, the real this month had strengthened to one-year highs vs to the dollar.
USA carries a pretty steep trade deficit with Brazil when it comes to agricultural goods. But when it comes to all goods, USA carries a trade surplus with Brazil, eliminating trade balancing as a possible reason for Wednesday's tariffs.
++++++++++++++++
metmike: The MAIN reason is that President Trump is mentally ill and is using pathological thinking in most realms. On this one, he clearly lacks the understanding/comprehension of global market dynamics to make smart decisions. He appears to be obsessed with the money he can get from collecting tariffs AT THE EXPENSE of everything else, some of which is very damaging, including punishing US consumers.
+++++++++++++++++++++++++++++++++++++++++++++
Brazil accounted for only 0.5% of all US ag exports in 2024, making Brazil the #31 destination. Top Items: Dairy Products $113M Essential Oils $103M Other Feeds, Meals & Fodder $86M Wheat $85M
When it comes to US agricultural imports in 2024, Brazil was the #3 supplier at just under 4% of the total. Top Items?Coffee $1.96BForest Products $1.56BBeef & Beef Products $1.37BFruit & Vegetable Juices $1.15B
Overnight models for 2 week were a bit MORE bearish again!
USDA at 11am is very important. Then, back to weather.
The models for the past couple of weeks have been underestimating the strength of the northern stream coming down from Canada and carving out a cooling trough in the Midwest/Northeast which retrogrades the heat ridge to a position centered in the Southwest.
7am:
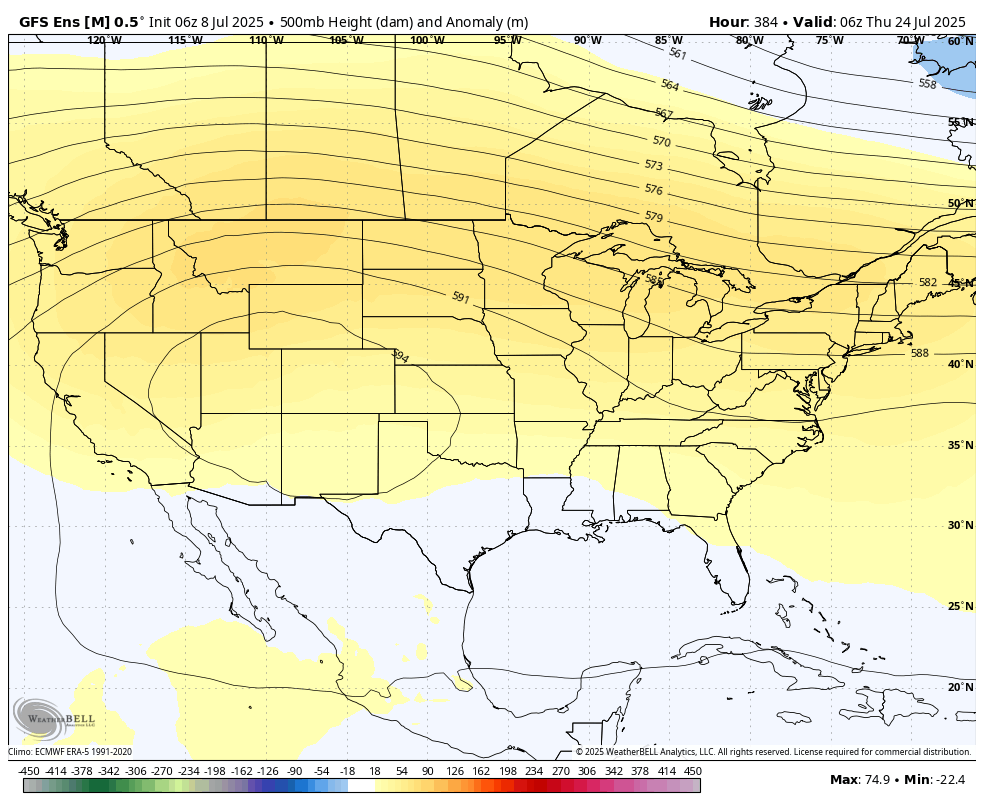
The very last map of the just out 6z GEFS is not very bullish to me. Heat ridge/dome, centered in the S/C.Rockies with a trough in the eastern 1/3rd of the US keeping the heat away. Northwest flow in the Midwest feeding into the trough.
USDA reduced old and new crop US corn ending stocks. Old crop soybeans unchanged but new crop stocks drifted slightly higher. New-crop wheat trimmed slightly from last month. 2024/25 US #corn exports are now predicted at a RECORD 2.75 billion bushels.
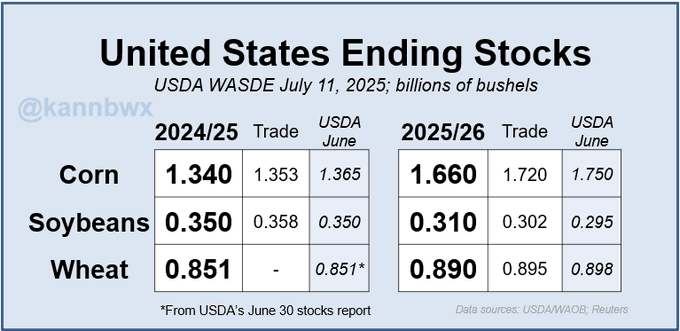
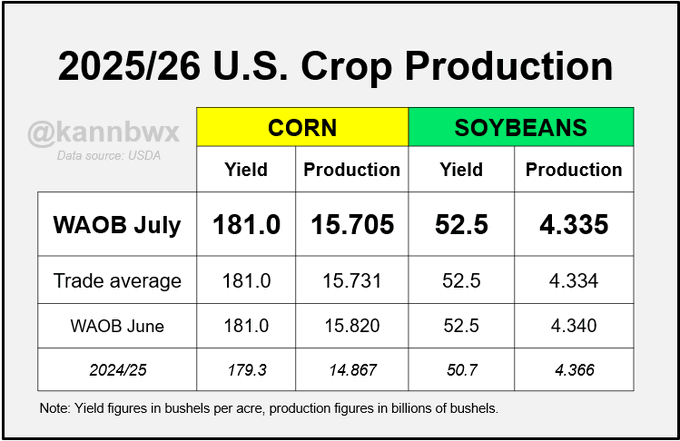
USDA's US corn and soybean crop estimates dropped slightly from last month because of a smaller harvested area, though yield did not change. All of this was 100% expected prior to today's report. No surprise.
USDA raised Brazil's 2024/25 corn crop and Argentina's 2024/25 soybean crop from last month, but everything else was unchanged.
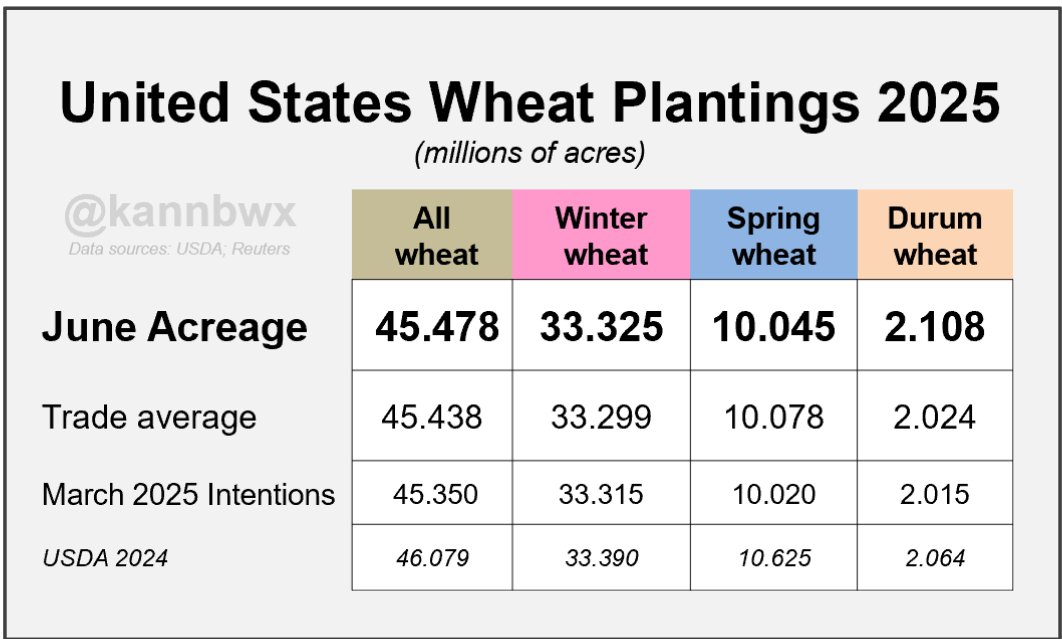
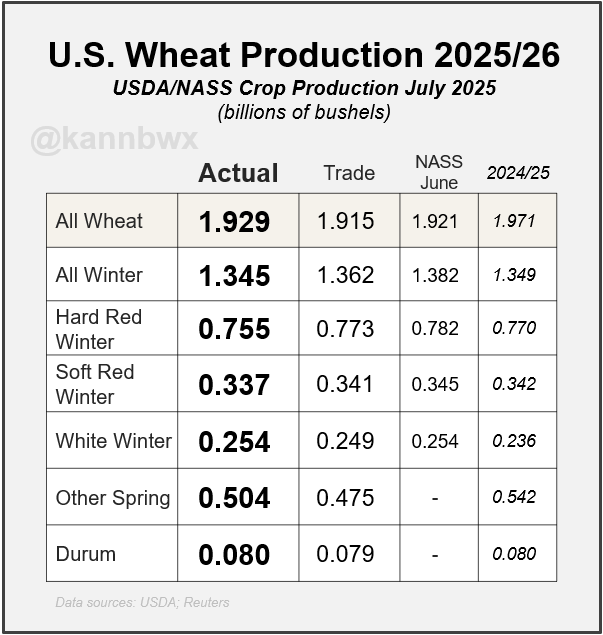
US wheat crop comes in slightly larger than expected as spring wheat tops the average trade guess. However, that was partially offset by a lower winter wheat figure, particularly HRW.
https://www.marketforum.com/forum/reply_post/113141/
++++++++++++
Back to weather which has turned even MORE bearish as outlined in previous posts.
The northern stream has turned unexpectedly strong in July and instead of the bullish teleconnections coming from the Pacific taking over into the Western Cornbelt, that impact has been deflected farther west by the push from the unexpected northern stream(upper level trough in Southeast Canada) into the Midwest/Northeast.
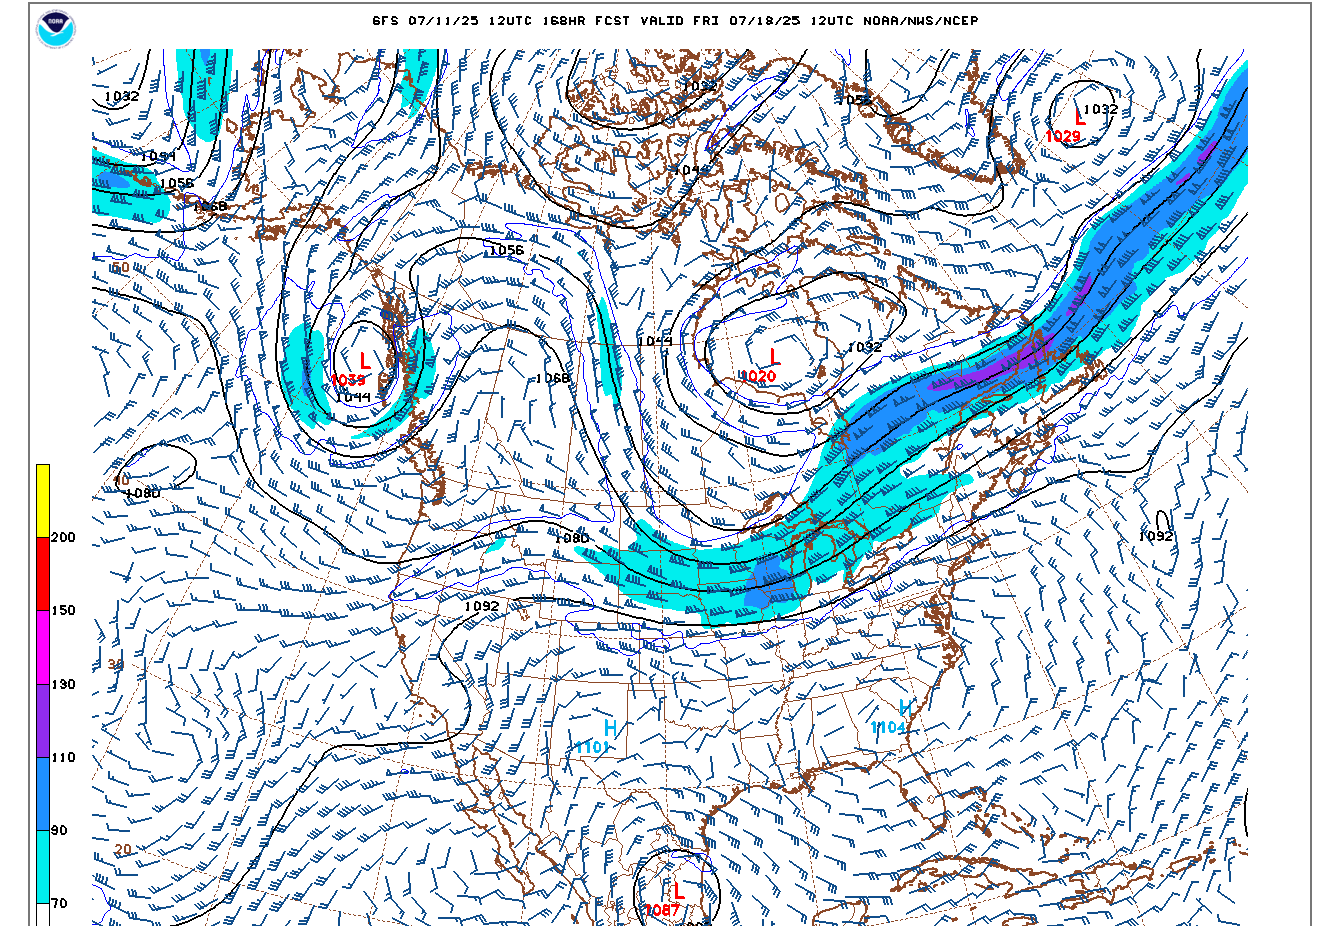
NORTHERN STREAM JULY SURPRISE!
1. Day 7 jet stream at 250 mb from the just out 12z GFS.
2. Day 10 jet stream at 250 mb
https://www.youtube.com/watch?v=FKdhv8wFr8U
+++++++++++++++
Canadian Prairie Weather Story with Andrew Pritchard | July 11th, 2025
https://www.youtube.com/watch?v=UF9FiRQjsz4
Another HUGE cool surprise to the 12z GEFS model. For just the Midwest, a whopping -14.5 CDDs (in purple) vs the previous model run!!! These cool surprises have defined the models in July but the magnitude of this one is shocking!
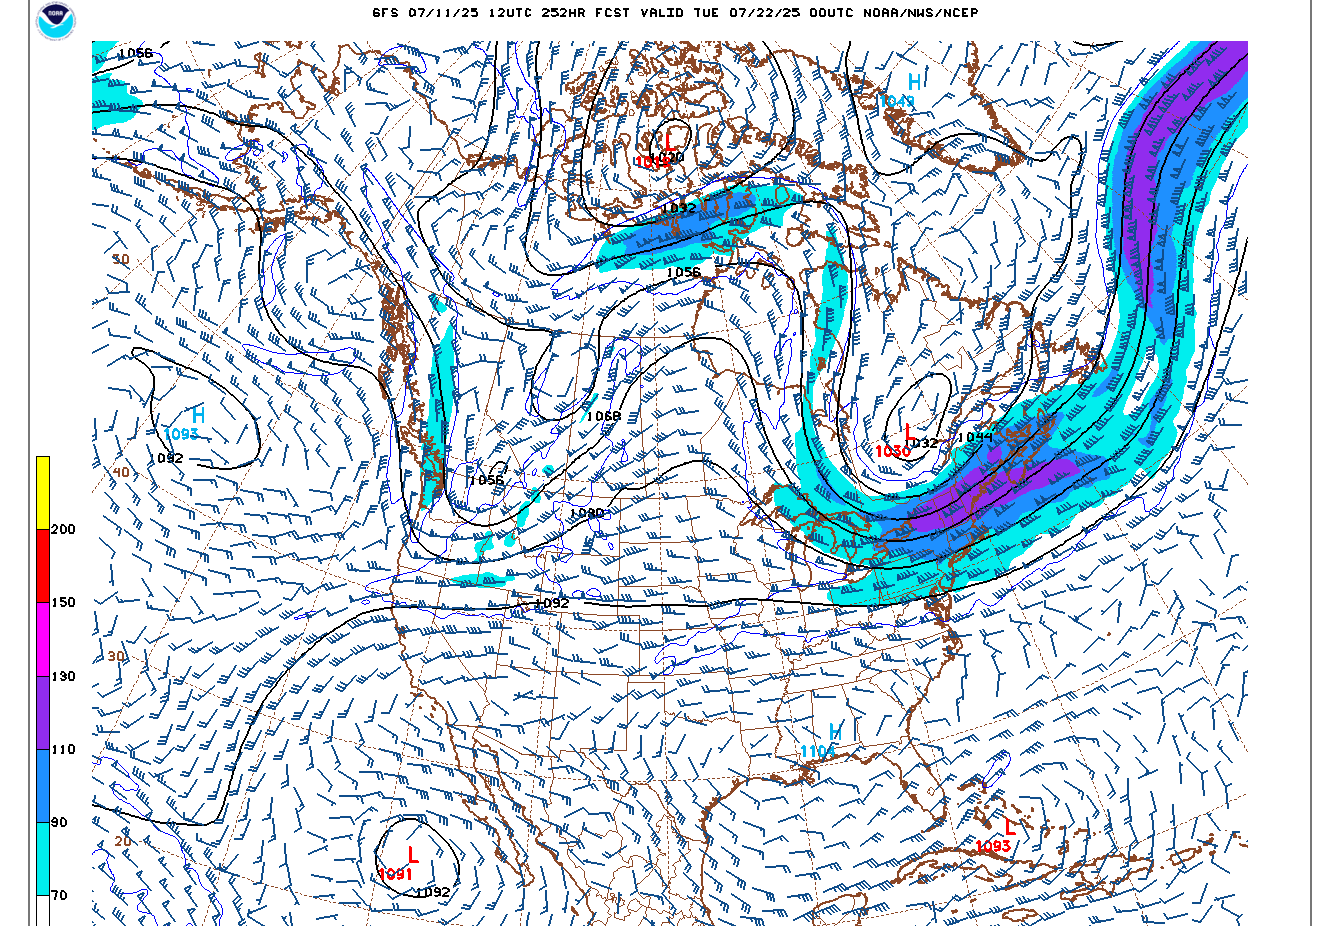
Day 15 of the last 12z European model. Strong northwest flow in the Midwest that keeps the intense heat away with active cold fronts making rain.
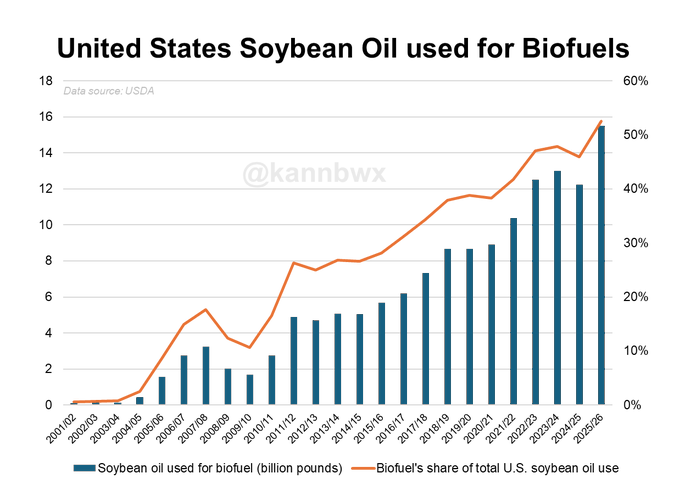
USDA forecasts US #soyoil used for biofuels in 2025/26 to surge 23% on the 3yr avg given recent EPA mandates as well as the 45Z tax credit. The 15.5B lbs is +12% from last month's forecast. This means a record 53% of soybean oil usage in the USA will be dedicated to biofuels.
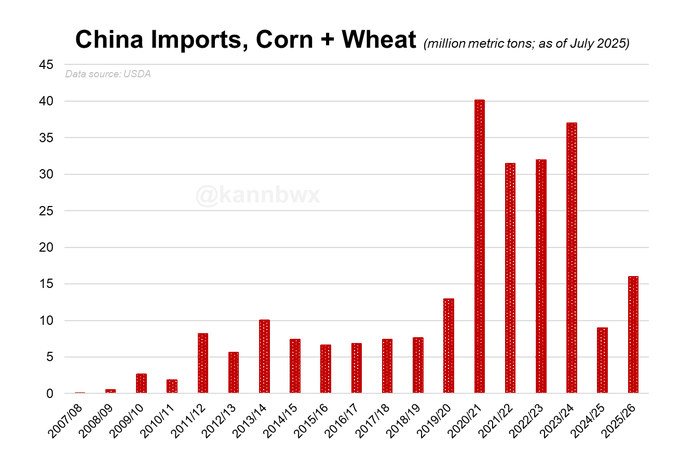
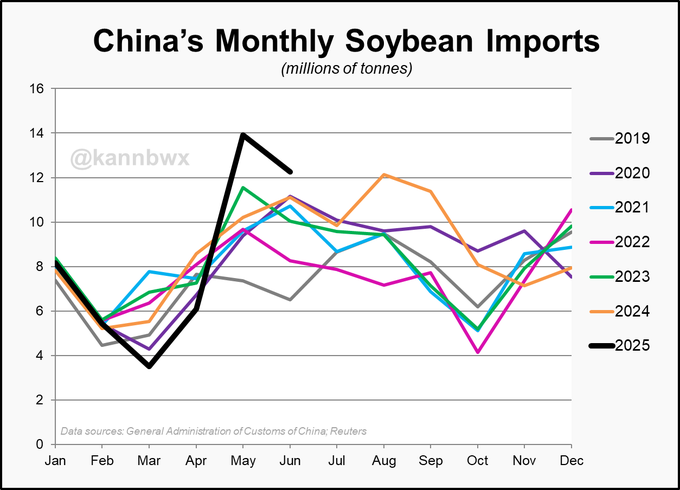
Per USDA, China's combined #corn & #wheat imports are set to plunge 76% on the year in 2024/25 to a six-year low. USDA cut the corn import number yet again this month. A rebound is preliminarily expected in 2025/26, but to nowhere near the early 2020s levels.
US #corn exports are projected to hit a RECORD 2.75 billion bushels in 2024/25 - just barely edging out 2020/21 at 2.747 billon. Biggest difference between those years? China accounted for 31% of US corn exports in 2020/21 and 0% in 2024/25.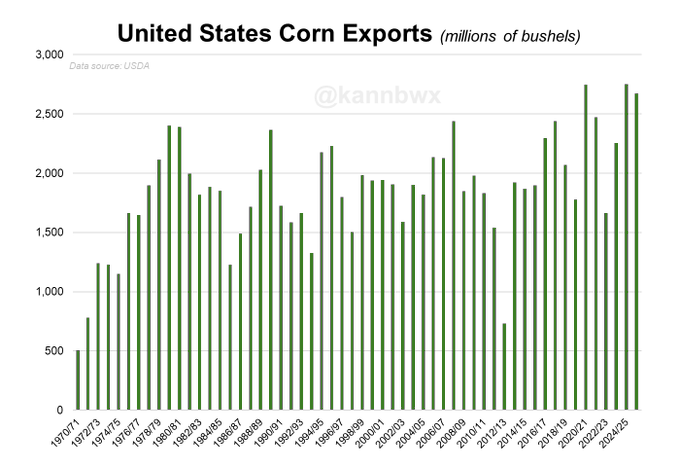
Low skill weeks 3-4 updated. This is an interesting outlook that contrasts to recent longer range outlooks.
I have near 0 confidence that it will turn out this way.
https://www.cpc.ncep.noaa.gov/products/predictions/WK34/
Still way too much rain in the Cornbelt forecast the next 2 weeks.
The weather is looking more bullish in weeks 3-4 on some models with the northern stream retreating into Canada and the heat ridge/dome shifting into parts of the Cornbelt but the models for that period have advertised a big change to hotter and drier for the last 2 months and here we are in mid July and it still hasn't happened.
Rain makes grain in July and another, possibly 2 weeks of decent rains in many areas are just getting the crop 2 weeks closer to being made.
Corn actually gapped lower to new lows. This is a downside breakaway gap unless it gets filled. Then its a selling exhaustion gap and crap which would be a powerful BULLISH chart signature at the end of a long move down.
Beans opened lower too but not quite a gap lower.
I have moderate confidence that corn filling weather will be too hot, even with rains so that kernel size will be diminished because accelerated GDDS and the crop maturing really fast, leaving less time for the plants to fill kernels to the plump size that they can reach with an extended filling time frame.
However, the market is trading excellent pollination conditions the next 2 weeks.
These were the CDDs for just the Midwest in purple from the last 12z European Ensemble model.
Huge cool down this week with a brief period of temps actually below average. Note the average temp green line is starting to drift downward with this the time of Summer that averages the hottest temps climatologically.
Beans dropped below $10 briefly but have come back to down just 1c(make that -1/2 c on the highs at 106.75). Boy o Boy if we got the weather to turn decidedly hot/dry, corn and beans would have tremendous upside.
Grains have continued their reversal up on 0z models continuing their extended solution of the heat ridge moving northeast into portions of the corn belt and probably suppressing rains in the southwest parts of the cornbelt.
this last 0s run of the European model was pretty bullish.
Regardless of rains my confidence on the heat has bumped up from moderate to high.
corn has done gap and crap, selling exhaustion at the end of a long downtrend which is pretty bullish.
all we need is for models to continue hotter and drier and we could be off to the races.
++++++
there is still lots of rain left in week 1 so it will be interesting now to see if the big specs want to sell it again in the morning or start covering their huge shorts ahead of the dome potentially shifting in towards the end of the month.
6z GEFS not as bullish as the very bullish 0z EE.
They managed to sell the beans off to lower for the session but couldn't do that with the corn, because, I think of what was mentioned yesterday HEAT FILL.
No matter how much rain falls, heat fill WILL reduce yields with 100% certainty because of the indisputable laws of agronomy.
Corn also has the better demand story.
Here you go again:
Here's our best thread for explaining and illustrating this principle:
HeatFill for Corn
Started by metmike - July 14, 2023, 2:47 p.m.
https://www.marketforum.com/forum/topic/97257/
++++++++++++++
At least that's my SPECULATIVE thinking at this point.
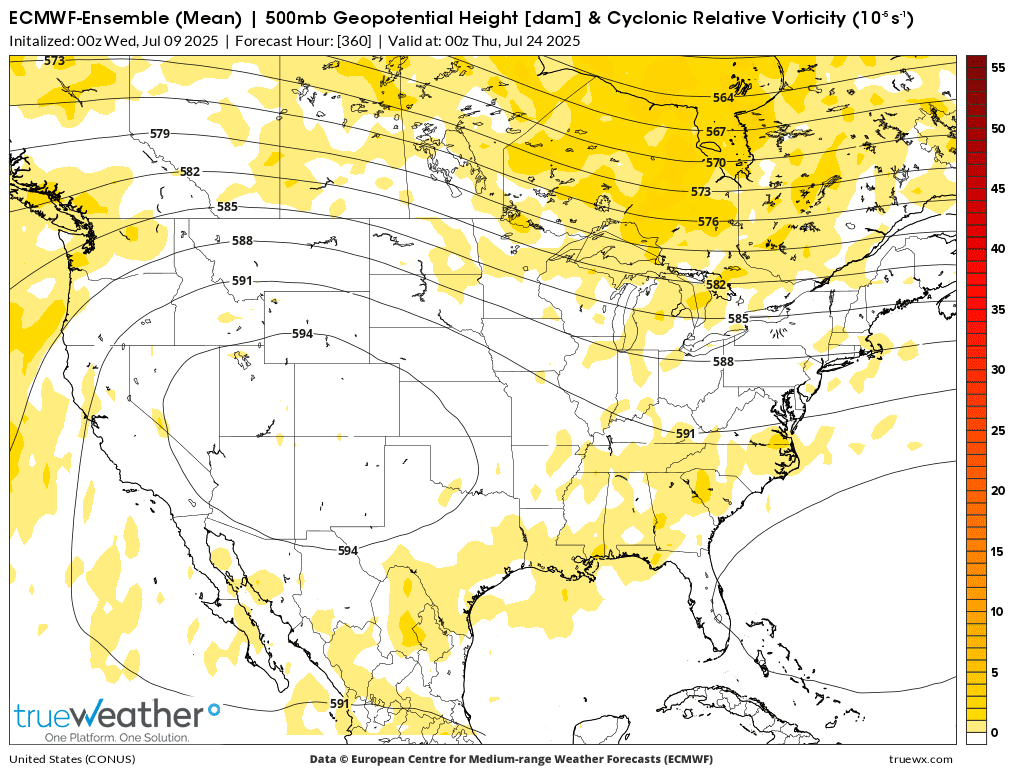
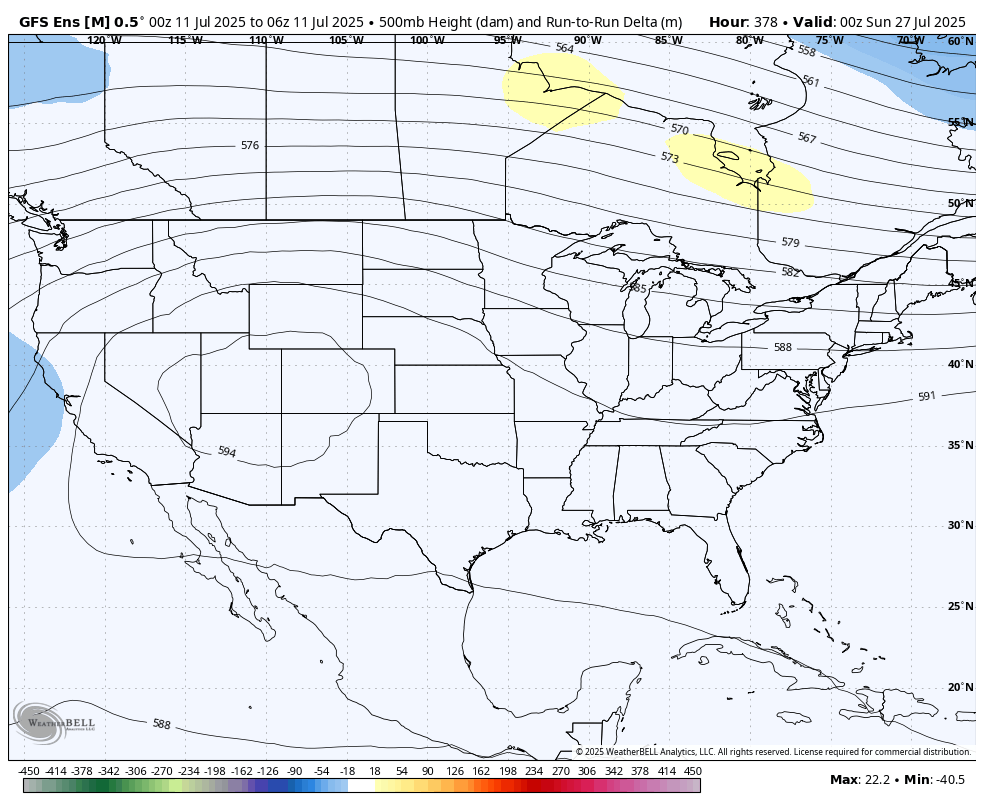
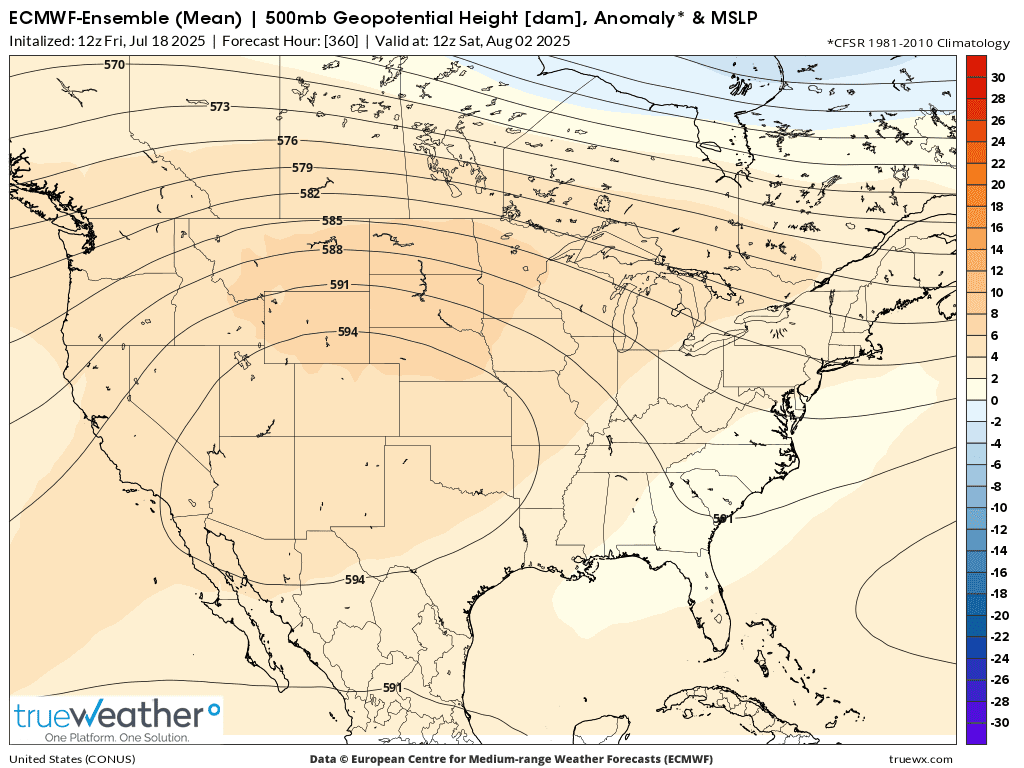
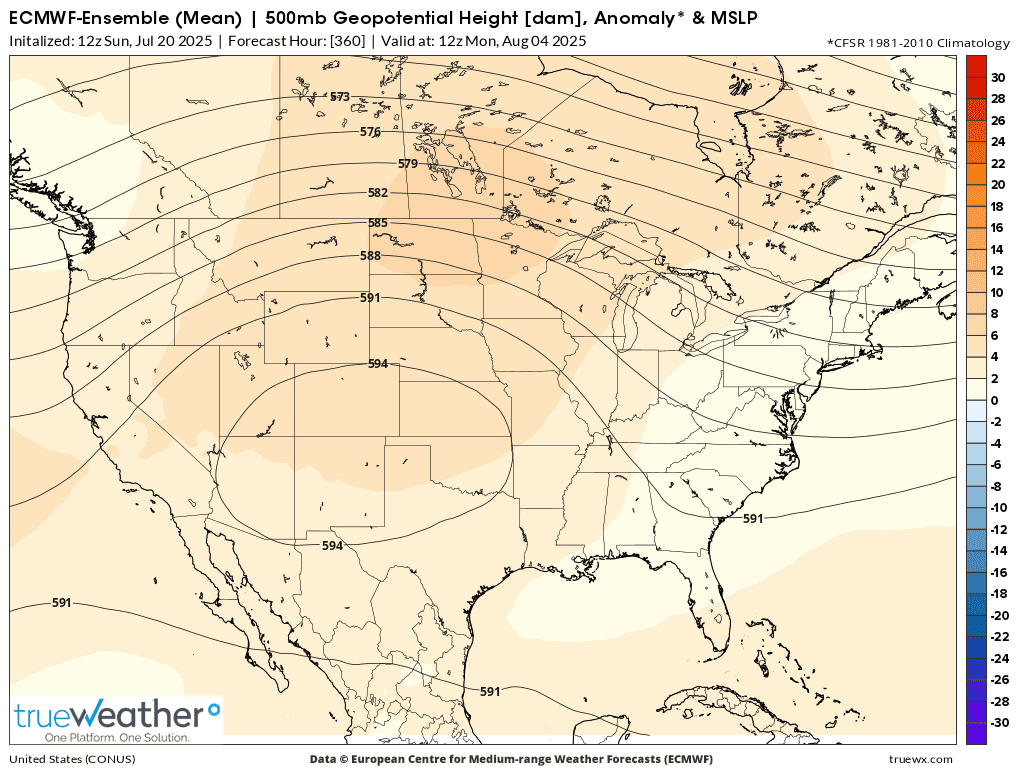
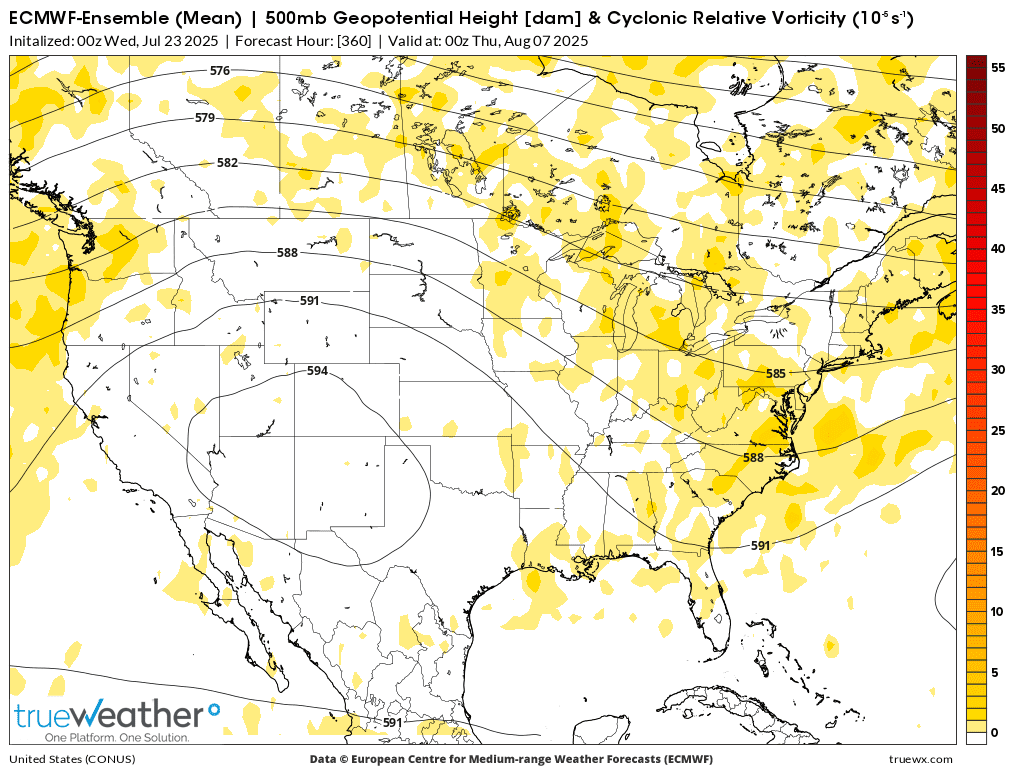
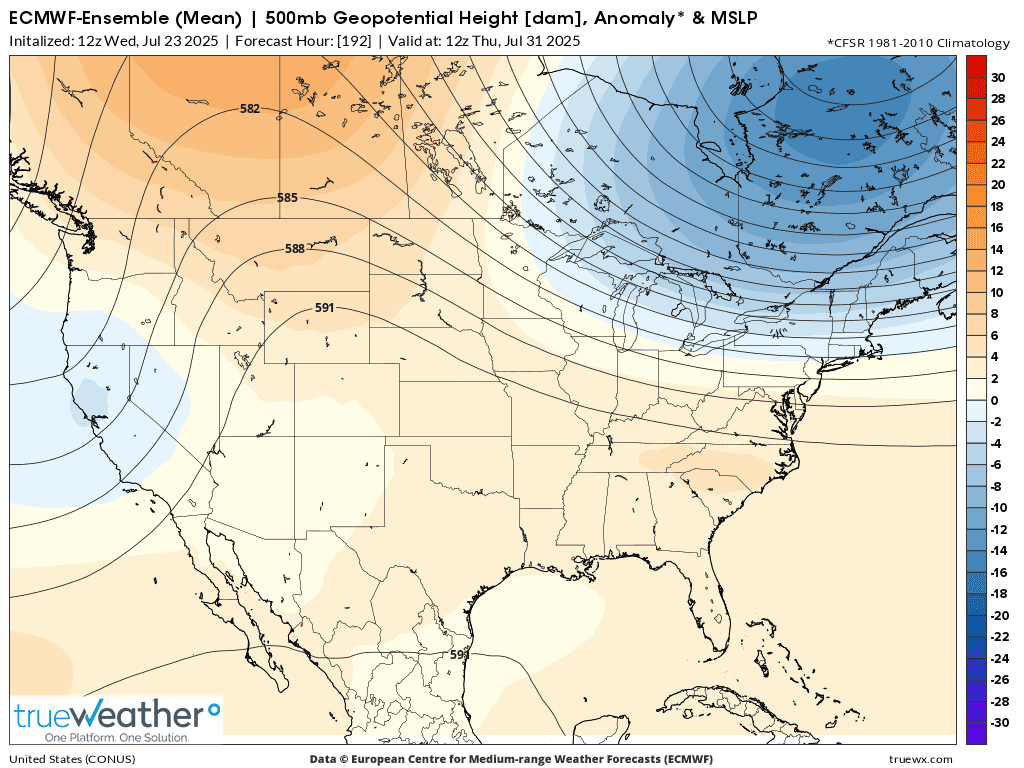
Regardless, here's the last 0z EE model solution at the end, 2 weeks from now. If that verifies there is no way that we are going much lower than we did early last evening. This can change but if not, it's pretty bullish.
There will be rains around the periphery of the DOME, some heavy but temperatures will be MUCH above average, which includes very muggy nights. Very bad for kernel filling of corn, no matter how much rain falls.
Probably inside most of the 594 dm height contour, there will be so warm aloft that it defeats rain making (capping).
This weeks rains and cooler temps are the bearish part:
https://www.marketforum.com/forum/topic/83844/
7 Day Total precipitation below:
http://www.wpc.ncep.noaa.govcdx /qpf/p168i.gif?1530796126
Highs for upcoming week:
https://www.wpc.ncep.noaa.gov/medr/medr_max.shtml
The export numbers hurt the bullish weather spec mentality A bit For the moment. If the European model is right and the other models join in then the lows are in or are close. with it being week 2 weather, things can change.
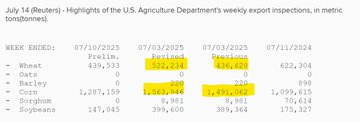
Export inspections for US #soybeans missed expectations last week, #corn was on the lower end and #wheat was toward the higher end. This is the first "bad" number for beans in a while, so it's not problematic yet - esp. after USDA raised old-crop bean exports on Friday.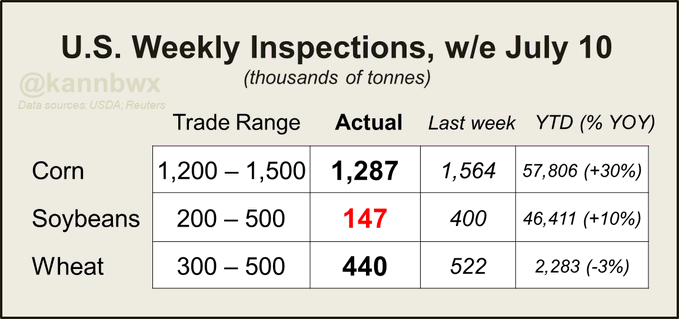
Corn inspections may have fallen toward the low end of trade expectations last week, but they remain safely above average for the time of year. Note some of the revisions to the prior week, esp. in the wheat and corn.
Huge gap and crap selling exhaustion, powerful reversal up formation on the corn chart today.
Beans not quite as impressive with an unch close and off the highs but holding key $10 support and closing above the open last night.
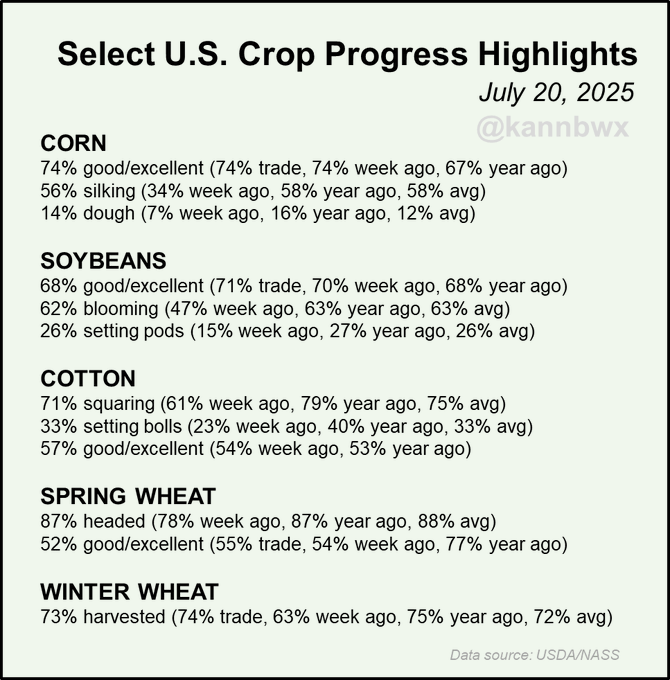
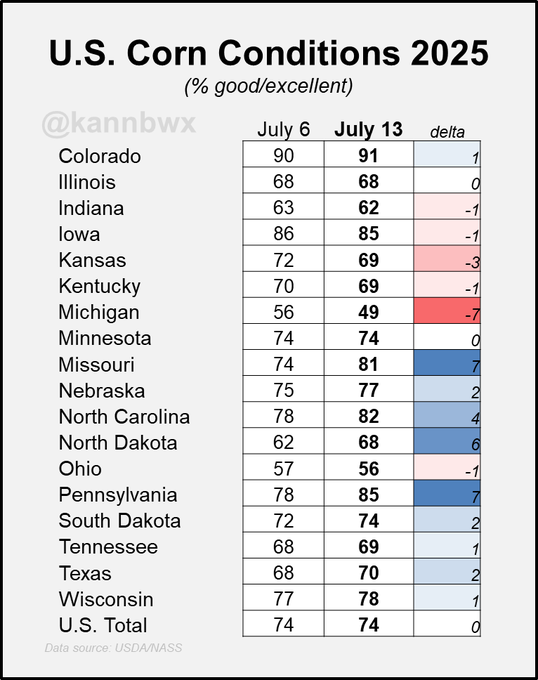
US #corn conditions stay unchanged at 74% good/excellent, but #soybeans and spring #wheat jump on the week by more than expected. Spring wheat at 54% g/e vs 77% a year ago is interesting. USDA predicts 2025 spring wheat yield as second best ever, just 1.5% behind 2024's high.
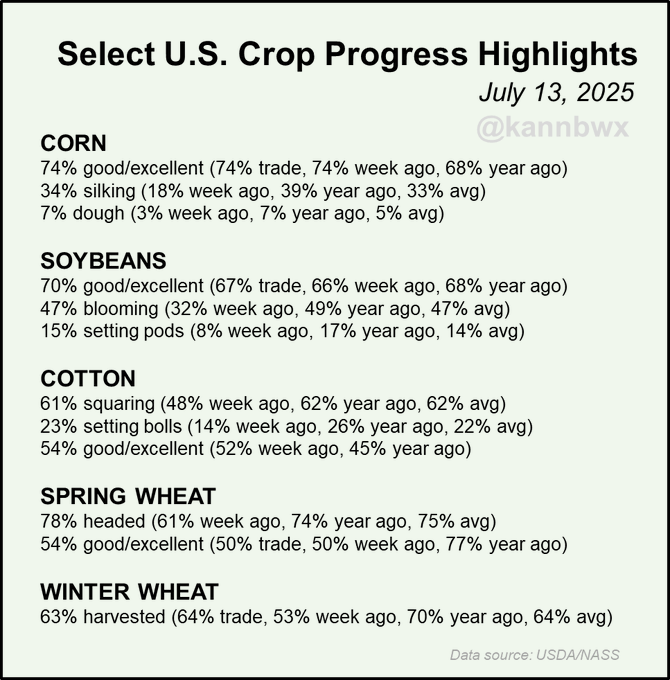
US #corn conditions were unchanged on the week, but there were some shifts by state. Declines in Kansas & Michigan were offset by gains in North Dakota & Missouri.
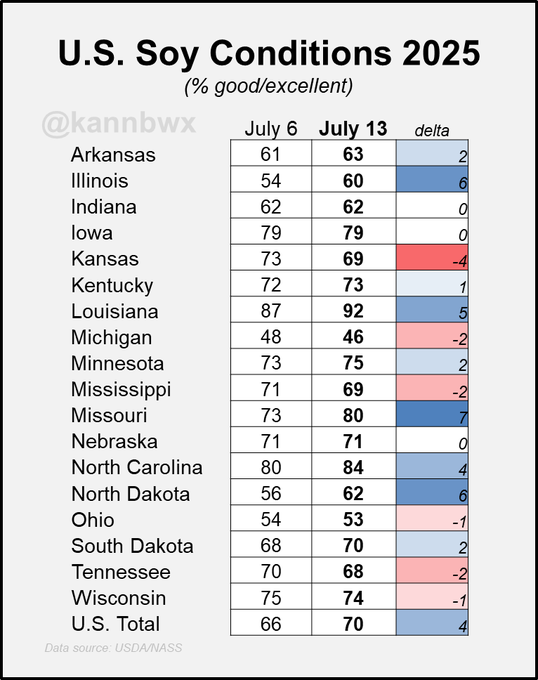
Conditions for US #soybeans jumped 4 points this week to 70% good/excellent, the largest weekly jump since August 2023. Beans had also improved by 4 in this same week in 2023, but such a jump isn't common. Here's the latest numbers by state, incl. +6 in top producer Illinois.
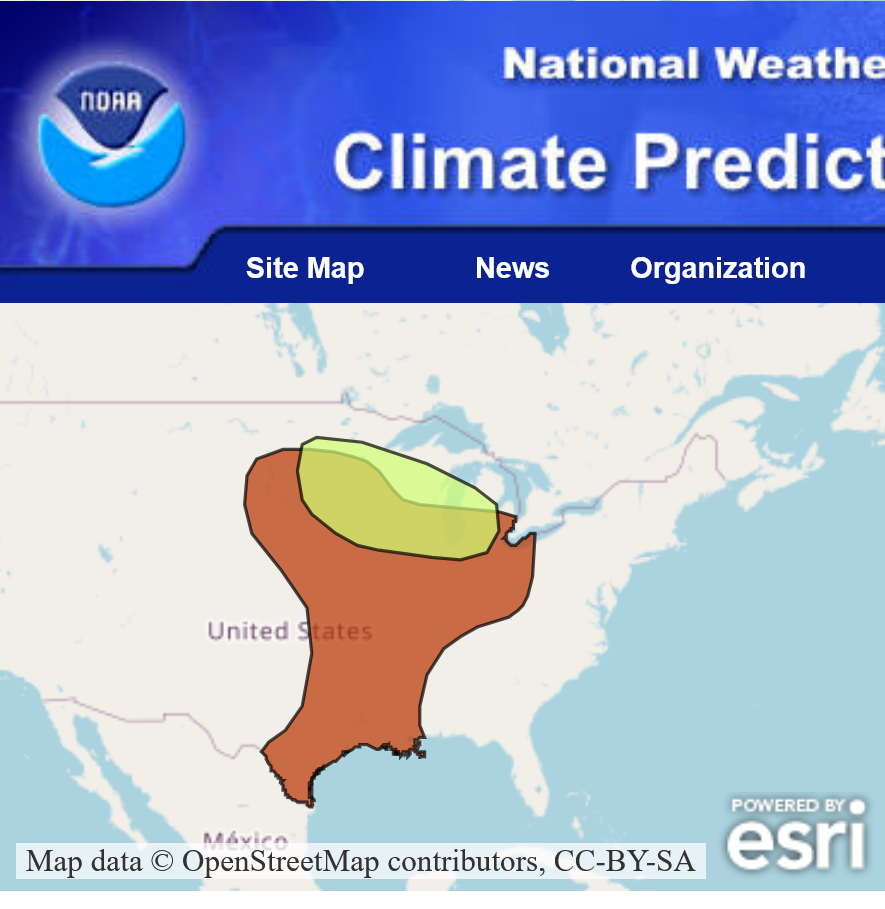
Week 2, days 8-14 threat for heavy rain in green. Brown is the risk for excessive heat. Both in the SLIGHT risk category.
Good rains for much of the Midwest, BAD temps for early kernel fill.
https://www.cpc.ncep.noaa.gov/products/predictions/threats/threats.php
I think that southwest of the heavier rains, warm air aloft could shut down rains completely. Along with the intense heat, we could see a flash drought develop quickly.
Sadly, the US missed out on most of this because of Trumps tariffs.
++++++++++++++++++
US soybean exports to China at risk
++++++++++++++
U.S. SOYBEAN COLLAPSE: 94% of Exports to China Gone — $20B Vanished in Silence
Forecast Rainfall amounts for the next week have gone up a bit. Crop ratings were good with beans exceeding expectations. The week 2 dome is a tad less impressive but still there As a threat to parts of the corn belt.
We need more bullish weather to confirm a bottom not less bullish. The tariffs are adding additional pressure on grains too.
7am: actually, after viewing the last 7 day rain outlook, shown several posts up and updated constantly, we’ve added a lot of week 1 rains to the biggest producing areas!
When Corn is up slightly and beans down slightly, we know that weather can't be a very powerful, 1 way force.
Bean condition improved and exports to China hurting demand. \
Corn has solid demand and HEAT FILL will hurt after pollination, even with good rains.
Week 1 features BEARISH weather. The map/forecast below is constantly updated.
Week 2 is more bullish.
This weeks rains and cooler temps are the bearish part:
https://www.marketforum.com/forum/topic/83844/
7 Day Total precipitation below:
http://www.wpc.ncep.noaa.govcdx /qpf/p168i.gif?1530796126
Another bad day for beans. Corn on the other hand had a 1c gain to keep Mondays powerful, gap and crap selling exhaustion on the price chart valid.
Impressive considering how much rain is coming the next week. Mainly because of what the weather looks like after that with HEAT FILL hurting corn yields, even in wet areas. More in the rapidly developing dry areas of the southwest corn belt.
4pm: The NWS 8-14 day/week 2 forecast is picking up on the area where the warm air aloft from the heat ridge should suppress rising motion and cap the atmosphere, defeating rain making attempts.
https://www.cpc.ncep.noaa.gov/products/predictions/814day/index.php
With so much rain still in week 1, it’s hard to not be very impressed with the strength right now in BOTH corn AND beans that are +10c.
The week 2 heat ridge is doing it.(as well as the rains shutting down in the sw cornbelt)
The NWS is now getting fully on board with the rains shutting down close to the center of the heat ridge in the sw cornbelt.
https://www.cpc.ncep.noaa.gov/products/predictions/610day/
https://www.cpc.ncep.noaa.gov/products/predictions/814day/814prcp.new.gif
Not much change to the big weather picture.
Bearish week 1.
Bullish week 2.
Export sales were pretty bad
The weaker dollar this year should have INCREASED sales but tariffs destroy free trade both ways and hurt our exports(while increasing prices to US consumers). In some cases with permanent losses after our trading partners form new relationships to replace the one(s) they had with us.
This is why the large specs have been pounding the grains lower since Trump first announced his tariffs nonsense over 3 months ago.
Regardless, the huge fund short is vulnerable here if the bullosh week 2 weather continues in week 3.
Export Sales Highlights
https://apps.fas.usda.gov/export-sales/highlite.htm
This summary is based on reports from exporters for the period July 4-10, 2025.
Wheat:Net sales of 494,400 metric tons (MT) for 2025/2026 were down 13 percent from the previous week, but up 8 percent from the prior 4-week average. Increases primarily for Mexico (83,500 MT, including decreases of 23,700 MT), Venezuela (71,600 MT, including 23,000 MT switched from unknown destinations and decreases of 100 MT), South Africa (51,800 MT, including 50,000 MT switched for unknown destinations), Japan (49,100 MT), and Peru (47,000 MT, including decreases of 5,300 MT), were offset by reductions for El Salvador (8,700 MT). Exports of 432,900 MT were down 3 percent from the previous week, but up 7 percent from the prior 4-week average. The destinations were primarily to Mexico (153,700 MT), the Philippines (66,000 MT), South Africa (51,800 MT), South Korea (51,000 MT), and Japan (35,100 MT).
Corn: Net sales of 97,600 MT for 2024/2025--a marketing-year low--were down 92 percent from the previous week and 89 percent from the prior 4-week average. Increases primarily for Japan (187,900 MT, including 183,600 MT switched from unknown destinations and decreases of 2,900 MT), Colombia (78,600 MT, including 74,700 MT switched from unknown destinations and decreases of 6,100 MT), South Korea (77,100 MT, including 65,000 MT switched from unknown destinations and decreases of 200 MT), the United Kingdom (44,000 MT), and Egypt (33,100 MT, including 32,000 MT switched from unknown destinations), were offset by reductions for unknown destinations (390,700 MT) and Mexico (79,300 MT). Net sales of 565,900 MT for 2025/2026 primarily for unknown destinations (287,100 MT), Mexico (175,900 MT), Japan (65,000 MT), the United Kingdom (18,000 MT), and Nicaragua (14,700 MT), were offset by reductions for Honduras (1,000 MT) and Guatemala (100 MT). Exports of 1,210,700 MT were down 28 percent from the previous week and 24 percent from the prior 4-week average. The destinations were primarily to Japan (299,900 MT), Mexico (280,200 MT), South Korea (271,800 MT), Colombia (111,000 MT), and Taiwan (76,100 MT).
Soybeans: Net sales of 271,900 MT for 2024/2025 were down 46 percent from the previous week and 39 percent from the prior 4-week average. Increases primarily for Taiwan (68,800 MT, including decreases of 400 MT), Germany (63,400 MT), Algeria (32,000 MT), Egypt (25,400 MT, including 22,000 MT switched from unknown destinations), and Vietnam (25,400 MT, including decreases of 100 MT), were offset by reductions for Mexico (9,200 MT) and Venezuela (2,000 MT). Net sales of 529,600 MT for 2025/2026 were primarily for Mexico (326,600 MT), unknown destinations (102,000 MT), Japan (50,000 MT), Vietnam (18,900 MT), and Indonesia (16,900 MT). Exports of 276,400 MT were down 30 percent from the previous week and 8 percent from the prior 4-week average. The destinations were primarily to Germany (63,400 MT), Mexico (44,600 MT), Indonesia (32,700 MT), Japan (26,200 MT), and Egypt (25,400 MT).
Beans have been leading the charge higher, with bean oil being especially strong and key August weather outlooks looking hot/dry.
The NWS is pretty much in tuned with my forecast. Week 3 right now could feature the dome backing up farther west again..........or it might have staying lower this time.
Sunday Night's weather forecast could be the most important one so far this year!
These week 1 rains will be shifting northeast next week! The southwest 30-50% of the Cornbelt should be pretty hot and dry during the last week of July!
7 Day Total precipitation below:
http://www.wpc.ncep.noaa.govcdx /qpf/p168i.gif?1530796126
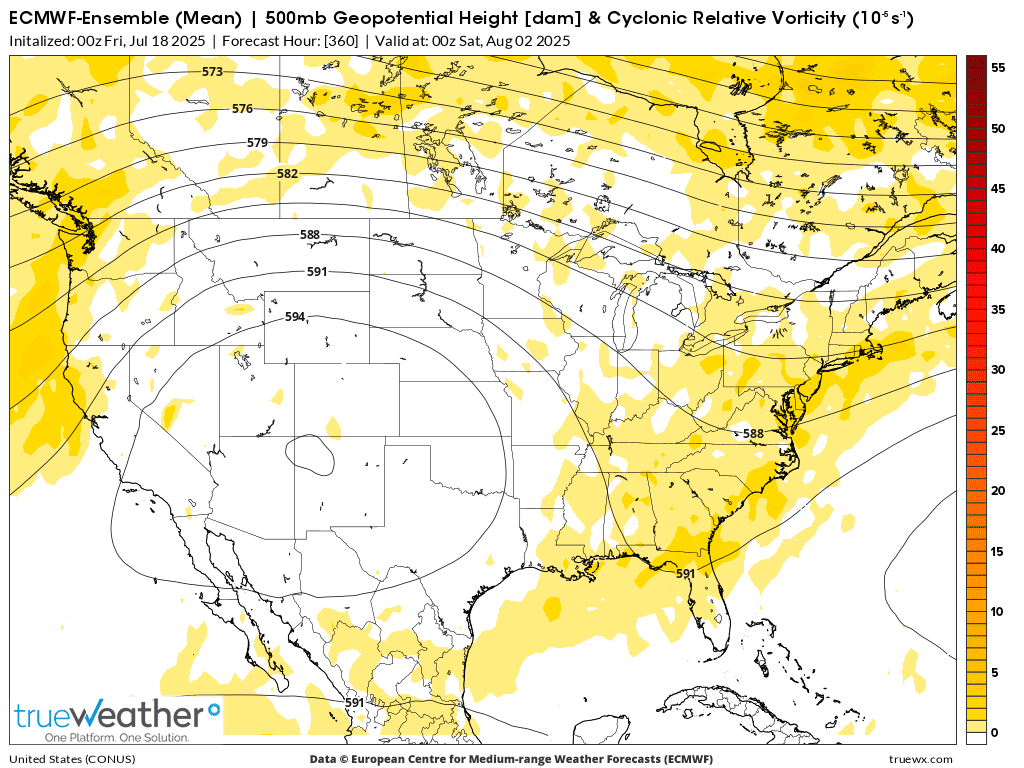
1. This was the last 0z European Ensemble model CDDs on the right in purple. Close to the previous 12z run from 12 hours earlier. Intense heat next week but COOLING OFF in week 2 as the dome/heat ridge backs up to the Rockies to start August.
2. August 2nd 500 mb map with vorticity. Any vorticity perturbations coming around the periphery of the dome will trigger clusters of shwrs/tstorms.

I'll disagree with this just out LOW skill week 3-4 forecast since the latest end of week 2 guidance is backing up the dome farther west (along with most guidance after that) NOT putting it this far east and has troughing in the east.
If this verifies, however the August weather will be pretty bullish.
https://www.cpc.ncep.noaa.gov/products/predictions/WK34/
12z European Ensemble 500 mb map on August 2nd. Heat ridge/Dome is retrograding west towards the S/C.Rockies/Plains. Weak troughing along the East Coast which will cool things off in the East.
https://www.marketforum.com/forum/topic/83844/#83853
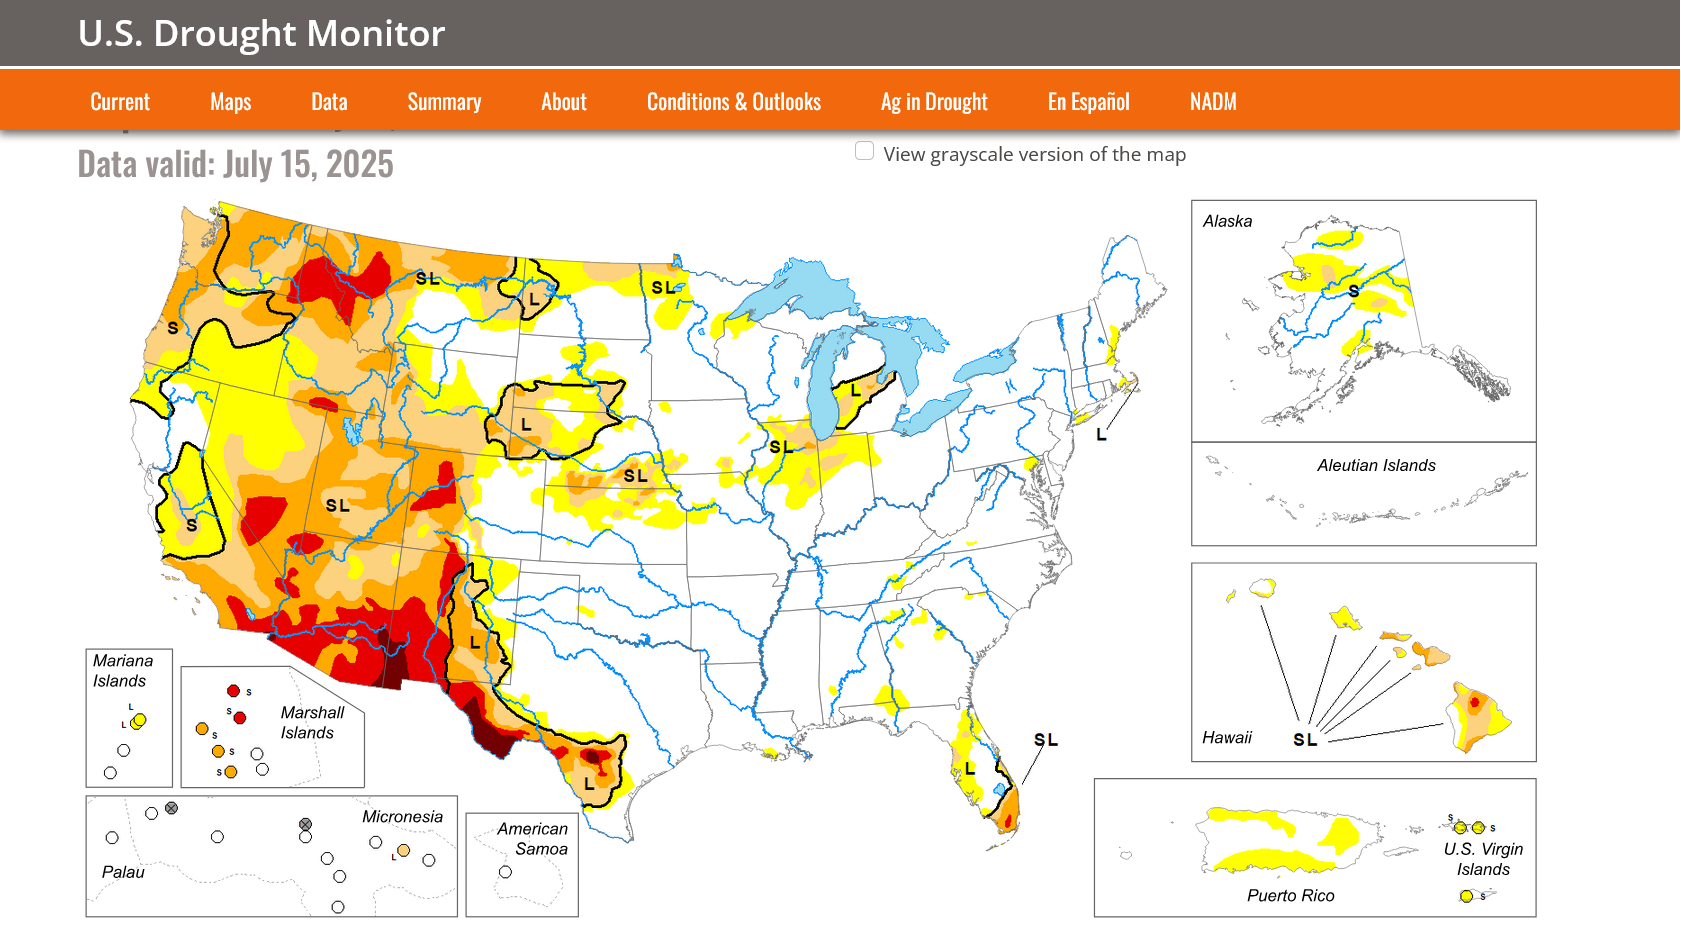
https://www.drought.gov/current-conditions
June 18, 2025 - June 24, 2025
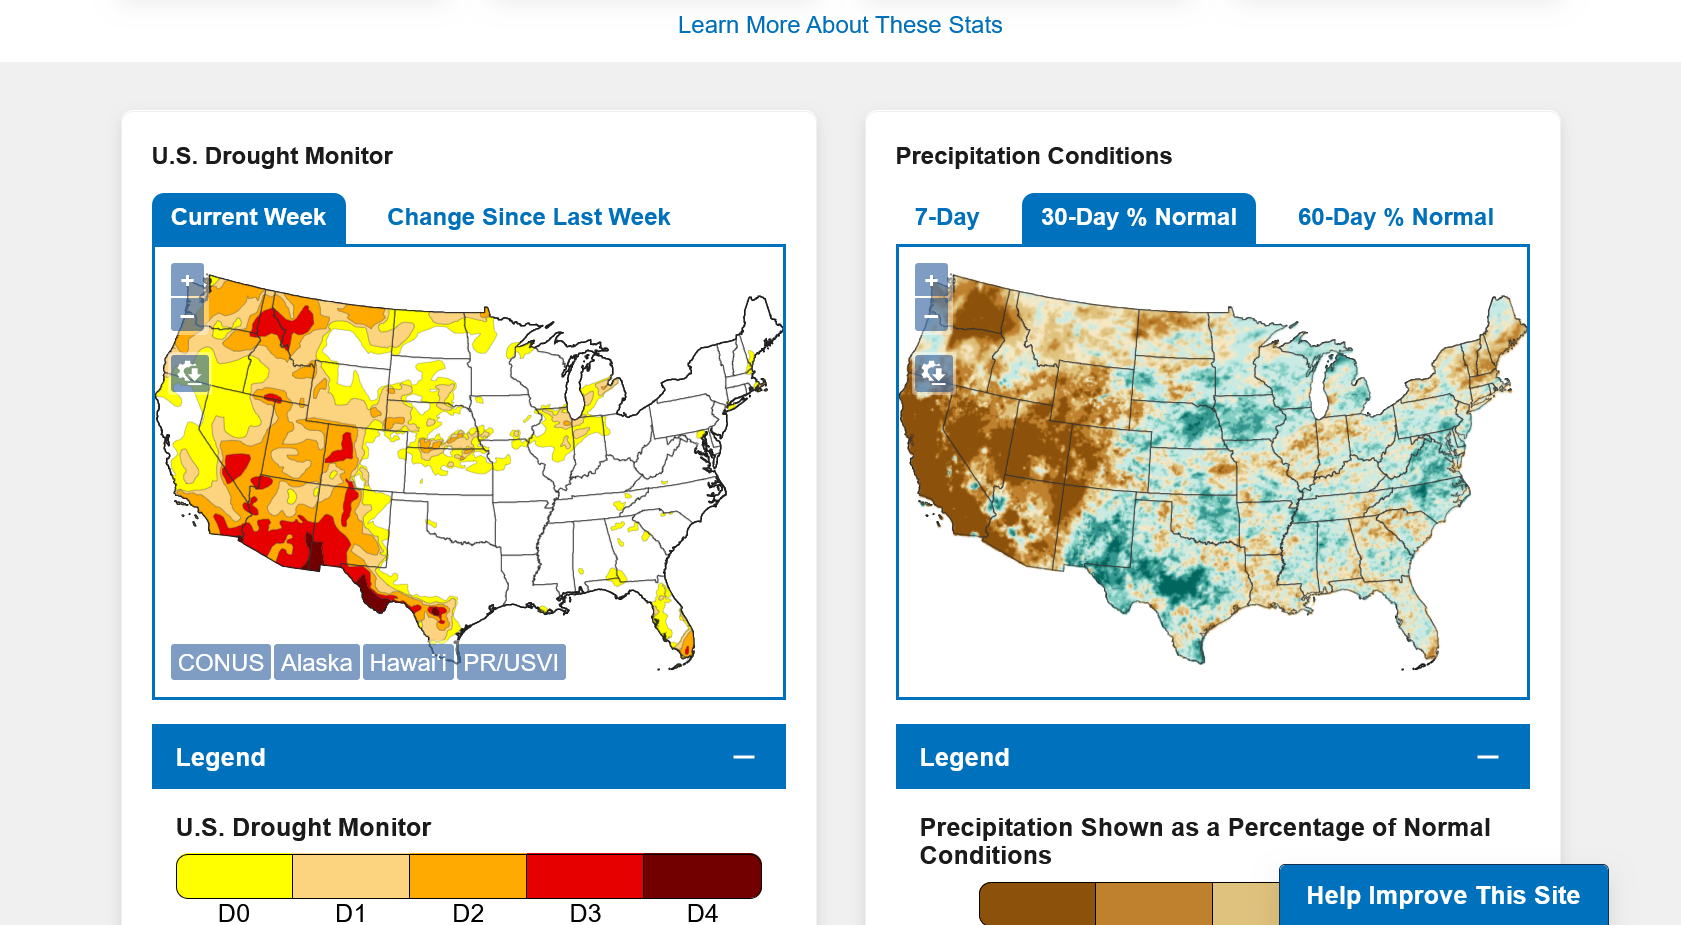
DROUGHT MONITOR
https://droughtmonitor.unl.edu/
Drought area in the Cornbelt has been almost completely eliminated!!!
https://www.marketforum.com/forum/topic/83844/#83848
7 Day Total precipitation below:
http://www.wpc.ncep.noaa.govcdx /qpf/p168i.gif?1530796126
Will you be able to give weather update before grains open? Bullish weather confirming? Cycle would suggest confirmation.
thank you in advance
I'm NOT bullish for grains based on weather. The week 2 dome of death is looking LESS impressive. The models all Summer have OVER forecast it and that's happened again.
Recent rains have almost wiped out all the dry spots in the Cornbelt. We actually need dry weather here in southern IN. I got 4.1 inches yesterday after 1.5 inches on Friday after half a dozen small rains the previous week.
RAINS THE PAST 7 DAYS:
https://www.wunderground.com/maps/precipitation/weekly
The one dry area left in the Cornbelt could get some decent rain. Best chance there will be the next 24 hours, then again at the end of the week.
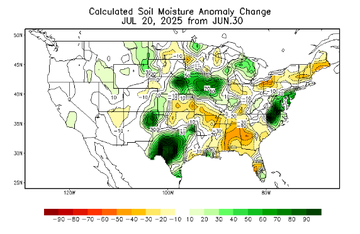
https://www.cpc.ncep.noaa.gov/products/Soilmst_Monitoring/US/Soilmst/Soilmst.shtml#
![]()
7 Day Total precipitation below:
http://www.wpc.ncep.noaa.govcdx /qpf/p168i.gif?1530796126
+++++++++++++++++
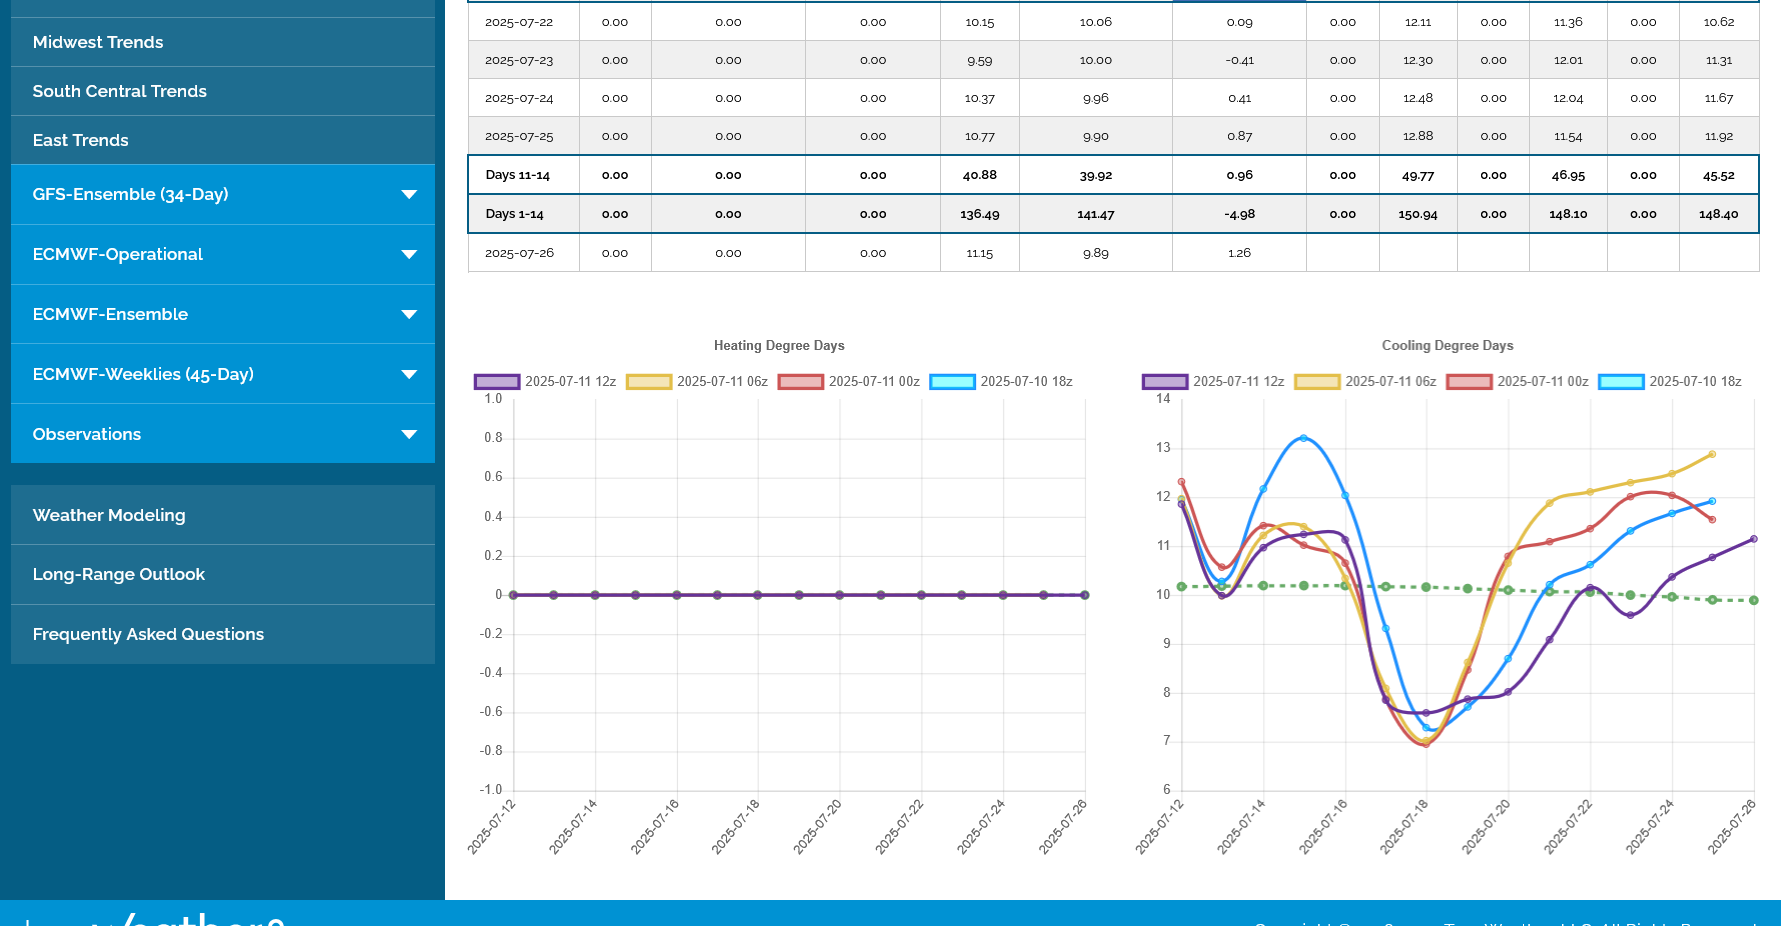
Look at the last 4 runs of the GEFS for CDDs in just the Midwest the next 2 weeks on the right. Purple is the last 12z run.
After the brief spike higher in heat this week, the trajectory is significantly LOWER from less and less heat. Temperatures even get down to around average towards the end of week 2 before the next heat wave starts to build for week 3.
+++++++++++++++++++++
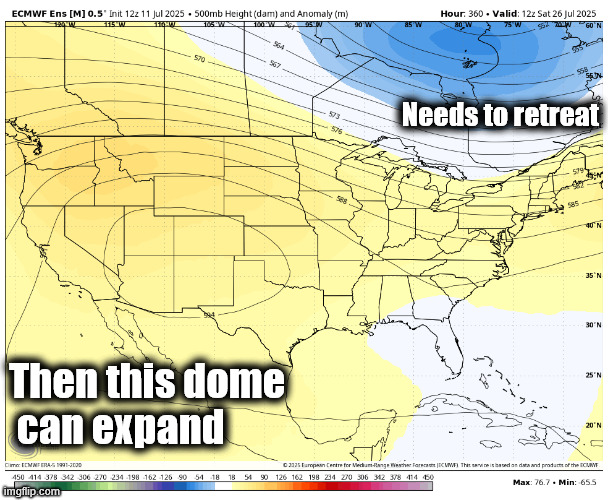
Here's the last 500 mb map of the 12z European Ensemble model. The dome is in a threatening position and for sure the southwest cornbelt will have high heat, with warm air aloft suppressing rain making/producing a cap.
However, around the periphery of the dome, there could be perturbations with rain chances that keep the dome from expanding. Soils this wet in late July often make it very difficult for a dome to shift in.
The positive tilt orientation of the dome makes one think that its positioned to build farther northeast and become bullish BUT IT NEVER DOES! And now we are looking at early August. This is the Boy that cried Wolf dome.
Crop ratings on Monday, if anything may increase a tad at a time of year when they seasonally decline from heat and declining soil moisture.
All things considered, every day that passes is another day closer to making the crop and harvest. Funds have big shorts already and the corn had a powerful gap and crap, selling exhaustion lower to start last week but that was with the week 2 models looking MUCH more bullish than this. Widespread bullish weather could provide a huge move up. However, it looks like the main bullish weather will be confined to NE/KS/MO and points south of that which means the VAST majority of the Cornbelt weather is not bullish right now.
This could shift quickly to the north but the wet soils will make that tougher.
The market is NOT going to care about this low skill August forecast that came out last week but here it is. It's NOT bullish either.
https://www.cpc.ncep.noaa.gov/products/predictions/30day/
MetMike
You outdid even yourself on this very comprehensive report.
Looks like we start the week lower!
You're very welcome, tjc!
Previous analysis remains valid and market impact was confirmed.
Overnight weather model solutions were similar and the response by traders to the less bullish/more bearish weather compared to last week is causing lower to sharply lower prices on Monday
Honestly, I thought that we might be even weaker than this but CZ=-6c and SX=-12c is a bearish day.
++++++++++++++
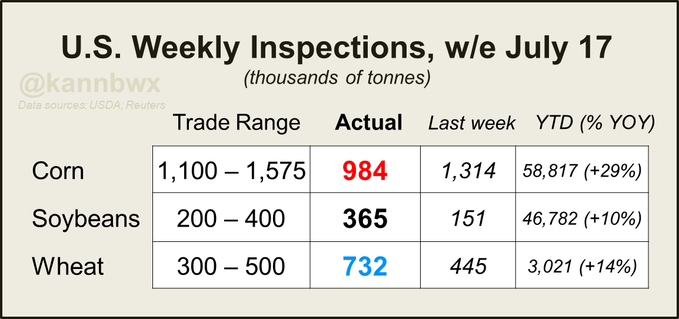
Holy #wheat inspections! Well above trade estimates and the week's best since 2008. However, #corn export inspections slipped below expectations last week - the lowest since early January. Not too shabby for #soybeans, but nothing inspected for China.
Funds cut their net short position in CBOT #corn futures & options last week to about 175k contracts, mostly on short covering. Specs have been bearish corn for two months now, but to nowhere near the year-ago degree (record short). Told you the chart would be back.... 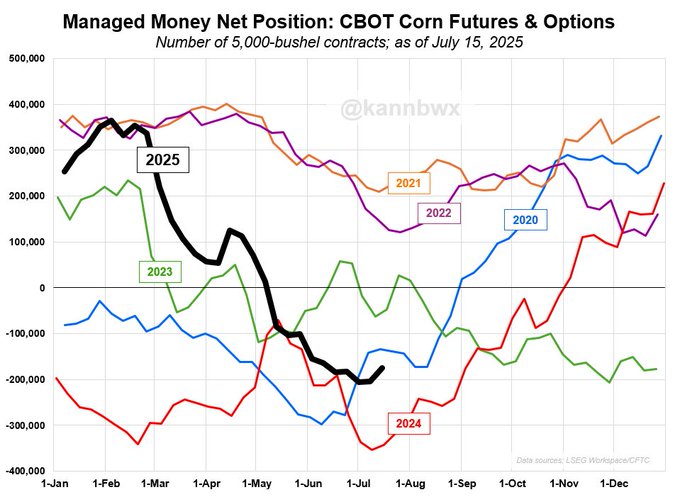
This last 12z GEFS was MORE bullish/LESS bearish but still bearish overall. That might have been why we had the late session bounce up.
This market acts like it wants to go higher, and that a bottom is in IF the weather would turn bullish. A huge fund short makes it vulnerable by providing short covering ammo IF the weather turns bullish.
++++++++++++++++++
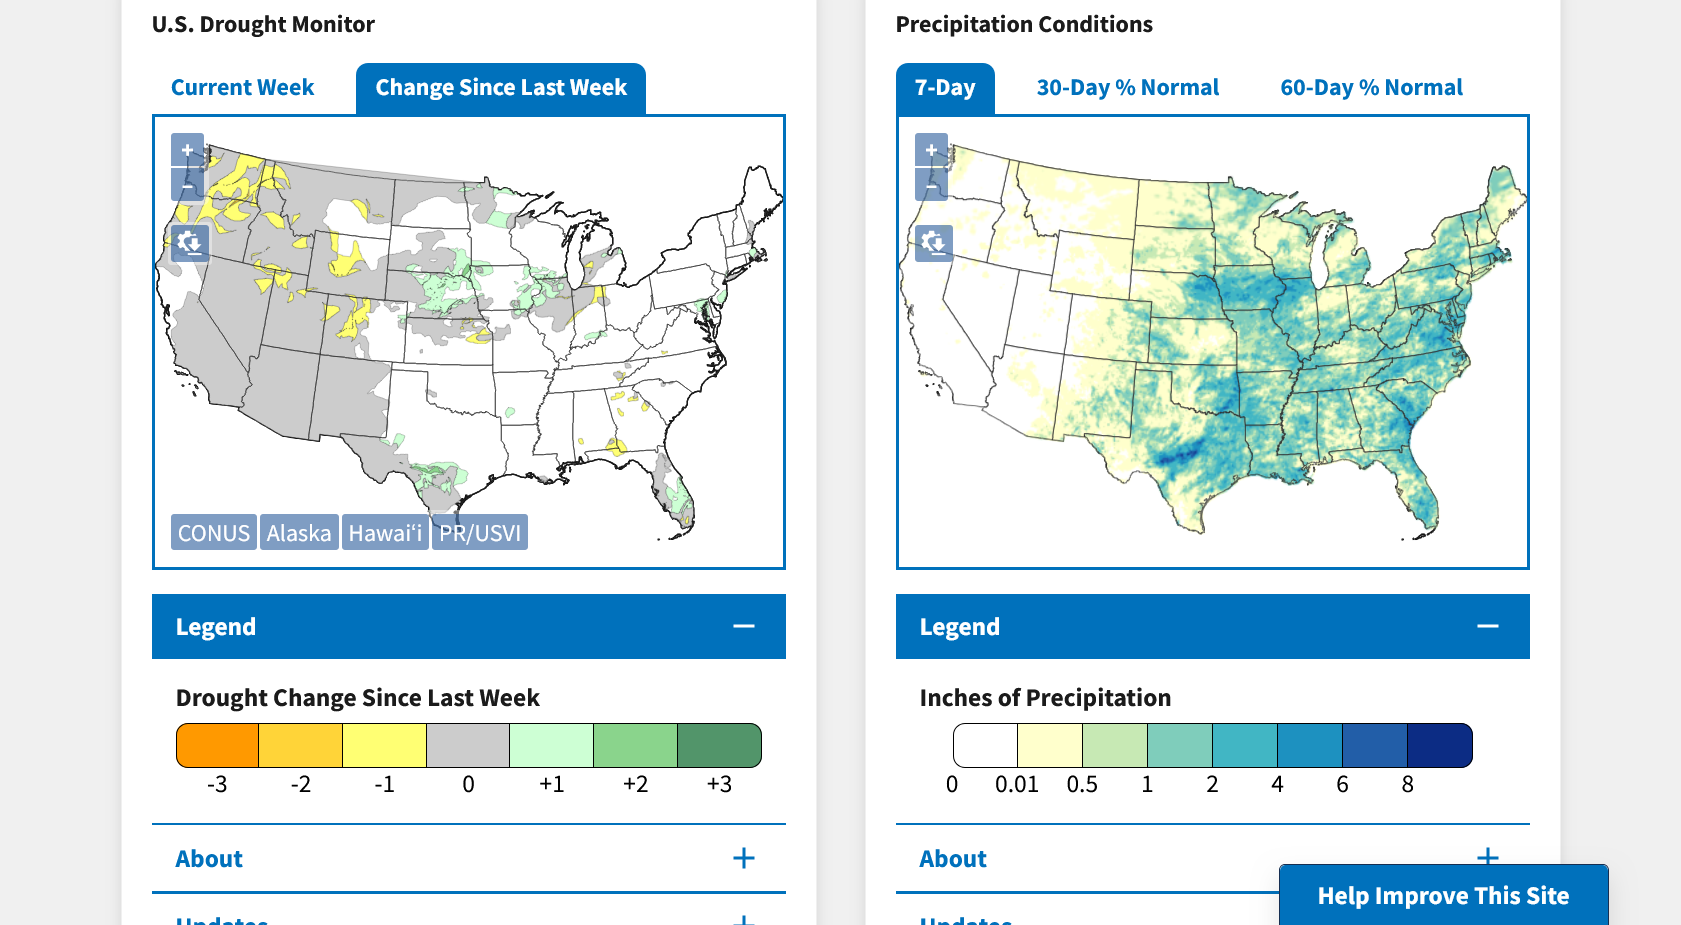
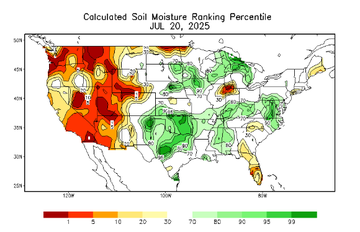
Not much drought to be discussed across the US Corn Belt lately. In fact, things have gotten significantly wetter over the last three weeks in Iowa and eastern Nebraska. Although soil moisture concerns have retreated for now, #soybeans still need good rains through August.
+++++++++++++++++++++++
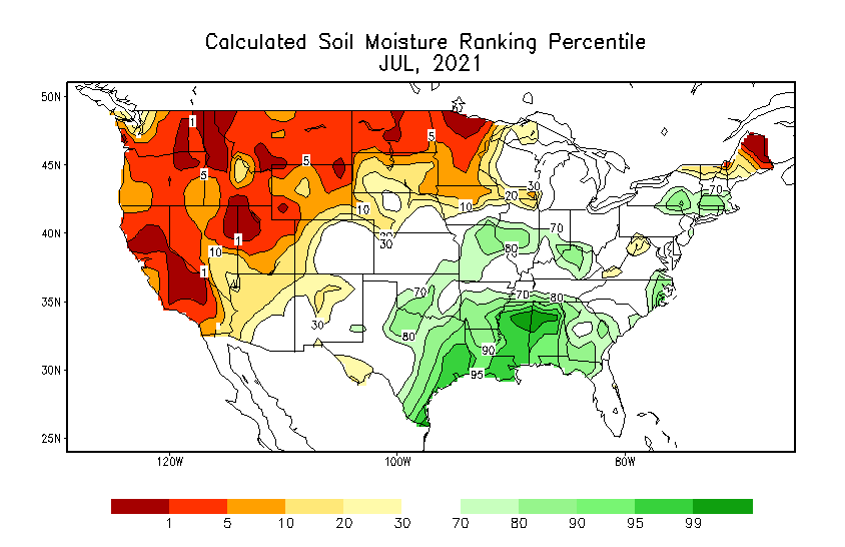
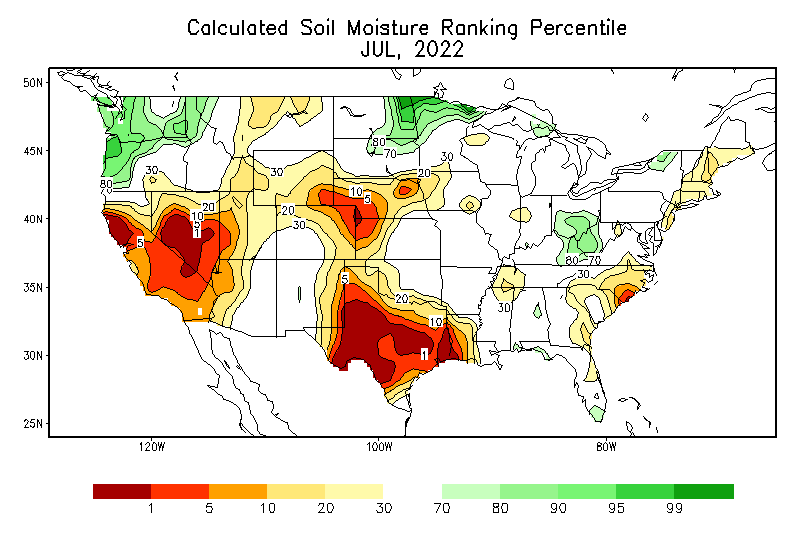
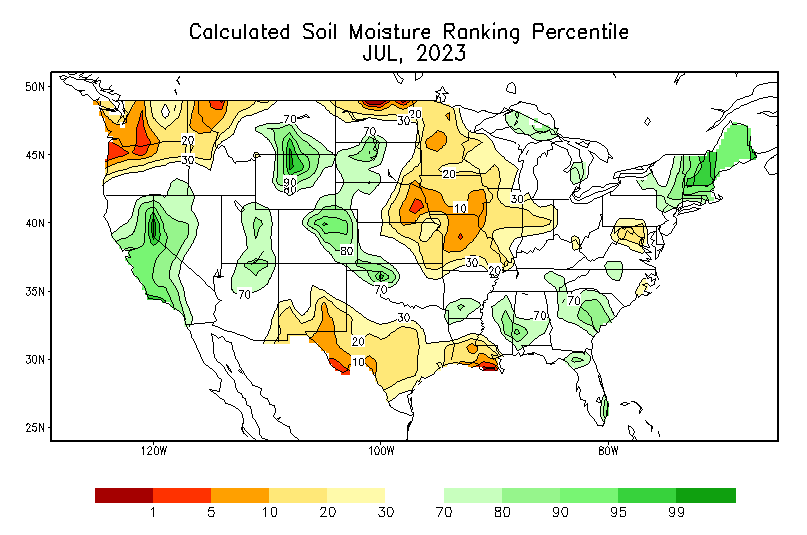
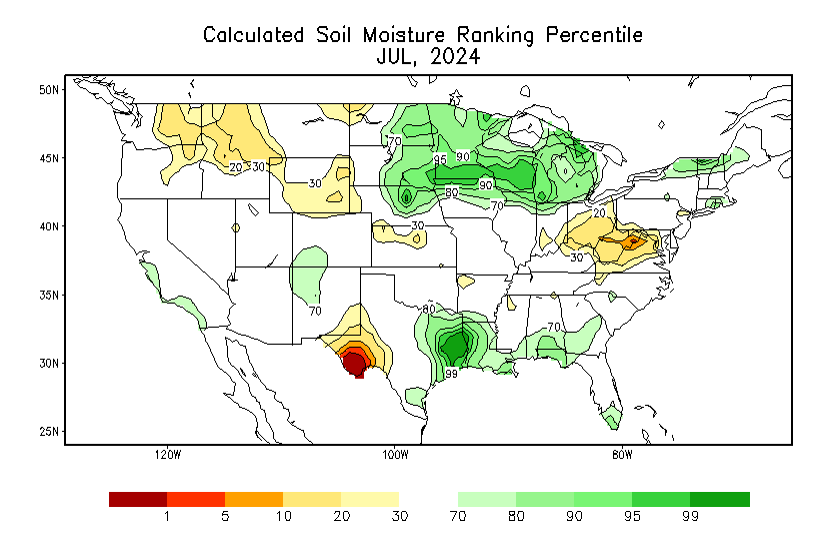
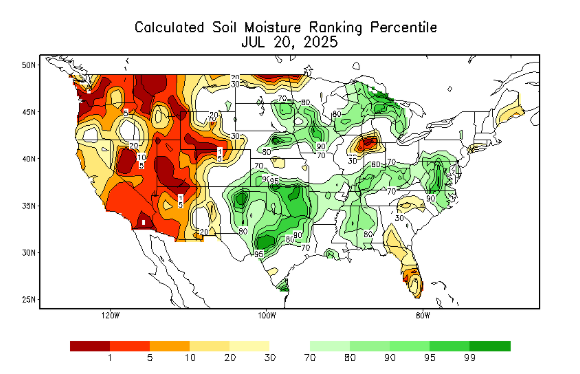
Interesting to compare soil moisture rankings against the past four Julys. Note the 2025 one (above) is daily not monthly, so it will appear more severe. Gives you the idea, though. Moisture was also decent across much of the Corn Belt last year, though 2023 was widespread dry.
US corn conditions were unchanged on the week, as expected, but soybean ratings declined from a week ago despite analyst predictions for a small improvement. Spring wheat ratings also dropped against expectations.
US corn conditions were unchanged on the week, as expected, but soybean ratings declined from a week ago despite analyst predictions for a small improvement. Spring wheat ratings also dropped against expectations.
metmike: Beans were -3% vs trade expectations this week. However., last week the beans were +3% vs expectations.
Not sure if this means these reports have a big margin of error, which makes sense because it only represents a small X% of farms.
Most of the time, they are close to reflecting what the weather impact should have caused.
The weather is even MORE bearish overnight!
What has happened is the same thing that has been happening all Summer to prevent the "Dome of Death" from moving into the Midwest. THE NORTHERN STREAM WAS UNDERPREDICTED at longer time frames(week2 ) again!
These were the CDDs for just the Midwest from the last 0z European Ensemble model: -8 CDDs compared to the previous, already cooler 12z run actually BELOW average temps in week 2!
Good rain chances continue with perturbations around the periphery of the heat ridge that stays southwest of the Cornbelt with the Midwest in active, northwest flow.
The biggest, impossible to calculate risk to the bears here, by far is if Trump makes another change to his tariffs(26 changes since April) and announces a deal with China that suggests China will resume buying soybeans(soybean exports to China have been near 0 because of Trump's tariffs and bean prices dropped because of it).
Ryan Gentle
++++++++++++++++++
Corn that looked this way last week in the state of Illinois must have pollinated back in June! I'm not familiar enough with this phenomena to know how impactful it really is but will guess, not very much.
MetMike
"This market acts like it wants to go higher">
Totally agree. Do not know (dry/heat), but the lows just might be in!!
Know where you are wrong.
"Shoulda" bought the least negative, bean oil!!!
https://tradingeconomics.com/commodity/soybeans
Soybeans: 1 year. a)Uptrend since the late August 2024 low.
b) Strong resistance ~1075 which has been tested 4 times in the last year.
c) Steep down channel since the June 18 low. Tested on July 3 and July 18.
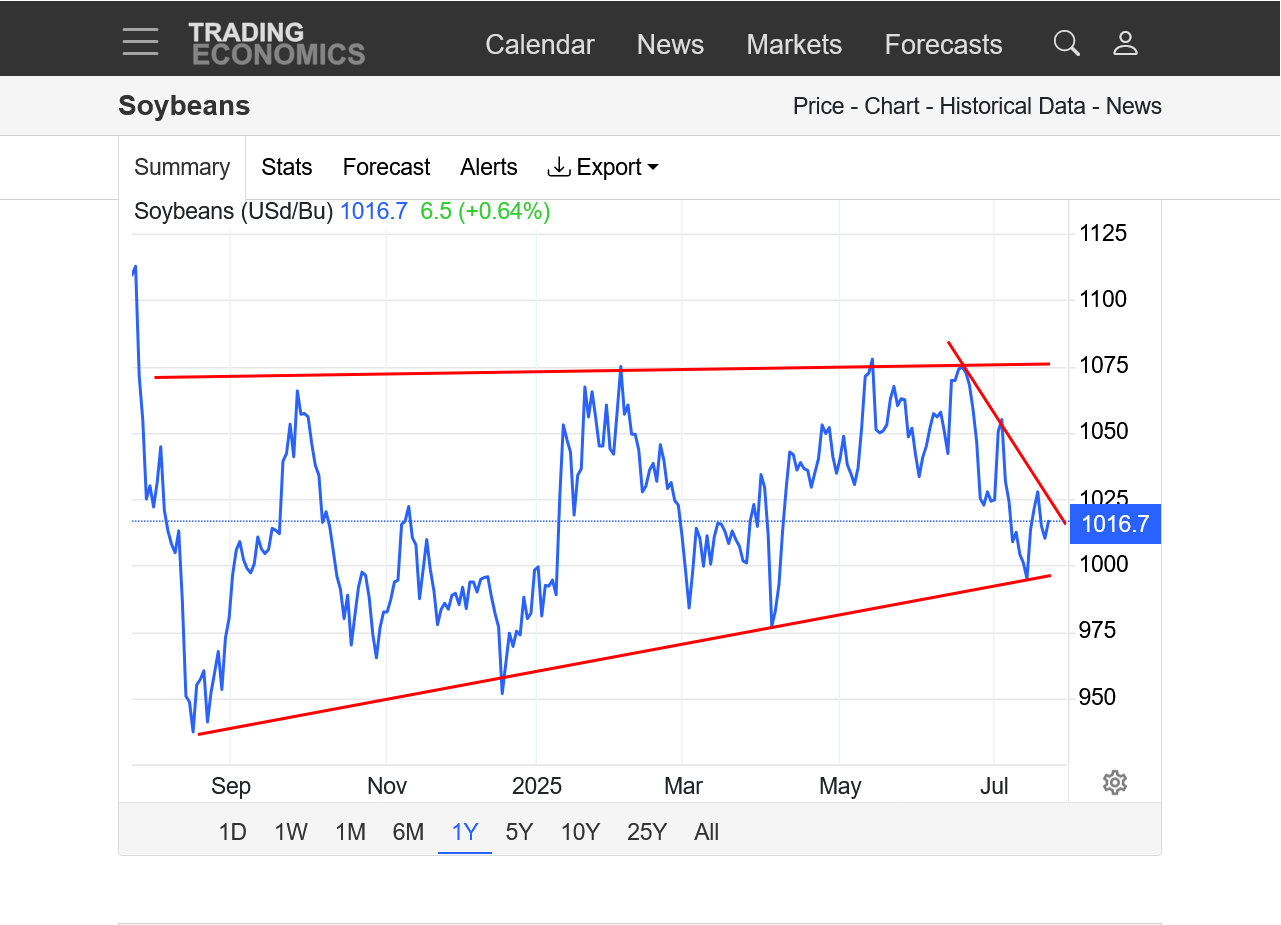
If not for Trump's tariffs and China buying no soybeans for many months, beans would likely have broken out to the upside. China is getting all their beans from South America. Those sales are lost forever.
If we aren't careful, tariffs thru the rest of this year will REALLY hurt because that is often the best time for us to sell the new crop.
MetMike/Forum
Record high Lows projected for many consecutive days. Lows significantly above 70 degrees. NO cooling at night. Yield loss?
Thanks, tjc. No way!!!
Soil moisture is as good as its been in any growing season. I'm thinking that its been a bit TOO wet in some places for beans that don't like wet feet.
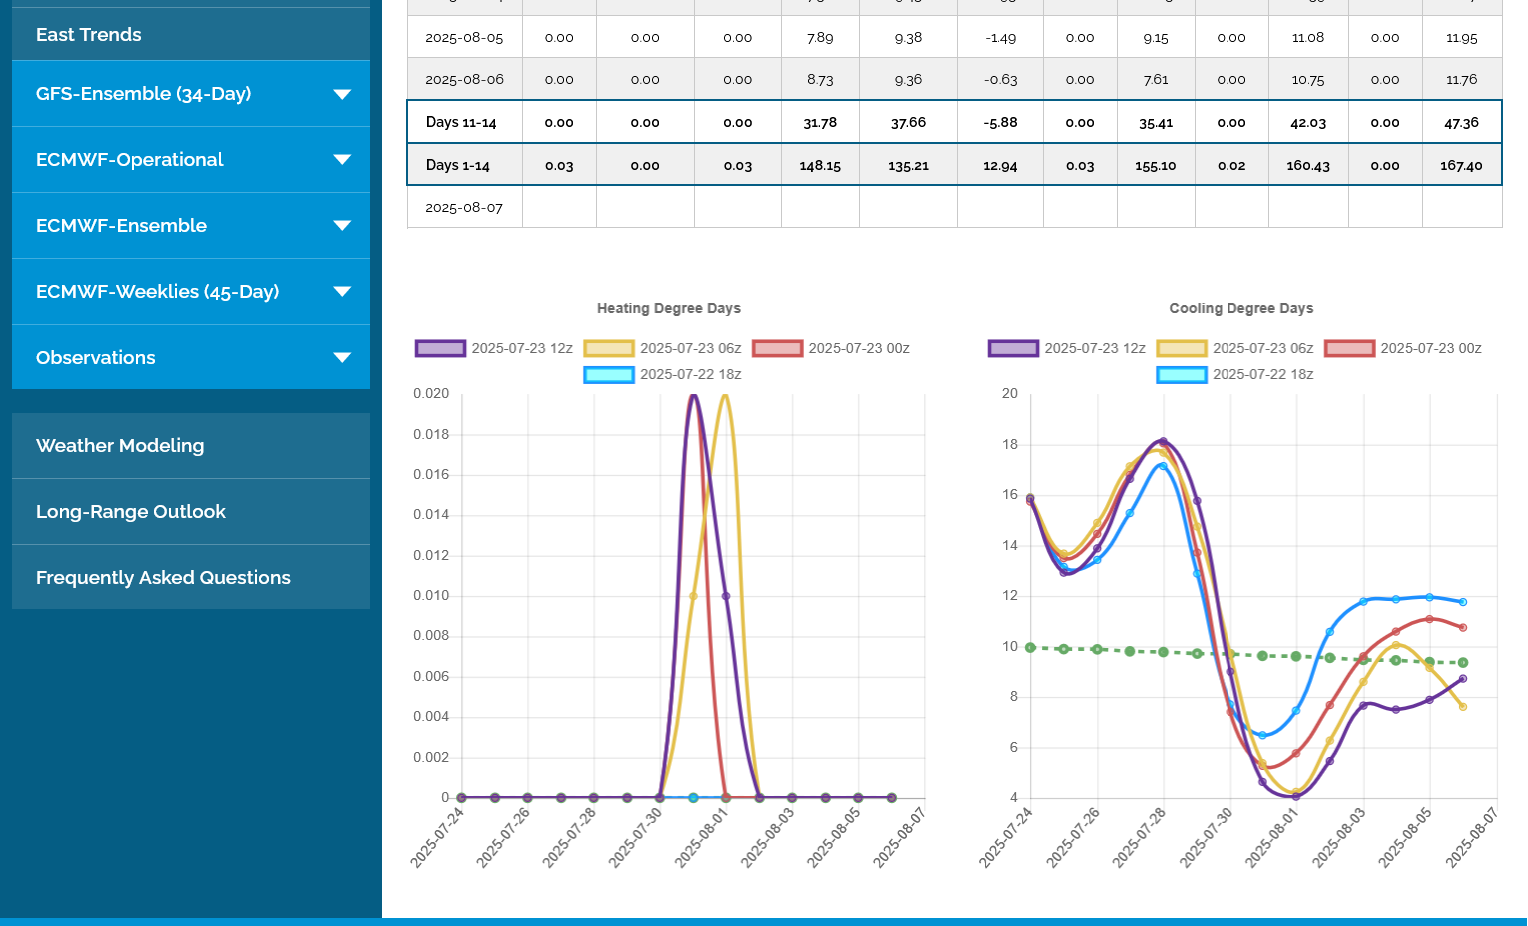
These are NOT record highs either and the week 2 forecast has shifted cooler and cooler and cooler since last week.
These were the last 2 CDD forecasts for just the Midwest from the European Ensemble model. The last 1 in purple.
Temperatures are now predicted to actually be BELOW average in much of the Midwest during the first week of August, with northwest flow and the dome waaay far to the southwest and no longer a threat in week 2.
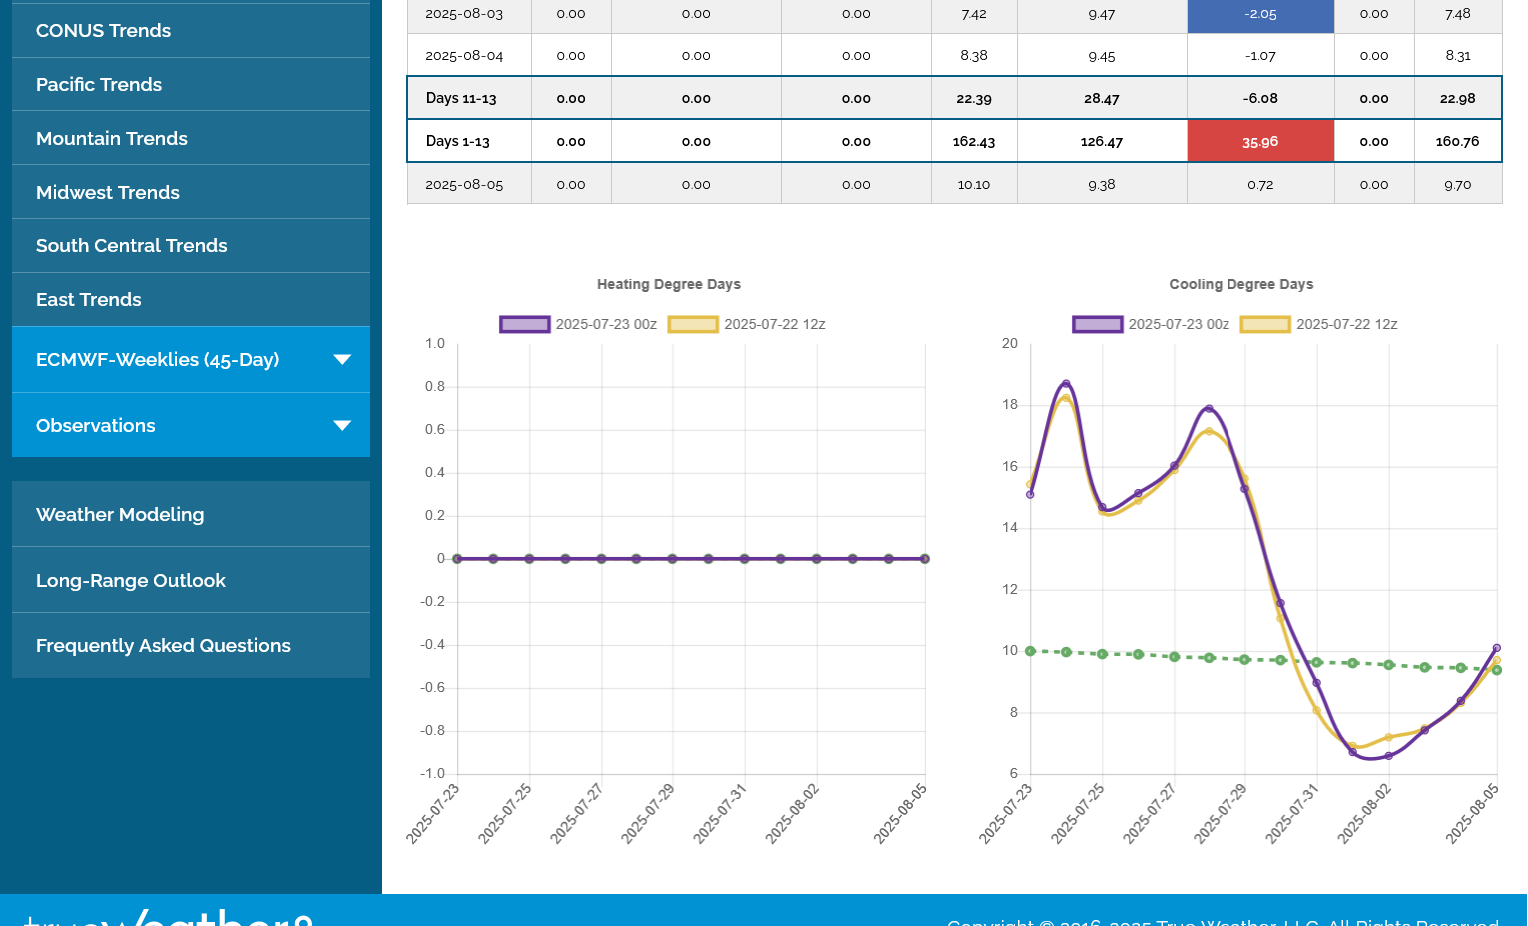
Perturbations in the northwest flow will continue rain chances, with the dome no longer a threat in week 2. This is the August 7, map for 500 mb from the EE. BEARISH!
Total 2 week rains from the just out 6z GEFS. The southwest Cornbelt will be drying out but tons of rain elsewhere:
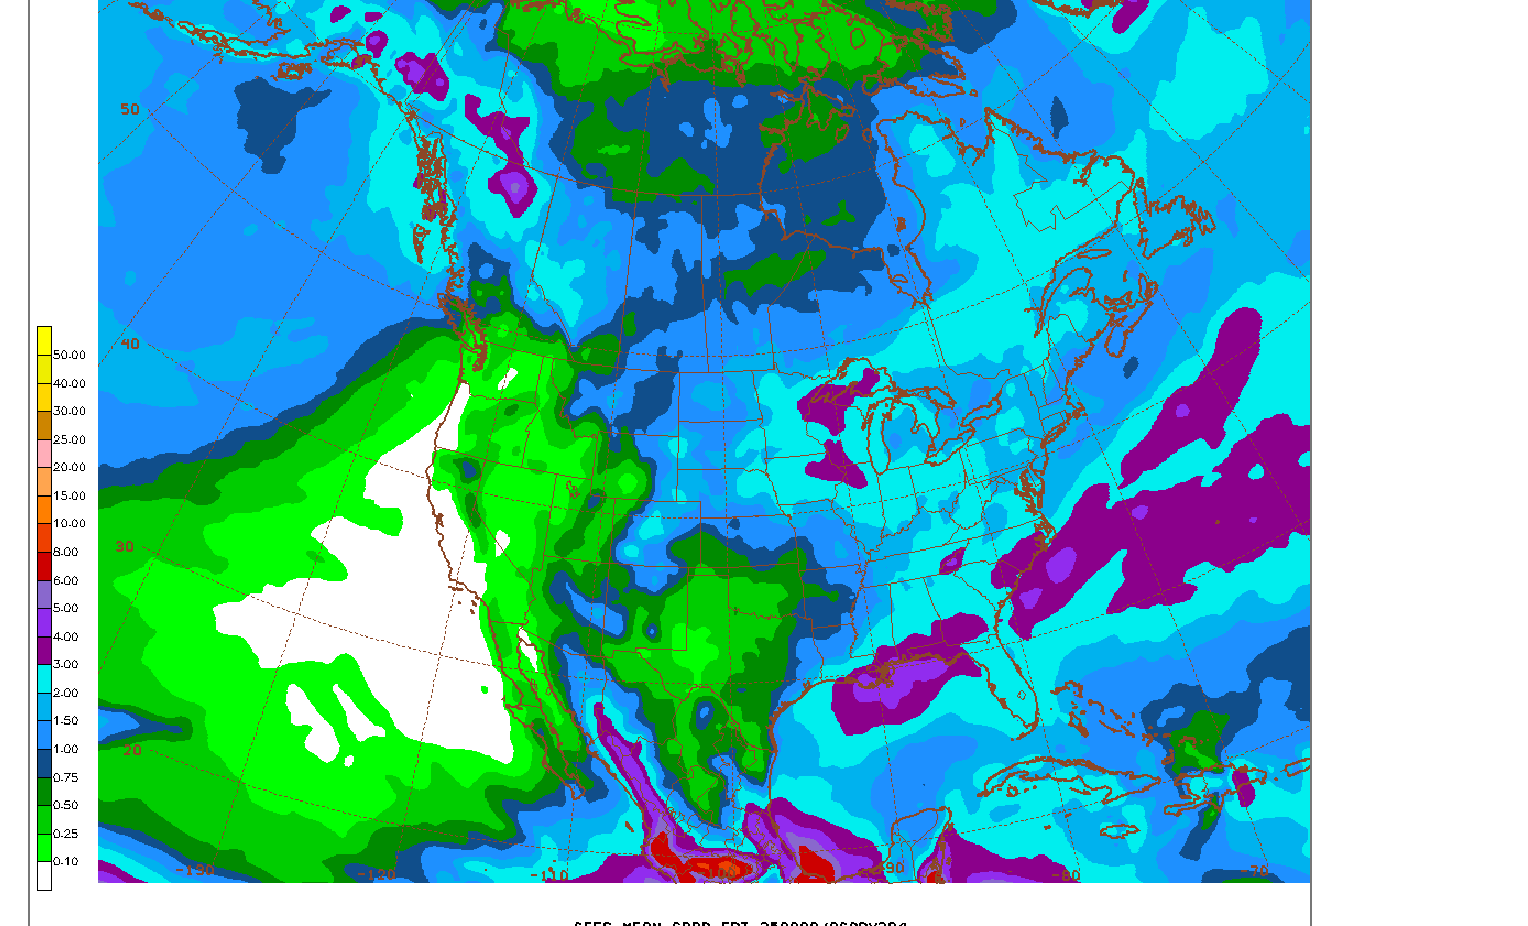
7 Day Total precipitation below:
http://www.wpc.ncep.noaa.govcdx /qpf/p168i.gif?1530796126
Who needs rain???
Almost nobody!
https://www.cpc.ncep.noaa.gov/products/Soilmst_Monitoring/US/Soilmst/Soilmst.shtml#
![]()
Rain the past 7 days.
This last 12z GEFS was even COOLER in week 2! The last run is in purple. Incredible compared to the week 2 forecast last week! As I mentioned earlier this month, the model have been completely busting on northern stream energy all Summer!!!
July 18 forecast below: This heat tapers off but temps remain well above average when the latest forecast above features CDDs dropping off a cliff and ALL of week 2 has well below average temps.
I don't remember this big of a cool change so fast in the Summer!
+++++++++++++
What's interesting is that the northern stream will be so STRONG and bump the dome waaay out of the picture the the northwest flow around the dome will shift so far west and the flow from Canada so dry, that rains will probably go below average in the cooler air in the Great Lakes and Eastern Cornbelt.
Dry and COOL is not very bullish, unless, you're in a major drought!
This is MEGA bearish in early August! I've been surprised that the grains are holding up as well as they have with this increasingly bearish weather forecast.
Look at the HUGE upper level low in 8 days on this last 12z EE. WOW!! This will be the source of some very cool air in the East, spilling back to the Midwest!! WOW!!!!!
This was the same forecast 5 days ago. WOW!!!

July 24, 2025: Heatwave Reprieve | August Forecast Trends | La Niña Discussion
https://www.cpc.ncep.noaa.gov/products/predictions/814day/index.php
Will a flash drought develop again in late August like last year????
The week 2 forecasts have had horrible skill this Summer because they keep missing the northern stream's impact. So take a week 3-4 forecast with a grain of salt.
How ironic, after 3 months of us worrying about the Western Cornbelt turning hot/dry this Summer, August may turn hot and dry in the EASTERN Cornbelt.
https://www.cpc.ncep.noaa.gov/products/predictions/WK34/
Eric was in this morning!


