WxFollower just made a post so profound that it tremendously enhanced my "big picture" understanding of the extreme weather during the 1800's!
By WxFollower - May 30, 2025, 1:21 a.m.
Hey Mike,
Fascinating but tragic stuff back in the 1800s. Thanks for sharing!
Did you know that 1877-8 was the strongest El Niño of the second half of the 1800s and that there wasn’t another comparably strong one til 1997-
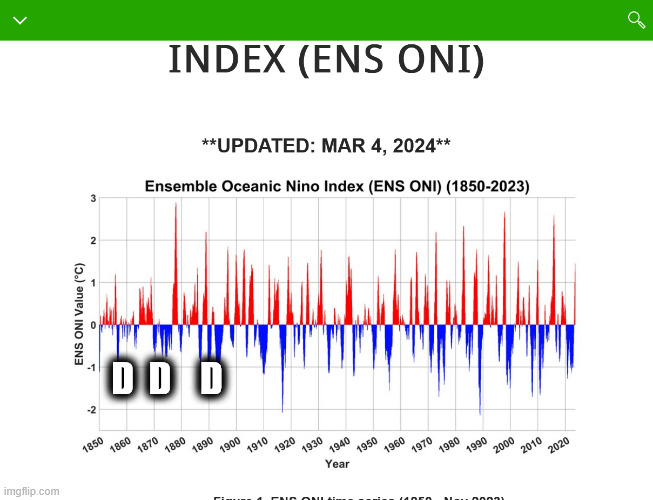
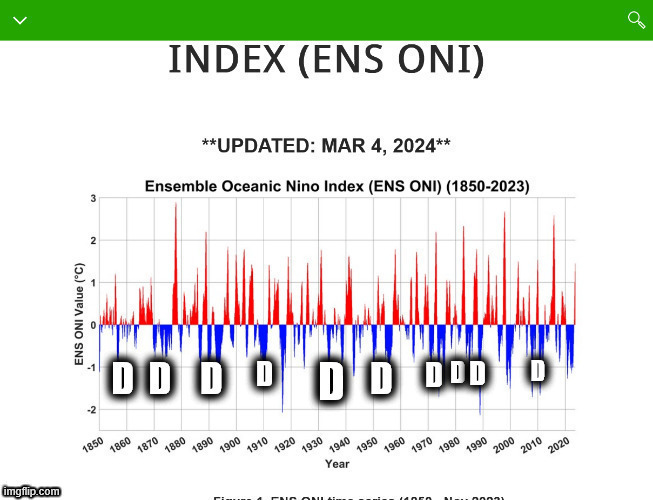
https://www.webberweather.com/ensemble-oceanic-nino-index.html
++++++++++
Here's the awesome graphs at Larry's link. Let's use this to discuss the extreme weather/climate caused by El Nino's and La Nina's in greater detail to enhance everybody's understanding.
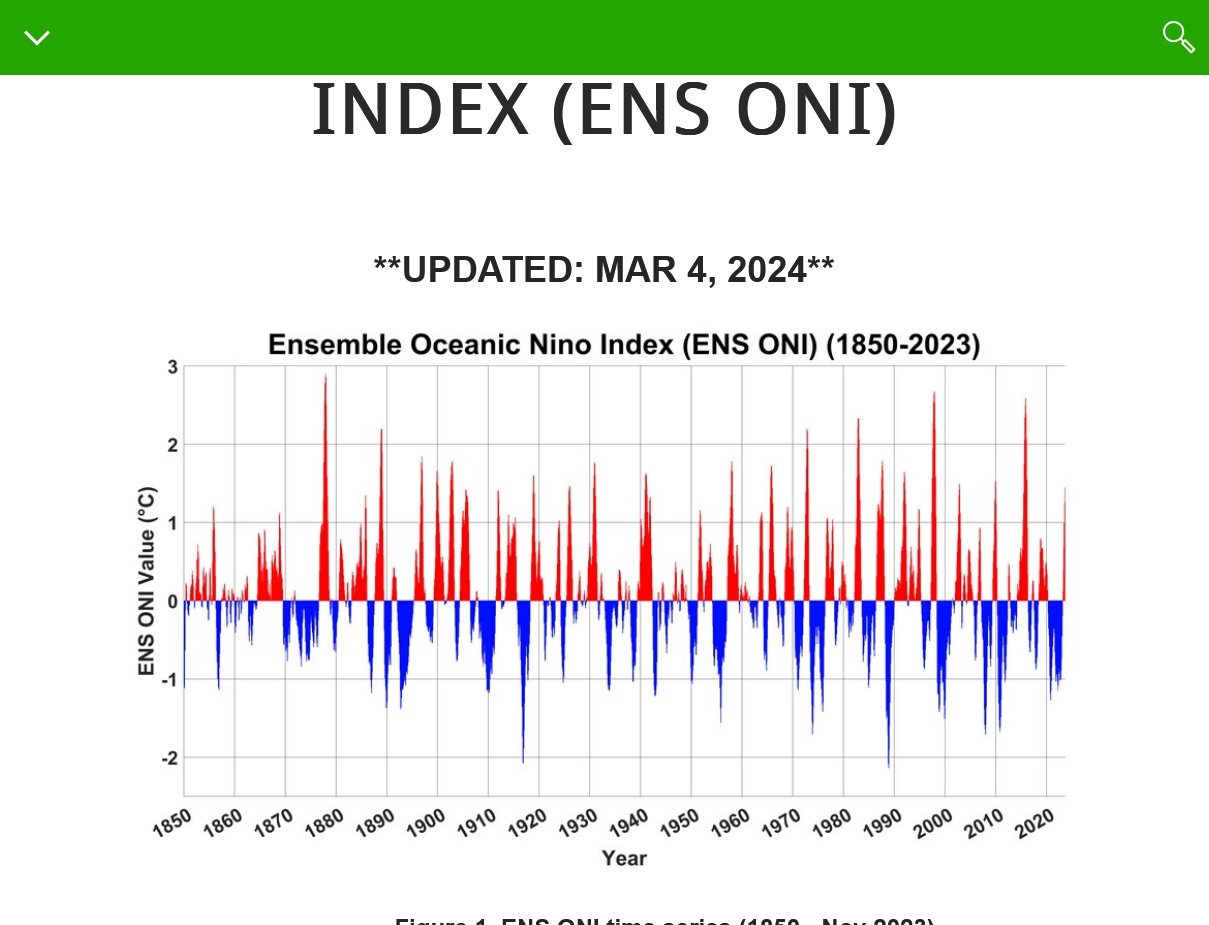
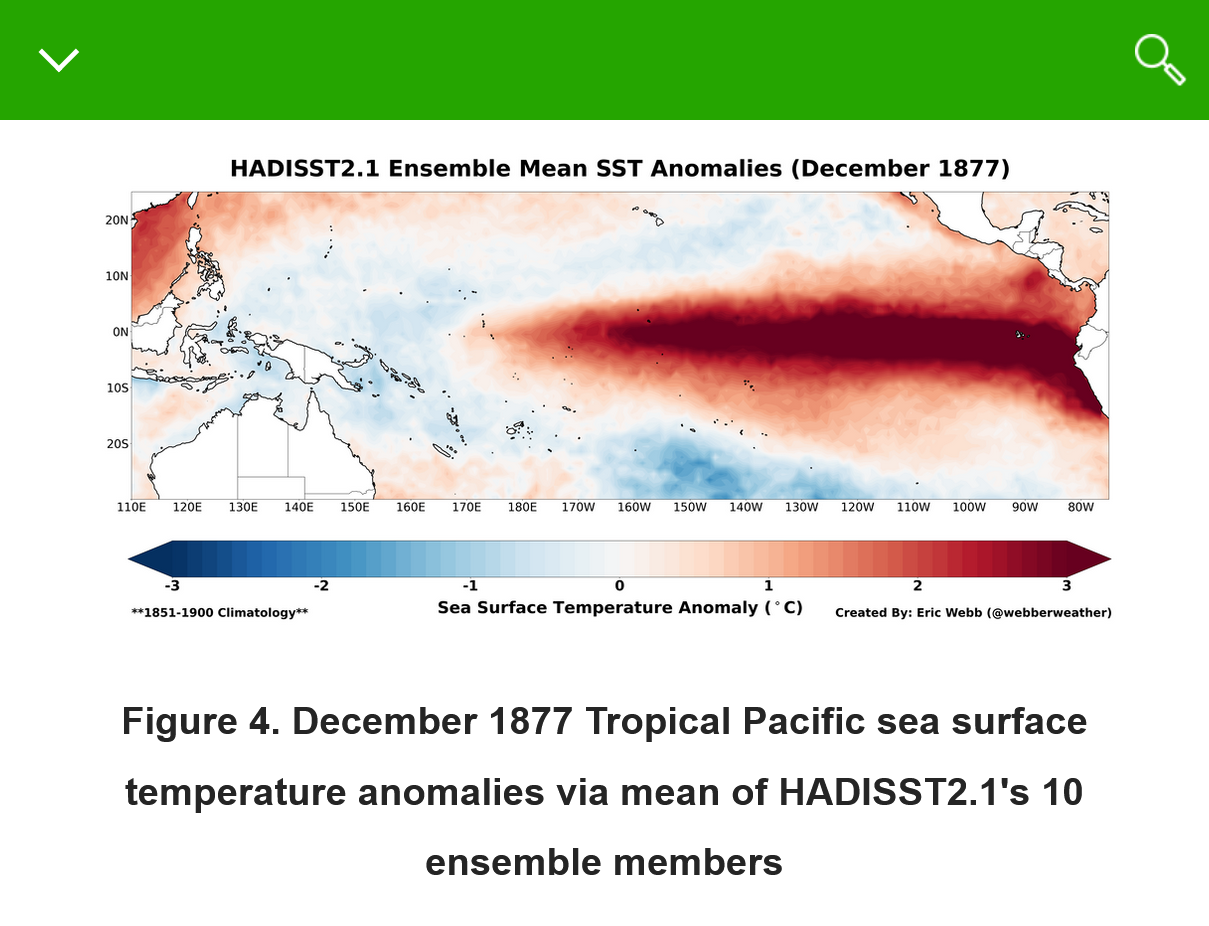
On the previous page, we should note the highest spike, strongest El Nino in history in December 1877. Warmest temperature anomalies ever recorded in the KEY ENSO region of the tropical Pacific!
This is what caused the worst, natural weather/climate disaster in human history. This was at a time frame when fairly accurate water temperatures in the Pacific were just being recorded by sailors at that time.
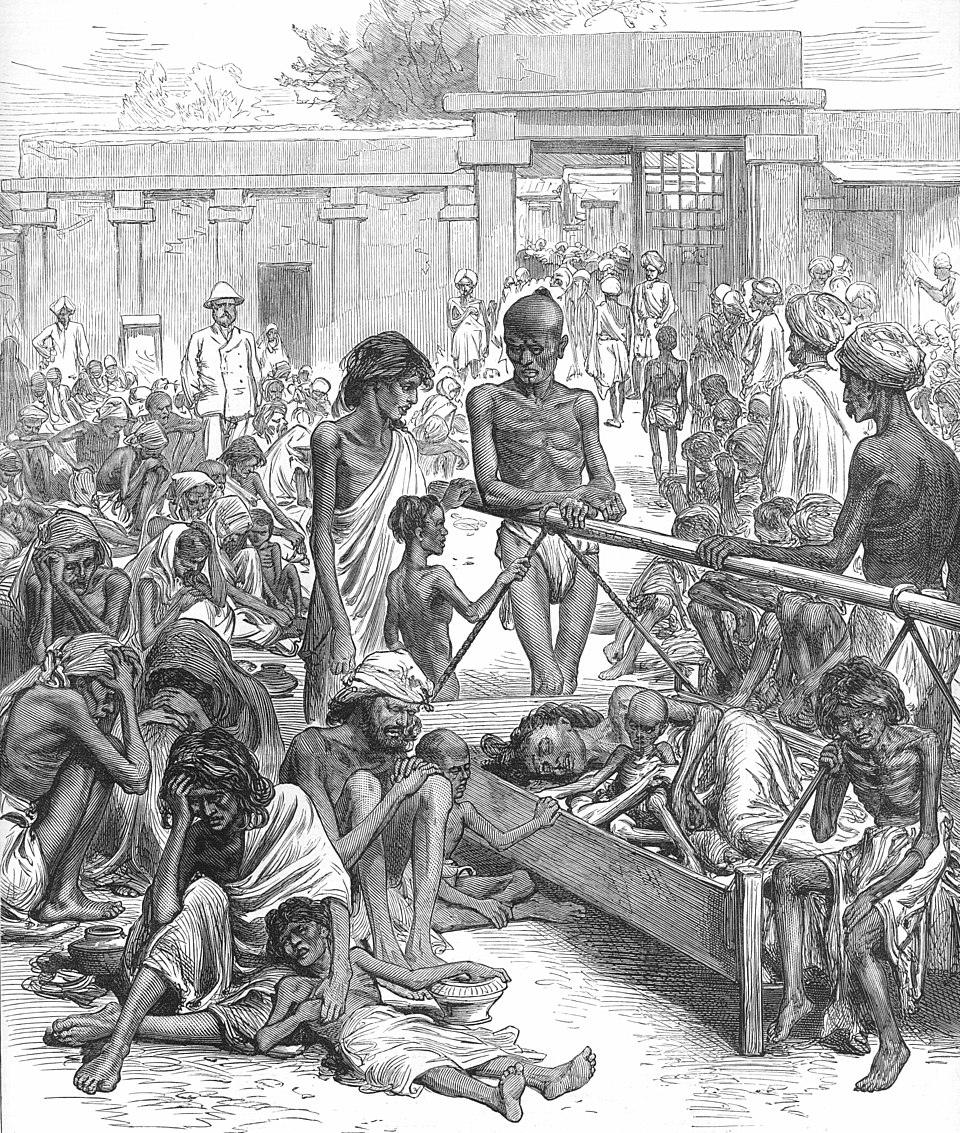
This is what it caused:
The planet had a REAL climate crisis between 1876 and 1878.
50 million people died. 3% of the global population died from that real climate crisis!
https://news.climate.columbia.edu/2017/12/15/causes-great-famine-drought/

https://ui.adsabs.harvard.edu/abs/2017AGUFMGC51F..04S/abstract
The 1876-1878 Great Famine impacted multiple regions across the globe including parts of Asia, Nordeste Brazil, and northern and southern Africa, with total human fatalities exceeding 50 million people, arguably the worst environmental disaster to befall humanity.
+++++++++++++=
This was also caused by dangerously LOW atmospheric CO2 levels which greatly reduced crop yields and food production compared to today.
It was also at the end of several centuries of damaging global cooling. Colder air holds much less moisture which reduces needed rain for crops. It also reduces growing seasons(later planting/earlier harvests and more damaging freezes) and makes the climate in northern regions more hostile for growing crops.
We should note that the United States was NOT one of the places impacted by the Great Global Drought of 1876-78.
That's because El Nino's cause abundant rains in much of our country. It's strong La Nina's(cold water) that are correlated to major droughts in the United States!
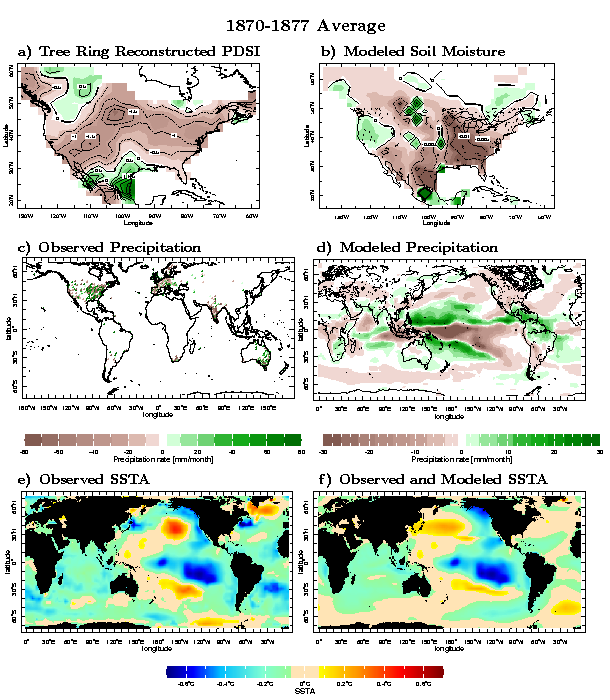
Sure enough, the period BEFORE the Great Global Drought featured one of the longest lasting La Nina's in history and this caused the Dust Bowl type, widespread 1870-1877 drought in the United States. That very long La Nina, from cold water up welling to the surface, was likely responsible for the extreme nature of the reactionary El Nino/warm water that followed it!
Note below, the bright blue, EXTREME cold anomaly in the tropical Pacific(ENSO region) that shows that long lived La Nina.
|
| |||||
https://ocp.ldeo.columbia.edu/res/div/ocp/drought/nineteenth.shtml
The 1870s drought: La Niña and locusts
Until they mysteriously became extinct at the turn of the century the Plains were often plagued by vast swarms of the Rocky Mountain Locust. The locust swarms of the bible or current day Africa are nothing compared with the swarms in the West. According to measurements at the time, and a lot of informed extrapolation, the 1875 swarm involved 3.5 trillion insects and covered an area of the West equivalent to the entire area of the mid-Atlantic states and New England (see Lockwood, 'Locust', Basic Books, 2004, for a fascinating account, by an entomologist, of the Rocky Mountain Locust and its extinction and for an online account for educational purposes see sciencecases.org.). The locust swarms ate everything in their way and ruined crops and was a terrible impediment to settlement of the West.
Locusts love drought. The dry conditions increases the nutritional value of vegetation due to concentration of sugars and nutrients and reduces plant defenses. The dry conditions also reduce fungal diseases that attack locusts. The accompanying heat accelerates locust maturation and helps them win the battle against predators. Finally, during drought, the locusts group in small areas of remaining lush vegetation (e.g. watered farms) and that population density is needed for the locust to transform into its migratory, swarming, phase (Lockwood 2004).
The worst swarms during the period of European settlement occured in the 1870s. As seen in Figure 2 this decade was also one of severe drought. This is barely seen in rain gauge data but is very clear in the tree ring reconstructions. The models forced with both global SSTs and with tropical Pacific SSTs alone reproduce this drought. Once more, as for the drought a decade before, a cold tropical Pacific Ocean, La Niña-like conditions, prevailed. It is these SSTs that forced the changes in atmospheric circulation that created the 1870s drought over North America and created the conditions for the devastating locust swarms.
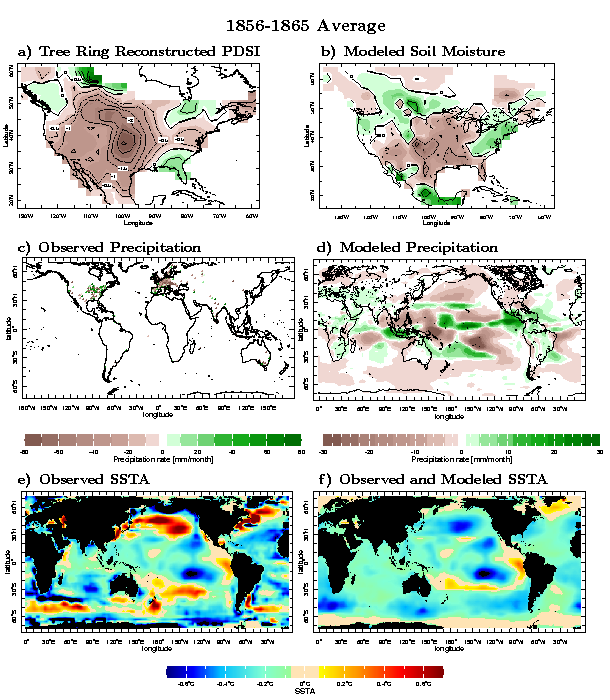
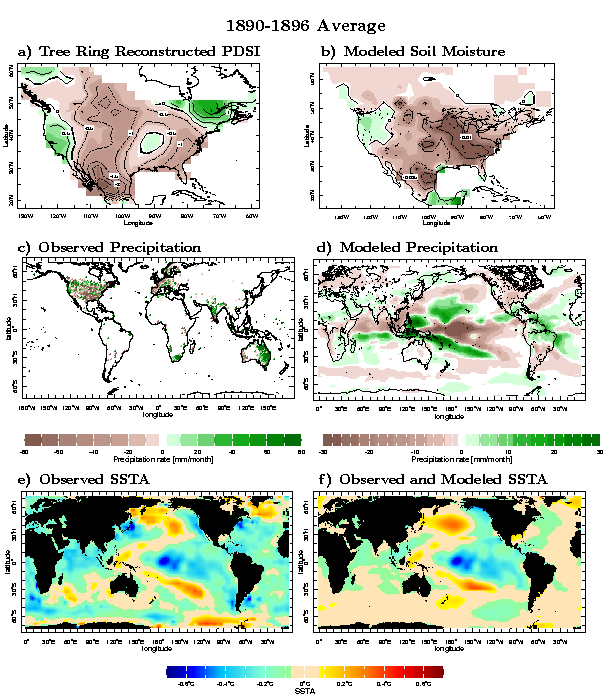
The United States actually had 3 Mega (Dust Bowl type) droughts in the 2nd half of the 1800's!
Here are the other 2. Note again on the reconstruction of ocean water temperatures for these 2 periods, the bright blue, cold temperature anomalies in the key ENSO region of the tropical Pacific. These are persistent La Nina's which correlate strongly with widespread NATURAL droughts in the United States.
Causes and consequences of nineteenth century droughts in North America
https://ocp.ldeo.columbia.edu/res/div/ocp/drought/nineteenth.shtml
Here is Larry's graph again. I inserted D's below the La Nina's that correlated with the widespread droughts in the United States at that time.
Let's move on to the 1900's/2000's MAJOR droughts in the Midwest part of the United States where the most fertile soils, highest crops yields and best weather for growing crops is in the world.
We should note the ABSENCE of widespread, MAJOR droughts in the last 3 decades during the period, DESPITE there being several strong La Nina's. There certainly has been severe drought lasting months in PARTS of the Cornbelt and also severe drought in much of the Cornbelt for brief periods. However, we are using 1988 and 2012 type droughts as the minimum threshold for a D.
37 years since 1988 and only 1 MAJOR widespread drought, the one in 2012 even though there were 3 strong La Nina's and we SHOULD HAVE seen 3 Major widespread droughts in the Midwest since 1988.
What gives?
Man made climate change is what gives!!
Helping to protect the Midwest Cornbelt from widespread MAJOR droughts and part of the climate OPTIMUM that our GREENING planet is currently experiencing.
Climate change in the United States, with 100% certainty is helping to protect us from widespread severe droughts.
Summer Climate Change in the Midwest and Great Plains due to Agricultural Development during the Twentieth Century
https://journals.ametsoc.org/view/journals/clim/32/17/jcli-d-19-0096.1.xml

++++++++++++++++++++++++++++++++++++++++++++++++++++

Re: Re: Re: Re: Re: Re: : Droughts not increasing
By metmike - Oct. 6, 2023, 12:26 a.m.
By Charles Blaisdell PhD ChE++++++++++++
Thanks for the article!
With the earth massively greening up, of course evapotranspiration has also increased a great deal.
Global Green Up Slows Warming
https://earthobservatory.nasa.gov/images/146296/global-green-up-slows-warming
In the last 60 years, the United States Corn Belt has doubled the number of tightly packed rows of corn and tripled the corn yields. The result has been like a science experiment in agronomy during the Summer/growing season, This 10 state area has seen regional increases in dew points of 5+ Deg. F on many occasions entirely from the added evapotranspiration of the corn.
This has created a micro climate for around 4 months of the year in this area.
The same impact is happening in other agricultural areas. Also, most places with natural vegetation that’s been greatly greening up with the greater foliage transpiring more.
Summer Climate Change in the Midwest and Great Plains due to Agricultural Development during the Twentieth Century
https://journals.ametsoc.org/view/journals/clim/32/17/jcli-d-19-0096.1.xml
Americans Have Planted So Much Corn That It’s Changing the Weather
https://www.atlasobscura.com/articles/corn-belt-weather
The Corn Belt is making it rain.++++++++++
WEATHER LAB | What is corn sweat?
https://www.weareiowa.com/article/weather/weather-lab/science-of-weather-corn-sweat-evapotranspiration-water-vapor/524-de12a91b-35cd-4b48-9b21-c0ec6e11f794
An acre of corn can add up to 4,000 gallons of water vapor to the atmosphere per day!
‘Corn sweat’ in the Midwest can cause some of the most oppressive humidity in the US
Can you imagine stepping outside to a 90-degree dew point?
https://www.foxweather.com/learn/corn-sweat-midwest-most-oppressive-humidity-united-states
Climate Change Impacts in the Corn Belt
Why is the humidity so high? The answer is pretty corny.
https://addins.wrex.com/blogs/weather/2011/07/why-is-the-humidity-so-high-the-answer-is-pretty-corny
The United States’s Corn Belt is making its own weather Plentiful crops are changing rainfall and temperature trends
https://www.science.org/content/article/america-s-corn-belt-making-its-own-weather
++++++++++++
Mike Maguire
October 5, 2023 9:38 pm
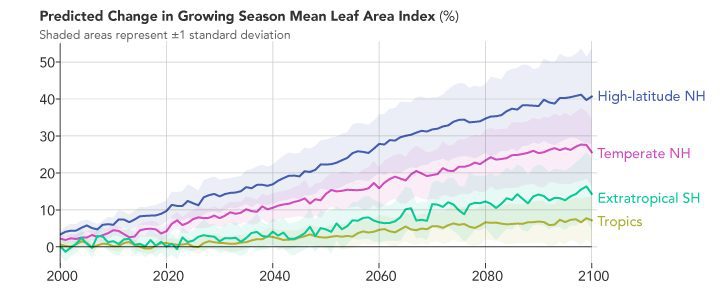
This impact will continue for the next century at least as a result of increasing beneficial CO2, as we extend the current scientific/biological climate OPTIMUM for most life on this greening planet.
Here’s that article again to go with the attached graph that shows the expected leaf area increasing at every latitude across the planet thru the year 2100!
Global Green Up Slows Warming
https://earthobservatory.nasa.gov/images/146296/global-green-up-slows-warming
Oh my goodness! I feel very honored with this award. Thank you, Mike. I couldn’t have done it without met. Eric Webb’s having compiled this great ENSO ONI data going back to 1850!
Thank YOU, Larry!
You can see how your graph immediately paid enlightenment dividends in this thread!
I'm adding some elaboration to this graph below because some D's represent a drought that was much more than just 1 year., like the drought of 1988 was for instance.
Also, there is always drought somewhere in the United States, especially out West because of the topography and natural weather patterns.

Just noting the especially long, tenacious droughts (or decades) that impacted the Midwest.
1. 1856-1865: "Civil War" drought. Tree rings, historical reports
2. 1870-1877: "Locust Swarms" drought. Tree ring8s, historical reports
3. 1890-1896: Widespread rain gauges more common
4. 1930's: The Dust Bowl or "Dirty 30's" We all know much of the history
5. 1950's: Several widespread severe drought years.
6. 1980/1983/1988: 1980 was mainly south. 1983 was a wet Spring, then rains shut down in June with intense heat the rest of Summer. 1988 started in late Winter.
Major droughts will still happen.
1. However, warmer oceans from climate change evaporate more moisture into the atmosphere which provides more precipitable water for weather systems.
2. The slightly warmer Gulf of Mexico, our main source for highest moisture, contributes a bit more of it.
3. Tightly packed rows of corn and massive evapotranspiration. This not only contributes towards recycling that moisture back in the form of rain but it causes more afternoon clouds and cooler high temperatures. I don't remember in the late 1970's/early 80's, while getting a degree in Atmospheric and Ocean Science at the University of Michigan, seeing an 80 degree dew point. The summer of 1983 is when I first remember seeing a dew point that high. Dew points well into the 80's can happen today, with as much as 10 degrees of it coming from huge cornfields.
This is MAN MADE climate change!
Good for crops, bad for humans during extreme heat waves because the Heat Index soars much higher.
https://learningweather.psu.edu/node/37
++++++++++++++++++++++++==
Dew points reached into the lower to mid-80s in some towns in Iowa and Illinois
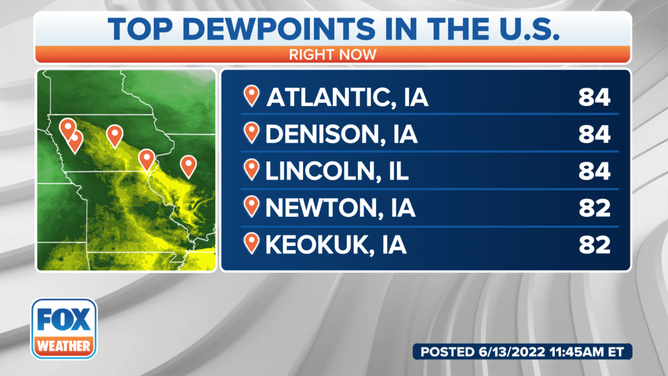
+++++++++++++++++

4. Forgot to mention the contribution of increasing CO2 that causes plant/crops to be more water efficient/drought tolerant. This is also what made the droughts in the past EXTRA devastating and the drought of 2012, not AS bad it is would have been to crops if CO2 levels were 100 ppm lower.
CO2 causes plants to be more water efficient and drought tolerant:
https://buythetruth.wordpress.com/2009/06/13/photosynthesis-and-co2-enrichment/
50 trillion in agricultural productivity....just from the increasing CO2:
Deserts greening up from rising CO2 below
https://phys.org/news/2013-07-greening-co2.html
By metmike - March 20, 2021, 11:45 a.m.
https://www.marketforum.com/forum/topic/62784/
NEW: Optimal CO2 for life more than double current level. See the proof with thousands of studies. Showing Scientific American.....and mainstream science sold to us........ to be wrong about plants and the affects from Climate Change. December 2020
https://www.marketforum.com/forum/topic/62784/#62797
In addition: Increasing CO2 causes plants to be more drought tolerant(they don't need to open their stomata as wide to get CO2, since its more concentrated in the air........ which results in less transpiration(water loss).
They also do better with heat at higher CO2 levels:
and sell it not; also wisdom, and instruction, and understanding
https://buythetruth.wordpress.com/2009/06/13/photosynthesis-and-co2-enrichment/
The effect of CO2 concentration on photosynthetic rate at constant temperature is shown below for C3 and C4 crops.

https://www.sciencedirect.com/science/article/abs/pii/S1002016017604582
Differences among Plant Functional Types in Response to Elevated CO2https://www.nature.com/scitable/knowledge/library/effects-of-rising-atmospheric-concentrations-of-carbon-13254108/The preceding discussion has presented the average effects of elevated CO2, but obscures important patterns of difference in response among plant species. One of the most important determinants of species differences in response to elevated CO2 is photosynthetic type. Most plant species (~90%) utilize a photosynthetic process known as C3 photosynthesis. Other species use either of two physiologically distinct processes known as C4 and CAM photosynthesis (Figure 2). C4 plants include most tropical and sub-tropical grasses and several important crops, including maize (corn), sugar cane, sorghum, and the millets. There has therefore been considerably more research on the responses to elevated CO2 in C4 than in CAM plants. 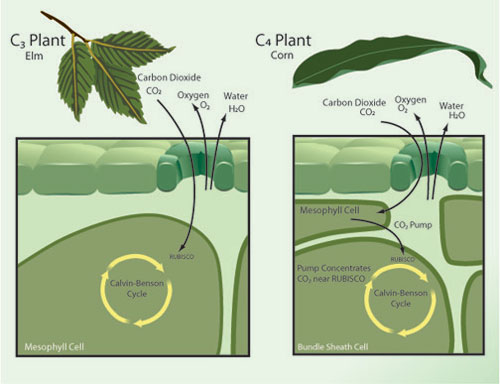 Figure ... | Sept. 24, 2024, 11:42 a.m. metmike |
Elevated CO2 and Water Stress in Plants
https://encyclopedia.pub/entry/27289
https://buythetruth.wordpress.com/2009/08/15/co2-enrichment-and-plant-nutrition/

Evolution of stomata responsiveness to CO2 and optimization of water-use efficiency among land plants.
https://academic.oup.com/treephys/article/39/8/1416/5427464
https://www.nature.com/articles/s41598-021-96037-9
++++++++++++++
So the bottom line is that if we were to see another Dust Bowl type climate(which the current climate optimum is helping to protect us from) crops today would be much more resilient because of better:
1. Crop genetics
2. Farming practices
3. Much higher CO2 levels. From photosynthesis AND because higher CO2 causes crops to be much more drought(water conserving) and heat tolerant.
UAH May 2025 global temperature
Started by metmike - June 7, 2025, 3:44 p.m
https://www.marketforum.com/forum/topic/112386/
By metmike - June 7, 2025, 4:56 p.m.
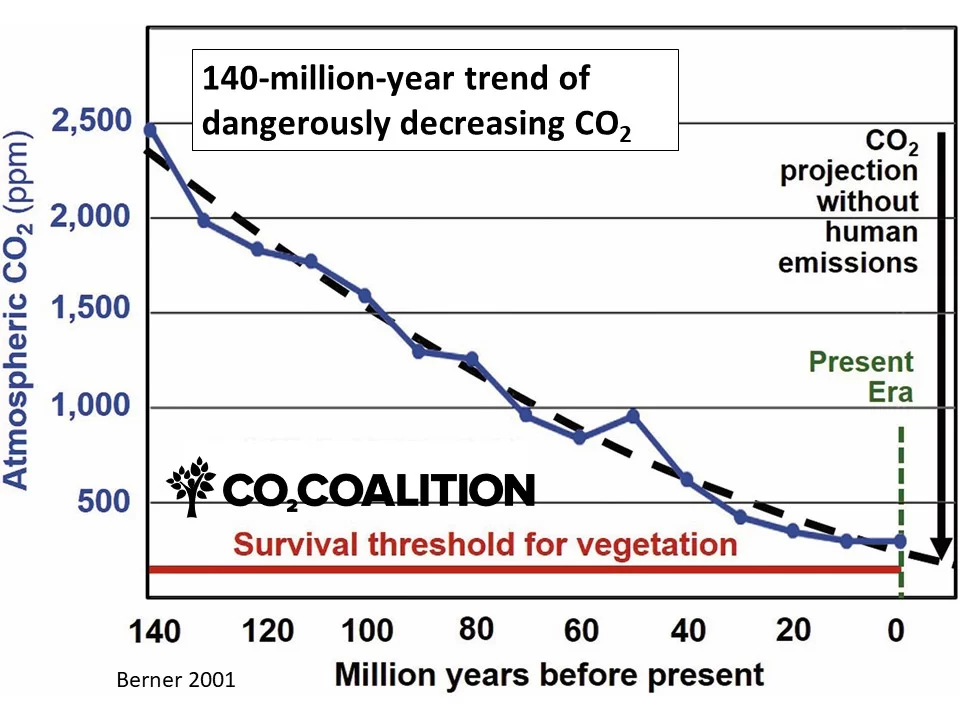
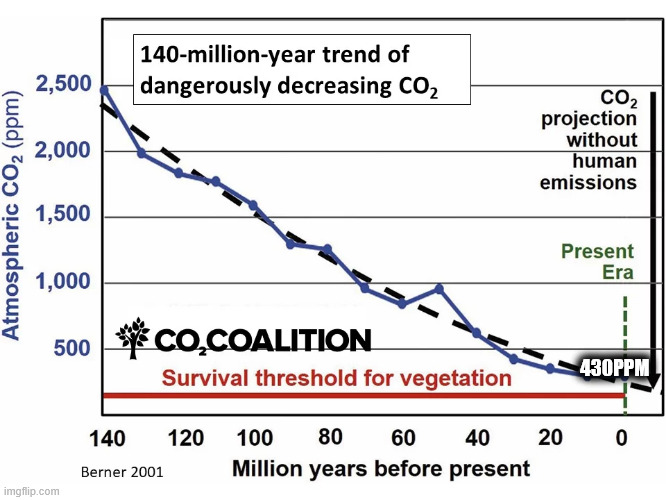
Human emissions of CO2 have rescued the planet from CO2 starvation!
The current level of 430 parts per million is still LESS THAN HALF of the optimal level of life.
https://co2coalition.org/facts/140-million-year-trend-of-dangerously-decreasing-co2/
Explore our extensive library of facts and detailed data to empower yourself with knowledge, educate friends and family, and join us in our love for CO2.
https://co2coalition.org/facts/