The best weather videos in the world come from Eric but today he delivers a Hall of Fame version on fundamental meteorology that is the best I've ever seen.
By metmike - May 23, 2025, 2:40 p.m.
May 23, 2025: Why So Windy? | Important Global Trends Since 1980 | Flooding Rains OK/MO/AR/KS...
Congrats, Eric Snodgrass!
Too bad Snodgrass’s forecast for drought this year turned into a swing and miss. He is backpedaling big time.
Thanks, vinny!
I think that backpedaling on a seasonal Summer forecast made in the Spring is just good meteorology using the scientific method which compels the scientist to CHANGE their forecast based on changes in the guidance.
Seasonal forecasts predicting the weather months in advance have a poor skill level so most people understand those changes.
I would say that the models/forecasts are still indicating a strong tendency towards dryness in the N Plains to the Upper Midwest into the 2nd week in July.
With the heat increasing next week that may be a theme for much of the country this Summer.
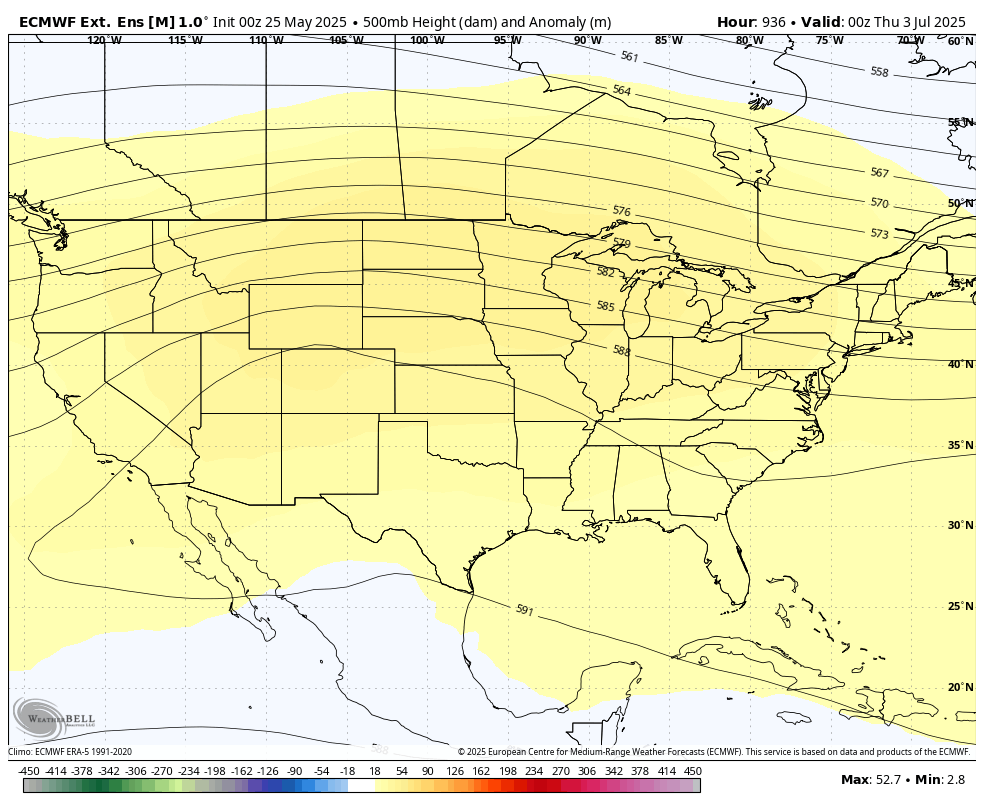
This is the 500 mb map for July 9th from the last European Ensemble model.
Definitely lots of heat IF this verifies. On rains it could be tricky. Ridge rider perturbations coming around the periphery of the heat dome, then tracking in northwest flow to the east can often trigger decent rain events.
However, that type of pattern often misses some places and very warm to hot temps will increase evaporation rates, meaning average rains will result in a draw down of the soil moisture.
Also, June is the vegetative state for corn/beans and the crop has been planted early this year. This means pollination will be early for corn if we accumulate a lot of GDDs in June. This stretch of cool weather has reduced those early GDDs and places with good moisture right now would prefer some heat.
Beans use mostly daylight hour changes to signal flowering but beans planted early will increase their size before flowering and can flower a bit earlier.
https://ipcm.wisc.edu/blog/2019/06/soybean-flowering-fallacy-2/
https://coolbean.info/wp-content/uploads/sites/3/2017/10/2018_Soybean_flowering_final.pdf

It isn’t good meteorology because a good weatherman wouldn’t throw in his bias. The swing and a miss started in late fall/early spring when other market watchers started pointing out the warm pool of water in the gulf of Alaska that nullified the potential for a midwestern drought. The exact tipping point when Arlen Suderman was on market to market publicly refuting the drought because of the warm gulf of Alaska. Snodgrass immediately switched course on the drought talk. It was stirring the pot for subscriptions pure and simple. The extended Euro models got wet and now we are in a bear market. It was the most sloppy I have ever seen snodgrass.
"The extended Euro models got wet and now we are in a bear market. It was the most sloppy I have ever seen snodgrass"
Hi vinny, thanks for your interpretation but it is flawed.
I don't follow every weather person out there because I use my own weather and interpretations so I have no idea if what you say about them is true or not but you are wrong about the latest European models unless you are referring to this short term event, which couldn't have possibly been predicted last Fall and even in dry patterns, you will have SOME rain events.
The extended Euro models have not turned wet as you say:
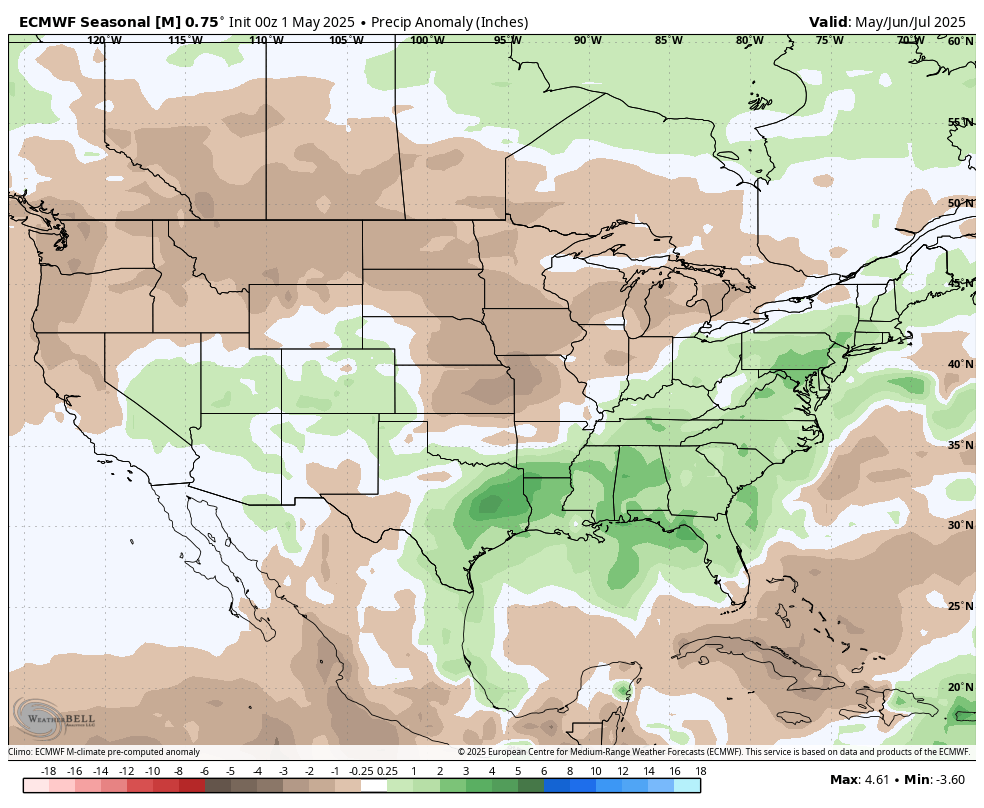
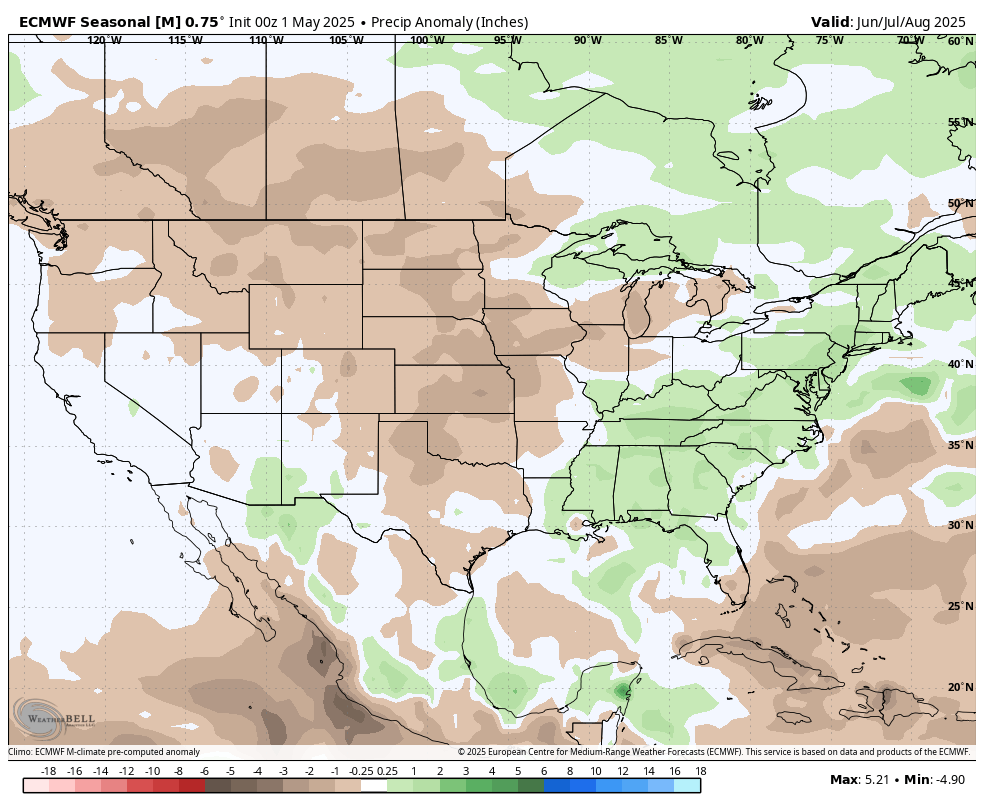
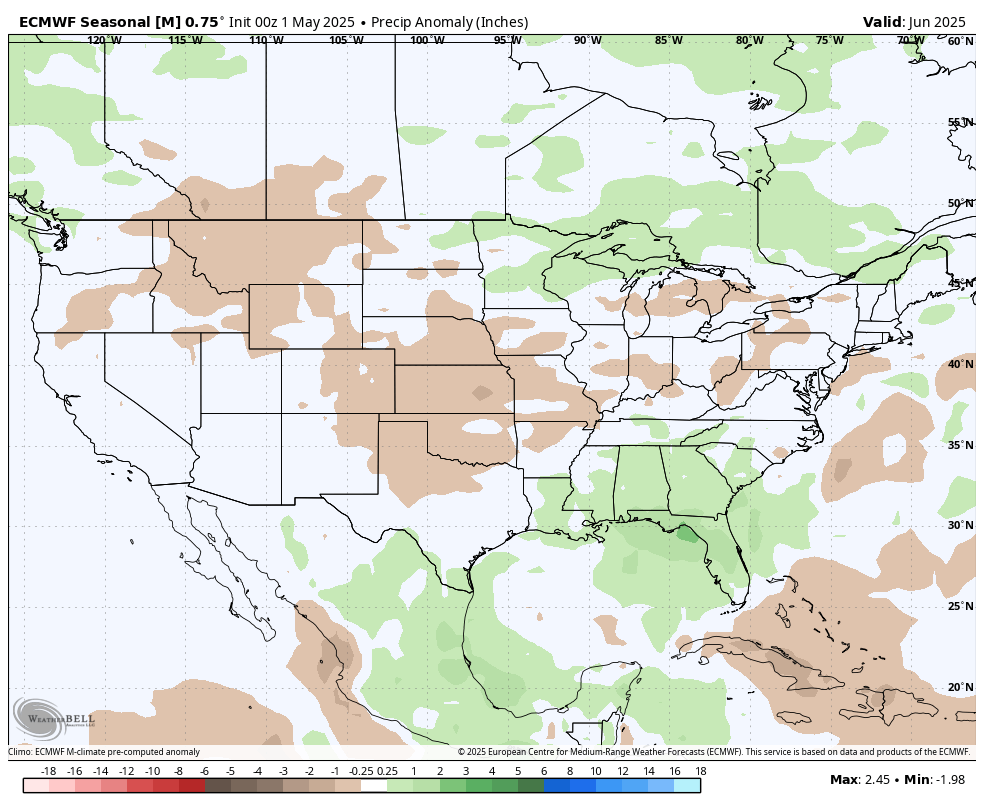
Here are the last updates:
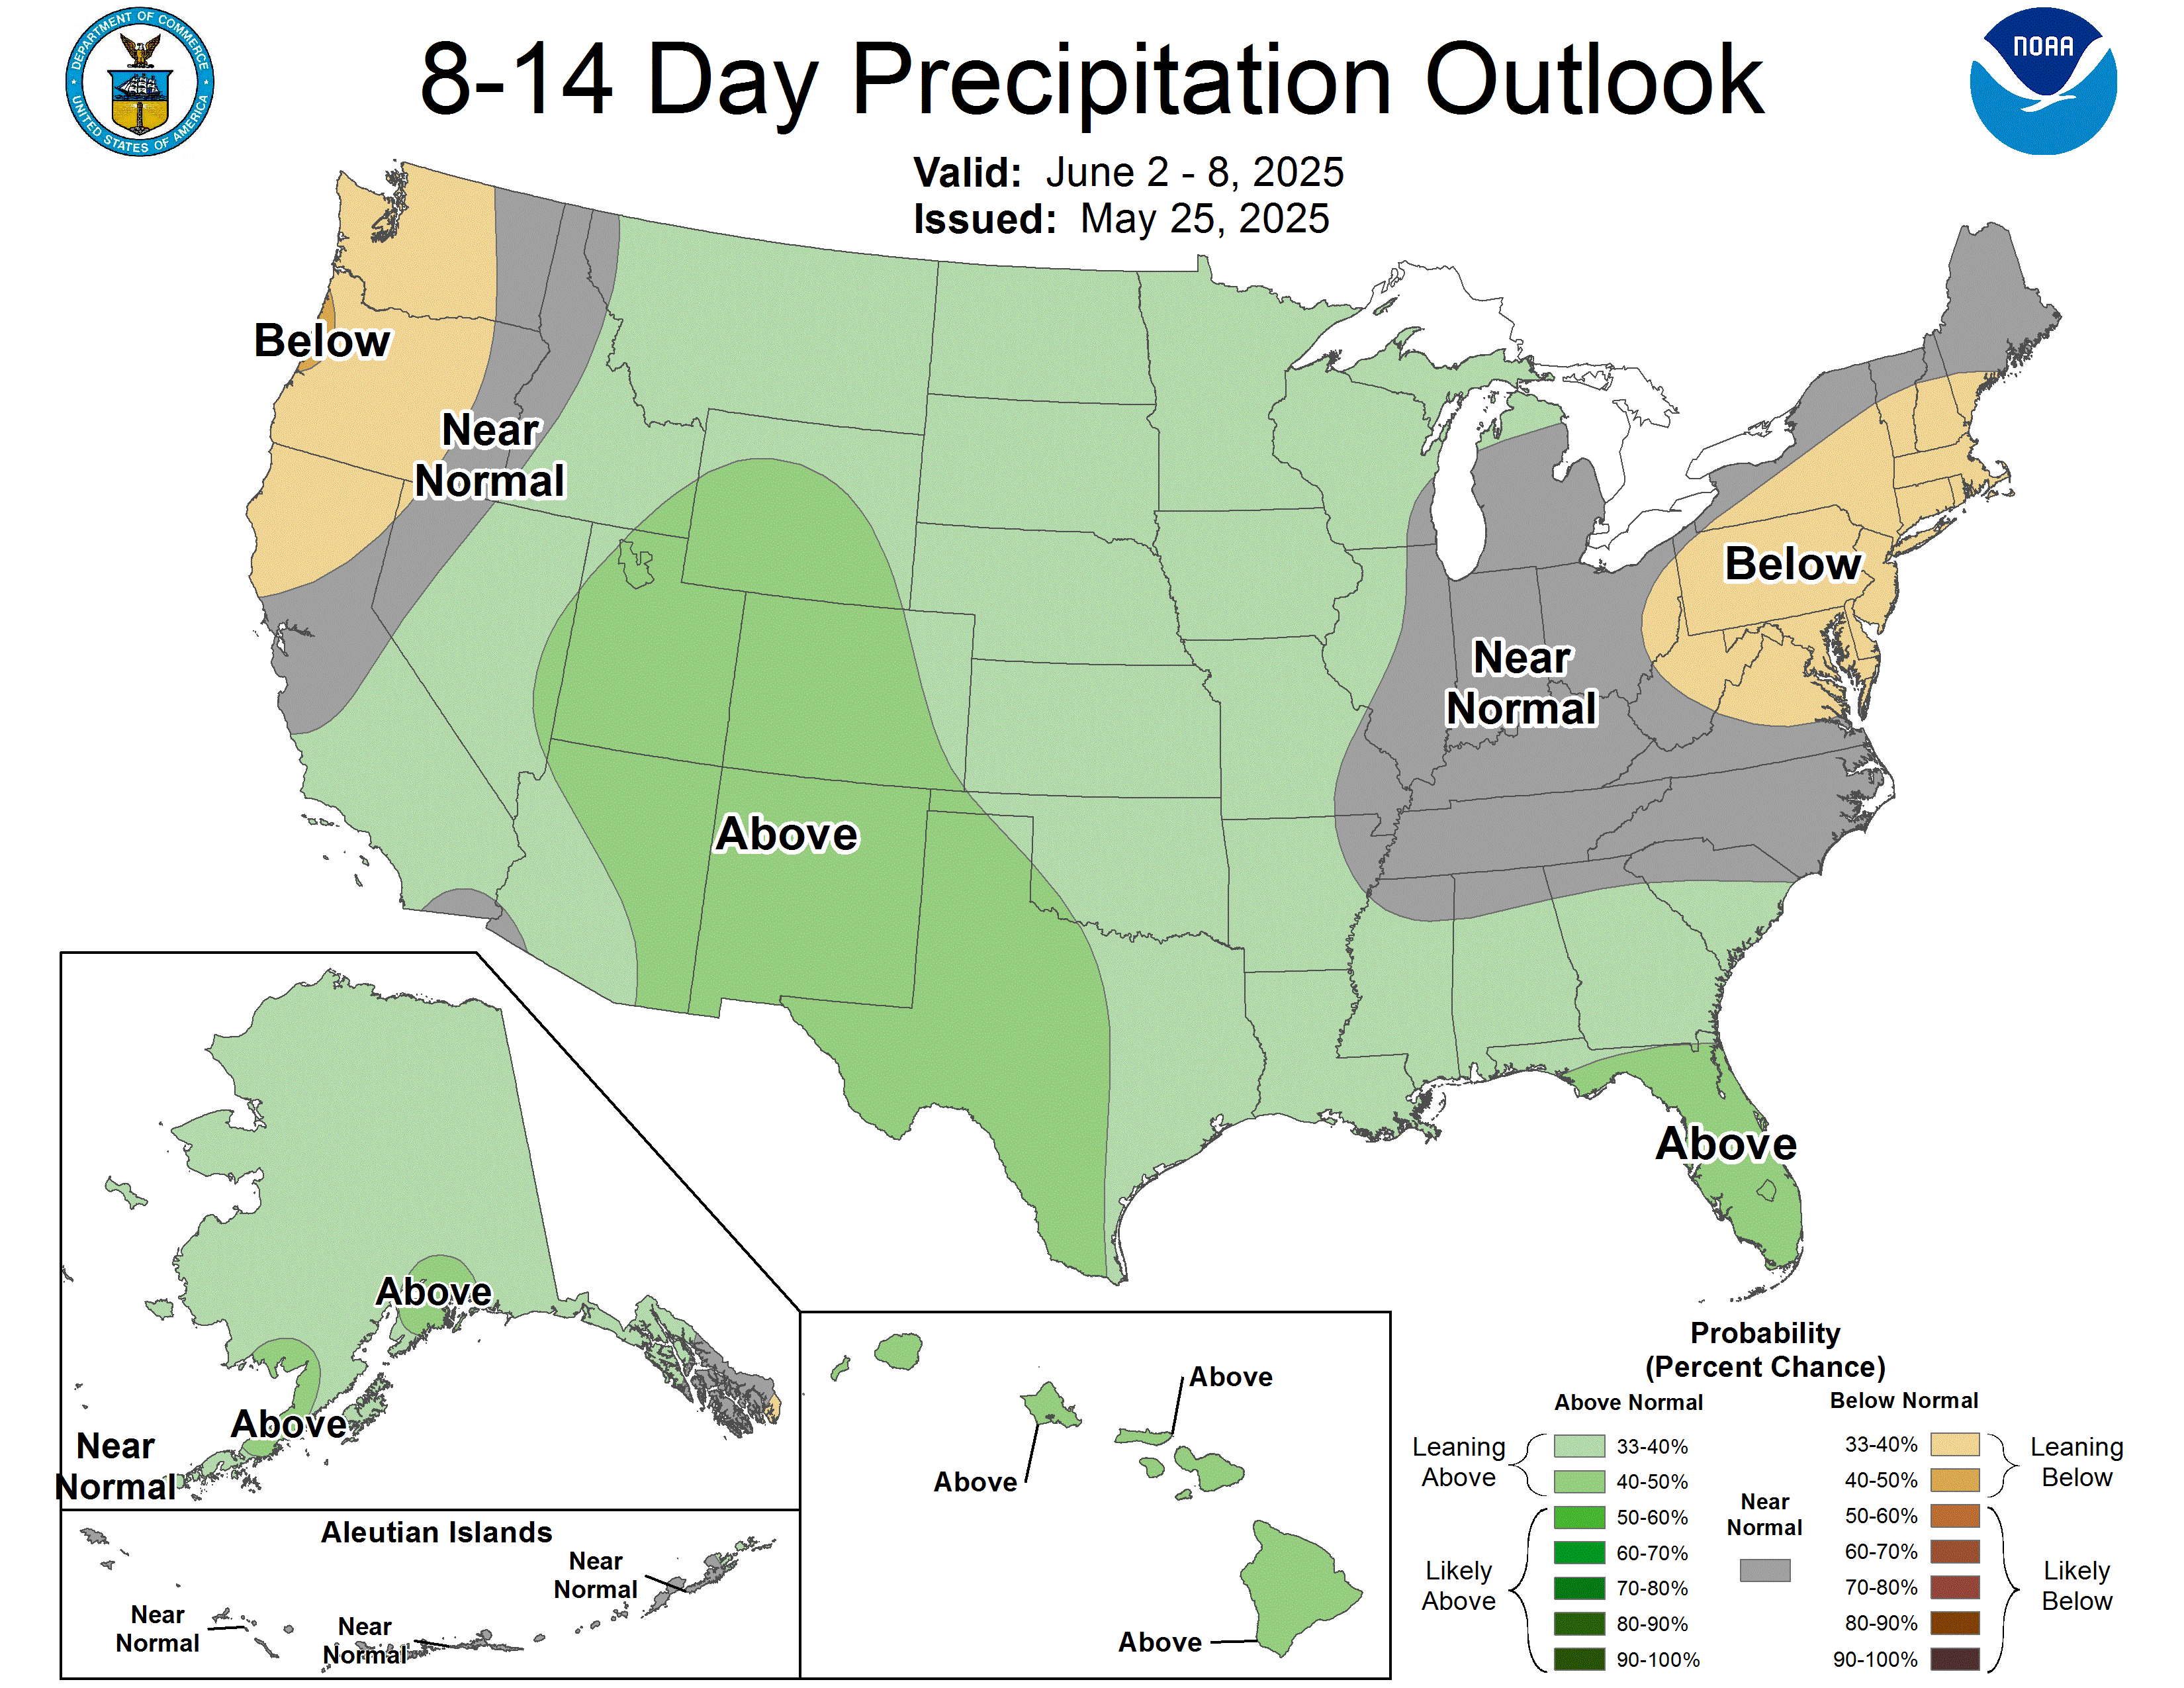
May/June/July rainfall:
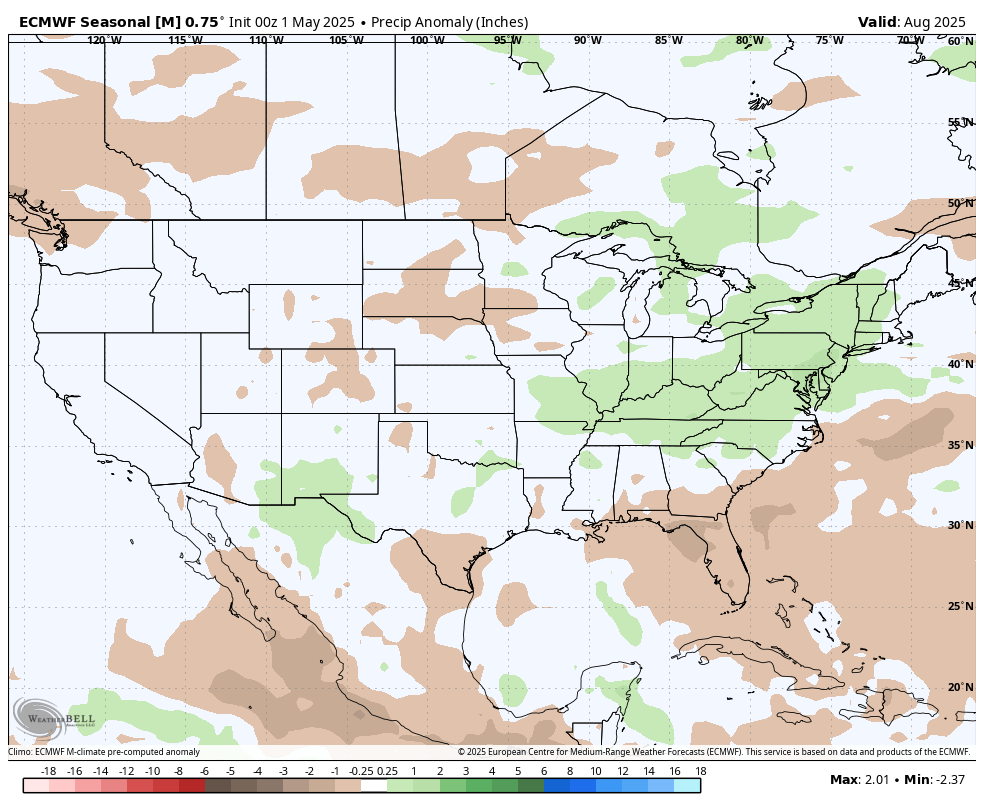
Jun/July/August rainfall:
June rainfall:
July rainfall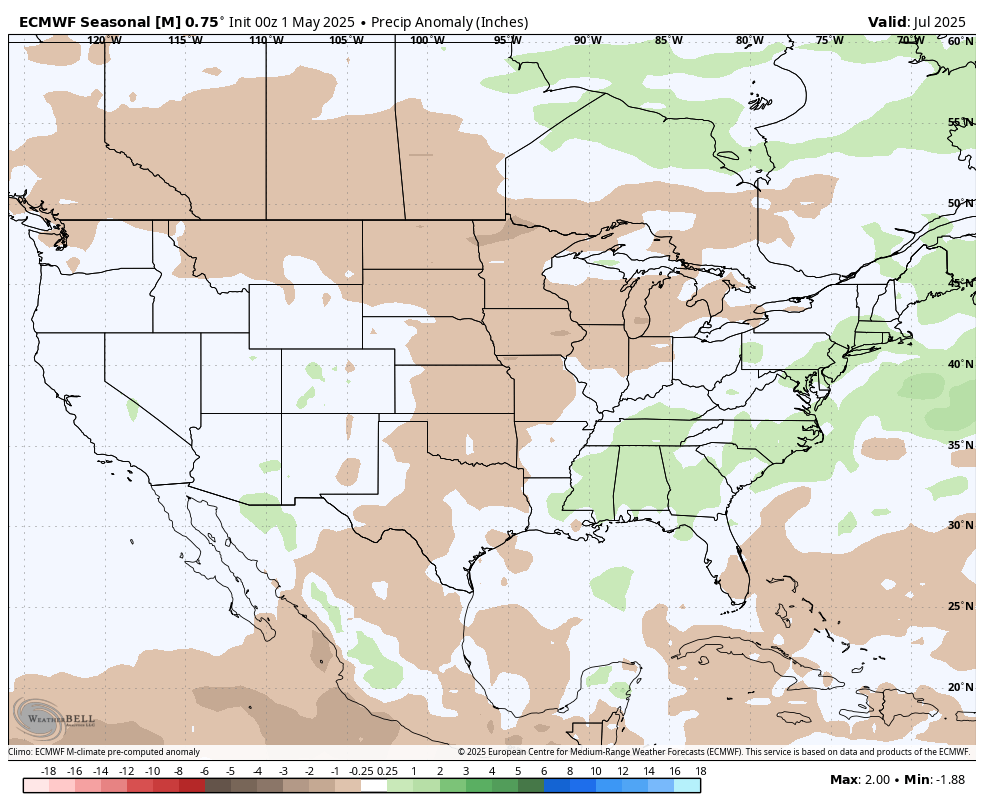
August rainfall:
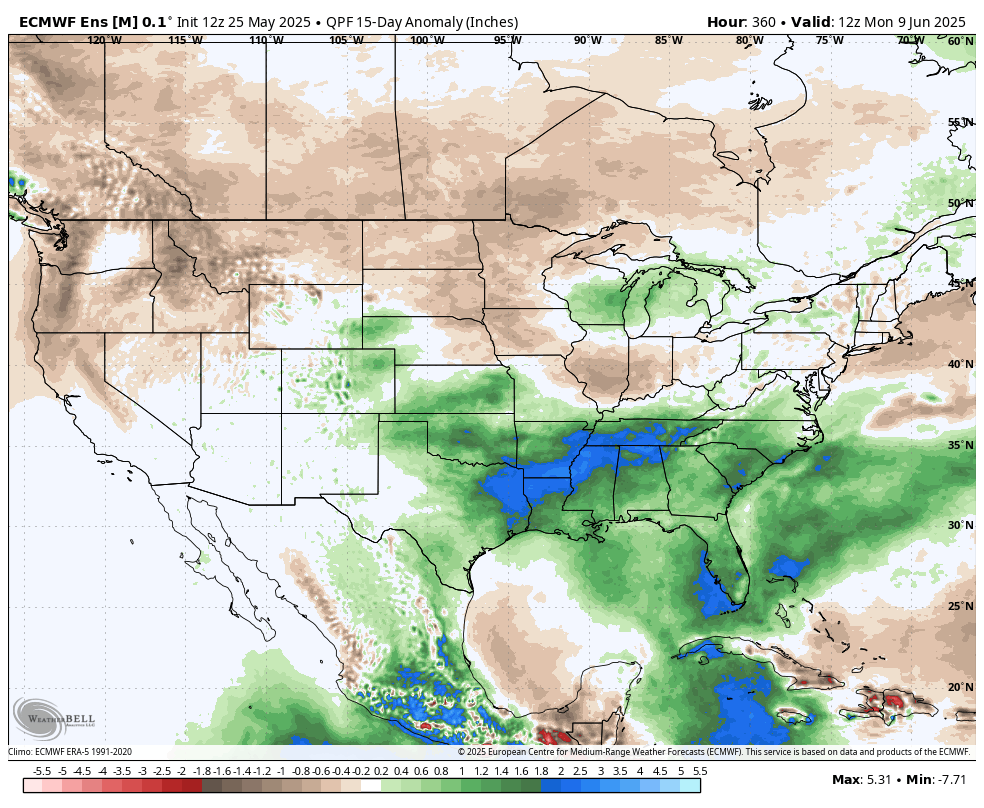
The last 12z European Ensembles for 360 hours of rain:
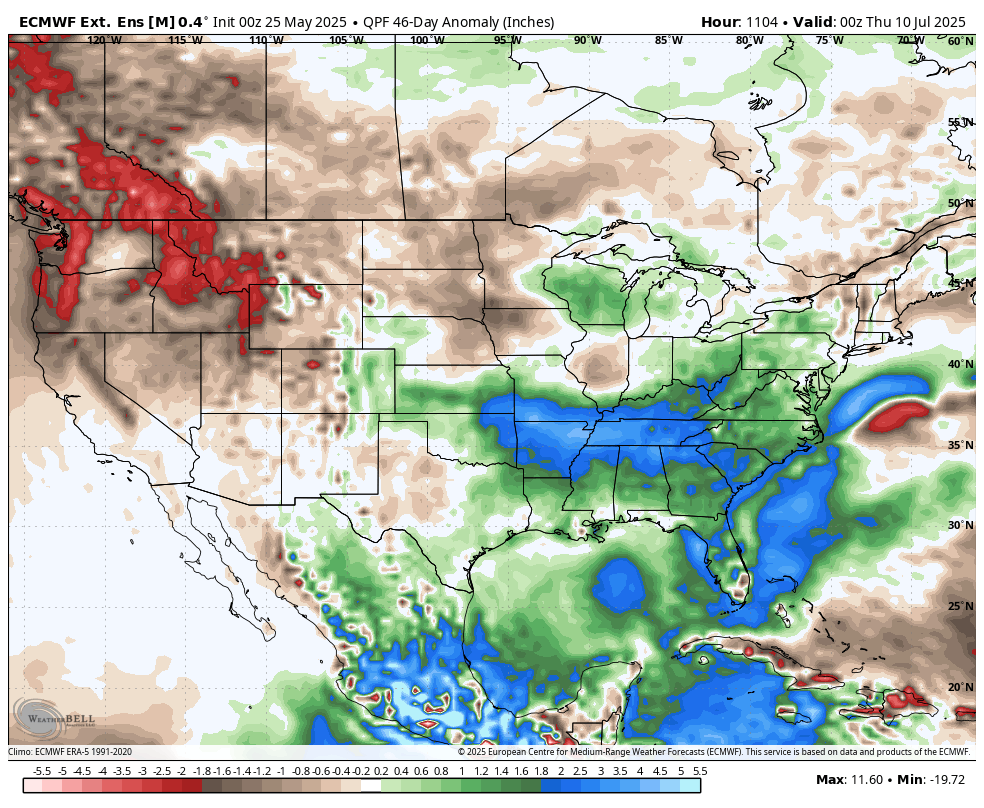
The last 0z European model 46 day forecast:
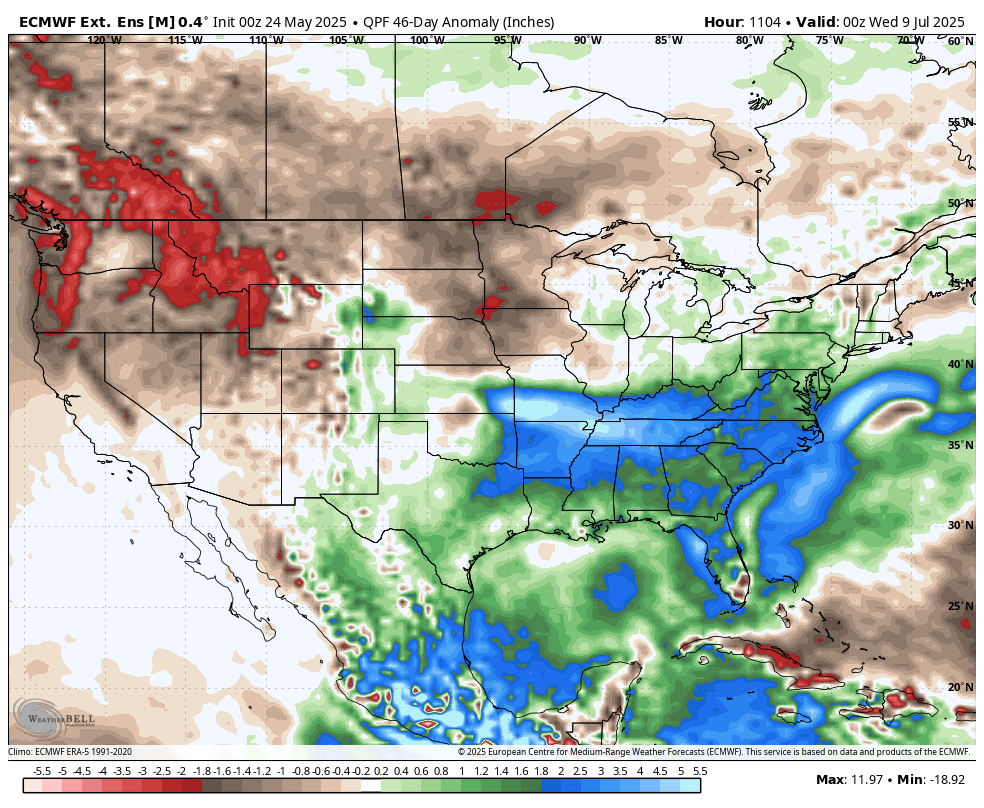
Whether this remains as the same or similar forecast and for how long can't be known but these are all the latest European model forecasts and they are NOT wet. For the the northwestern half of the Cornbelt which is the exact same area that every model and forecaster has been indicating was at risk for drought this Summer.
+++++++++++++++++++++++++
3:30 pm: The 0z European model 46 day forecast was just updated. It is not AS dry in the driest areas, party because of more short term rains.
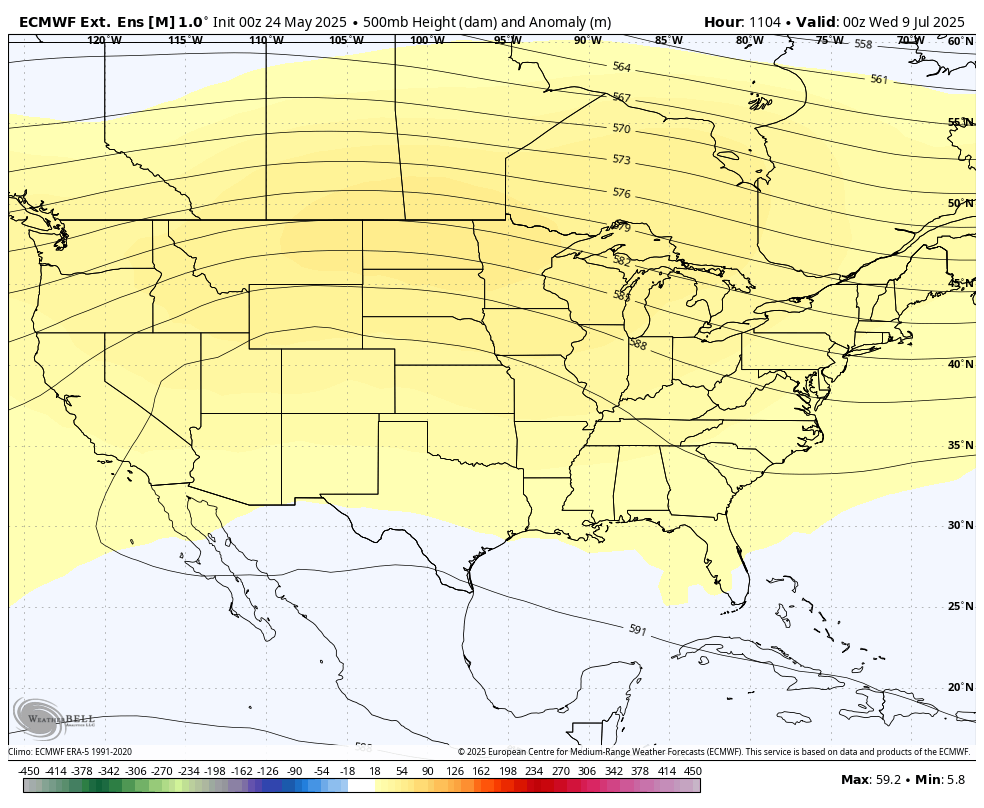
This is the 500 mb, upper level map for July 3.
This is what that same map looked like 7 days ago. Note the 591 DM line of the heat ridge was a bit farther north compared to the same day but the new run goes out an additional 7 days and builds it even stronger. Regardless, that is NOT a bearish weather map to start off July.
Plenty of heat for sure but will we get ridge riders along the periphery of the heat ridge that track in northwest type flow across the Midwest? That would add more rain than the European model thinks will happen.
This was a discussion from earlier this month related to a request by tjc for comments.
Time to worry about 1930s type drought?
Started by tjc - May 15, 2025, 1:12 p.m.
https://www.marketforum.com/forum/topic/111856/
This current situation is NOT anything like 2011!
Or 2012 for that matter, when the La Nina drought of 2011/early 2012 expanded from the Southern Plains into the Cornbelt.
That can't happen this time because instead of a drought to the south, like in early 2012 it's WET there.
So the air masses coming into the Midwest from the south that lost moisture in 2011/12 tracking over a widespread drought will be tracking over land with high soil moisture that will not take out surface moisture and will help preserve moisture, in fact over tightly packed corn fields, will ADD moisture from evapotranspiration.
That doesn't mean that areas to the north won't have worsening drought. That can still happen if an upper level ridge/dome sits on top of them. That can defeat attempts by the atmosphere to generated rain with warm air aloft the suppresses rising motions and instability needed to lift the air to cool it and condense out the moisture into clouds and rain.
This is important because it's the part of the forecast most reliable. Extremely dry NE gets some rains......barely but that won't last very long. There will be net drying in the driest locations the next 10 days.
7 Day Total precipitation below:
http://www.wpc.ncep.noaa.govcdx /qpf/p168i.gif?1530796126

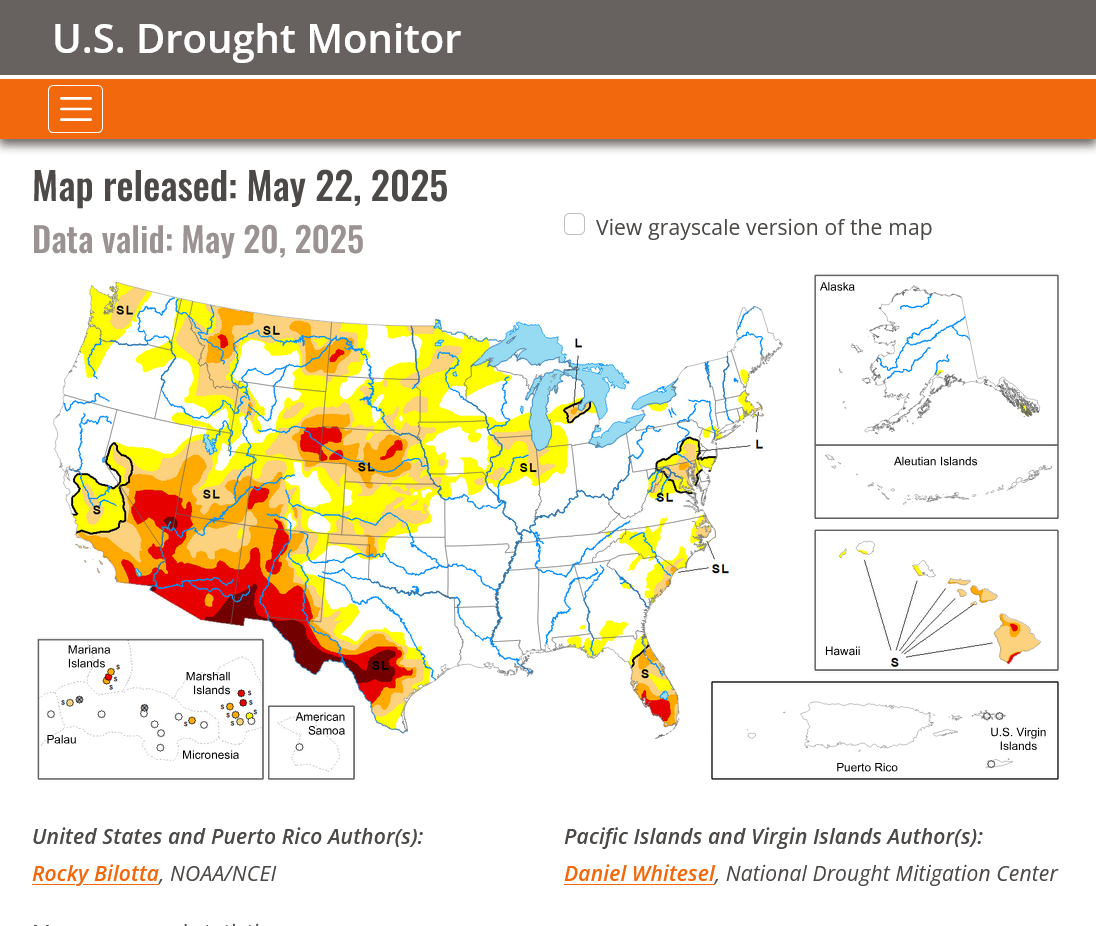
DROUGHT MONITOR
https://droughtmonitor.unl.edu/
I will say that its likely, when we get into July that this drought COULD increase for 2 reasons.
1. Even with ridge riders, many places miss out.
2. With heat moving in, evaporation rates will be higher and dry things out quicker. Also, the initial heat will be coming from the Southwest. This is a dry heat.
3. Regardless of the bullishness of #1 and #2. The week 2 part of the forecast is morphing more bearish right now and it could represent a bias in the models towards being too hot and dry in the periods AFTER 2 weeks. When we get closer, they seem to be turning wetter. The 8-14 day over the previous week was pretty dry but today its turned wet.
This is the last 336 hour EE map below. The yellow is vorticity/spin that causes lift and precipitation. The yellow area crossing the N.Plains and Upper Midwest around the periphery of the upper level ridge is an area with widespread embedded perturbations that would trigger a pretty big rain event ahead of it at that time, that would likely dive southeast towards the southern inflow of very warm, humid air.
This is why the forecast above has JUST turned wet in week 2.
The models did not see this last week. That's what happens frequently with the latest periods of the 2 week forecast. Especially when early week 3 becomes late week 2!
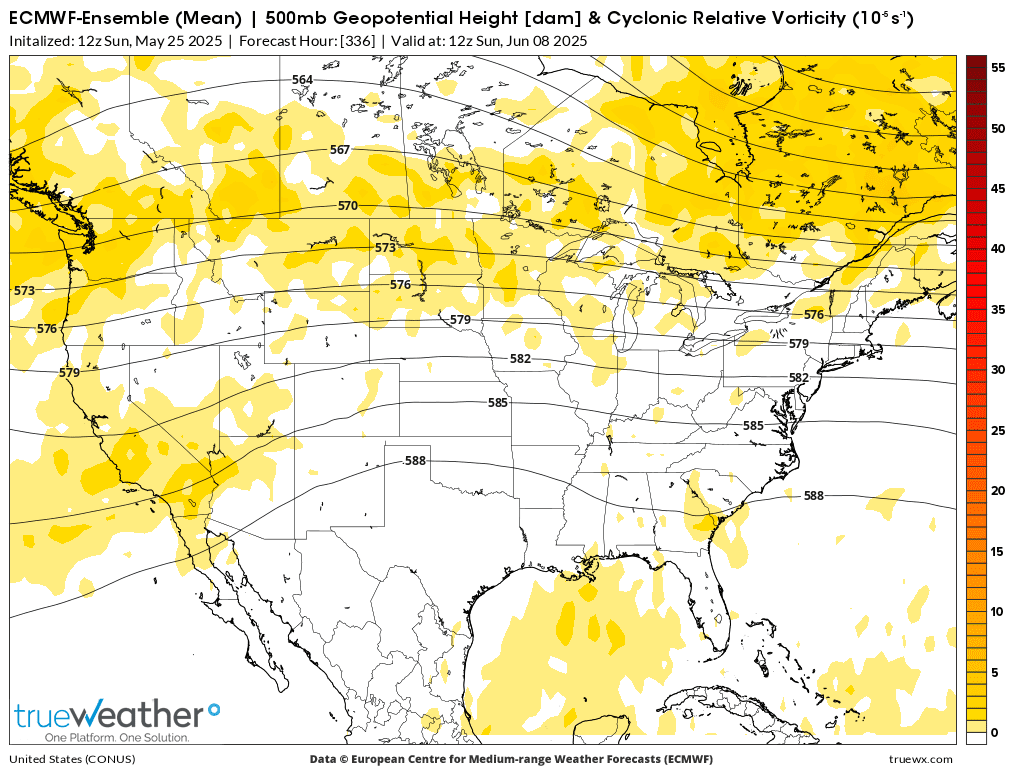
I think we can have moderate confidence that rains will pick up in the path that the yellow follows the streamlines. Later in week 2.
To prevent this, the upper level ridge will need to build MUCH farther north by 500+ miles which seems unlikely since the vorticity is actually ERODING the upper level ridge in that area.
The source of this is the Upper Level trough along the West Coast. There will be a decent jet stream tracking from there to the periphery of the ridge
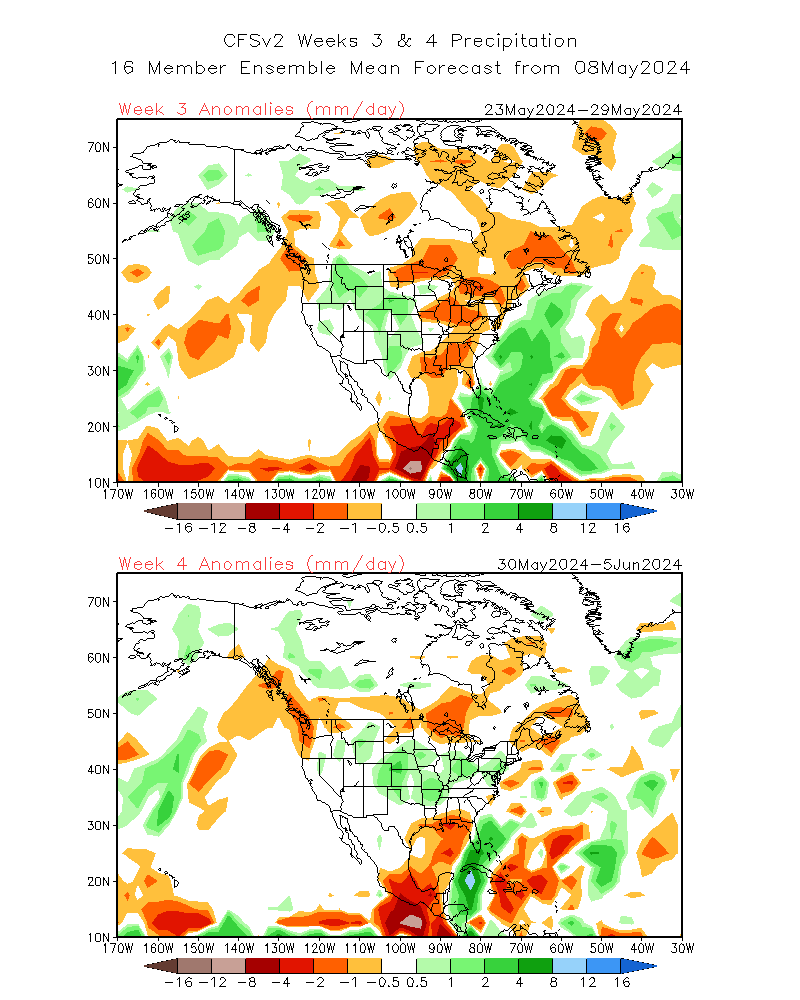
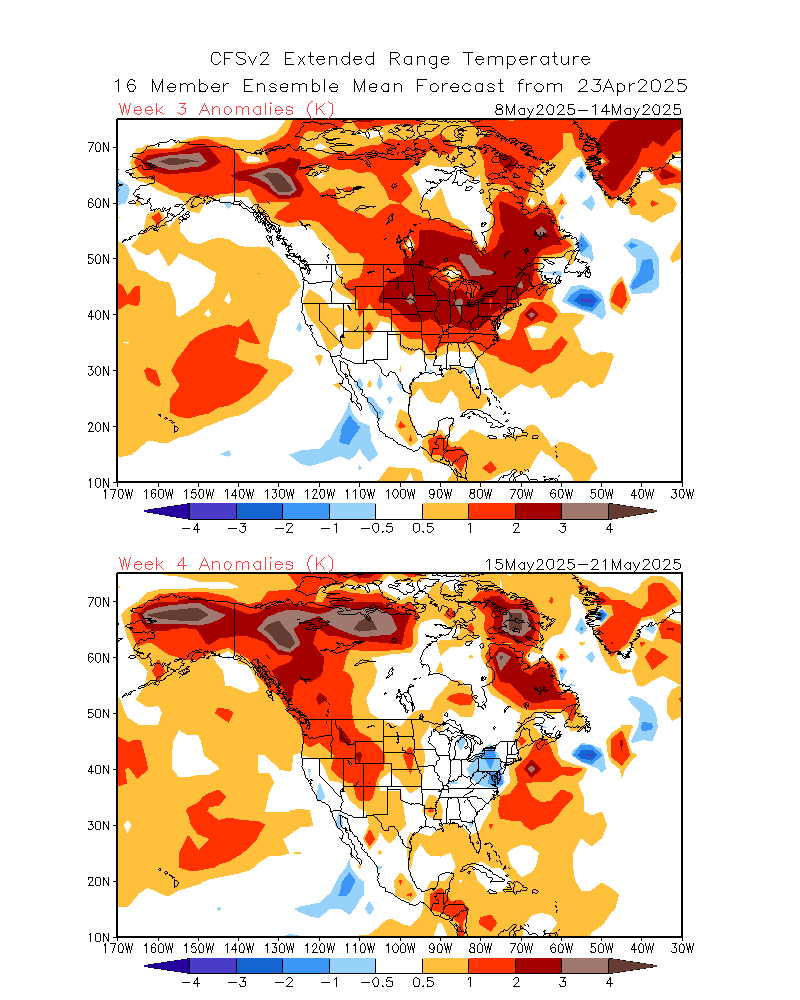
The last week 3-4 CFS are bullish but this changes alot/is not very reliable.
https://www.marketforum.com/forum/topic/83844/#83949
Week 3-4 forecasts don't have a great deal of skill.
https://www.cpc.ncep.noaa.gov/products/people/mchen/CFSv2FCST/weekly/
Temperatures below. These maps are 1 day old.
Precip below..