Here’s a new NG thread. The weekly EIA was slightly bearish with a +120 vs a range of 106 to 130.
Thanks very much, Larry!
I'll start this off with today's earlier post from the old thread:
Re: Re: Re: Re: Re: Re: Natural gas 3-20-25
By metmike - May 22, 2025, 11:55 a.m.
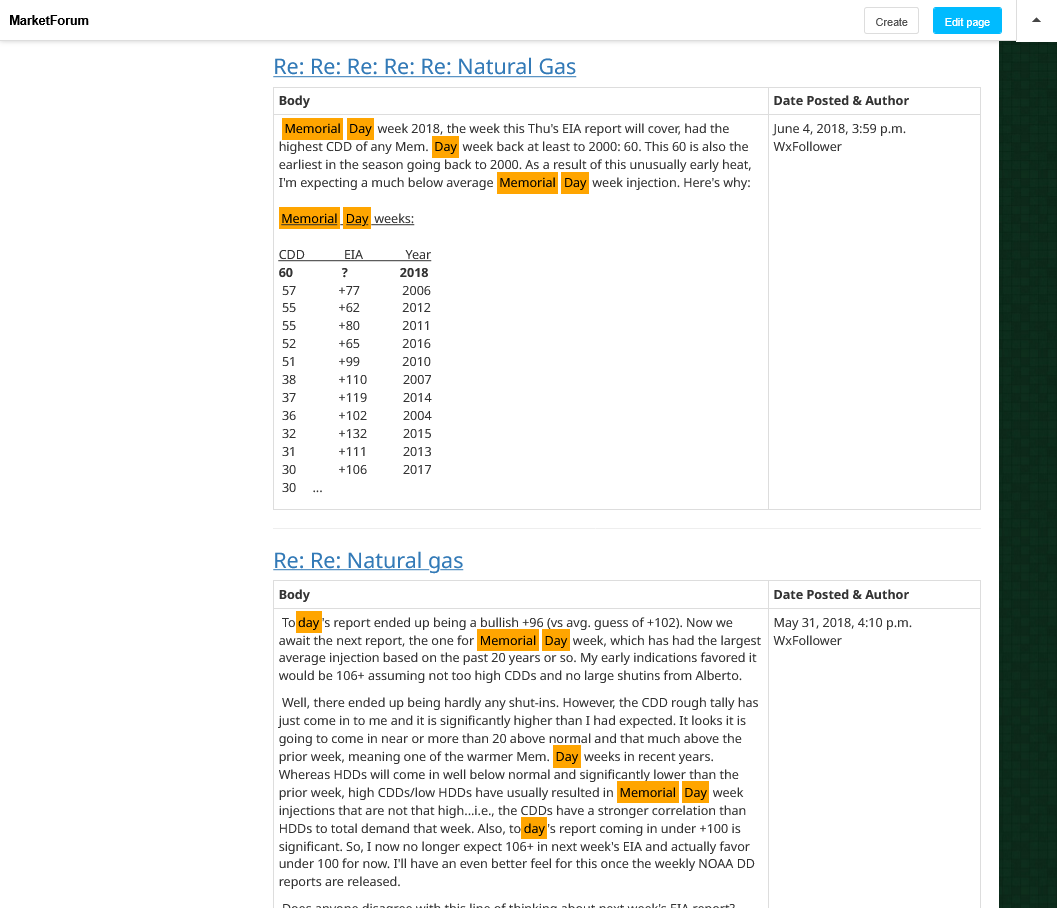
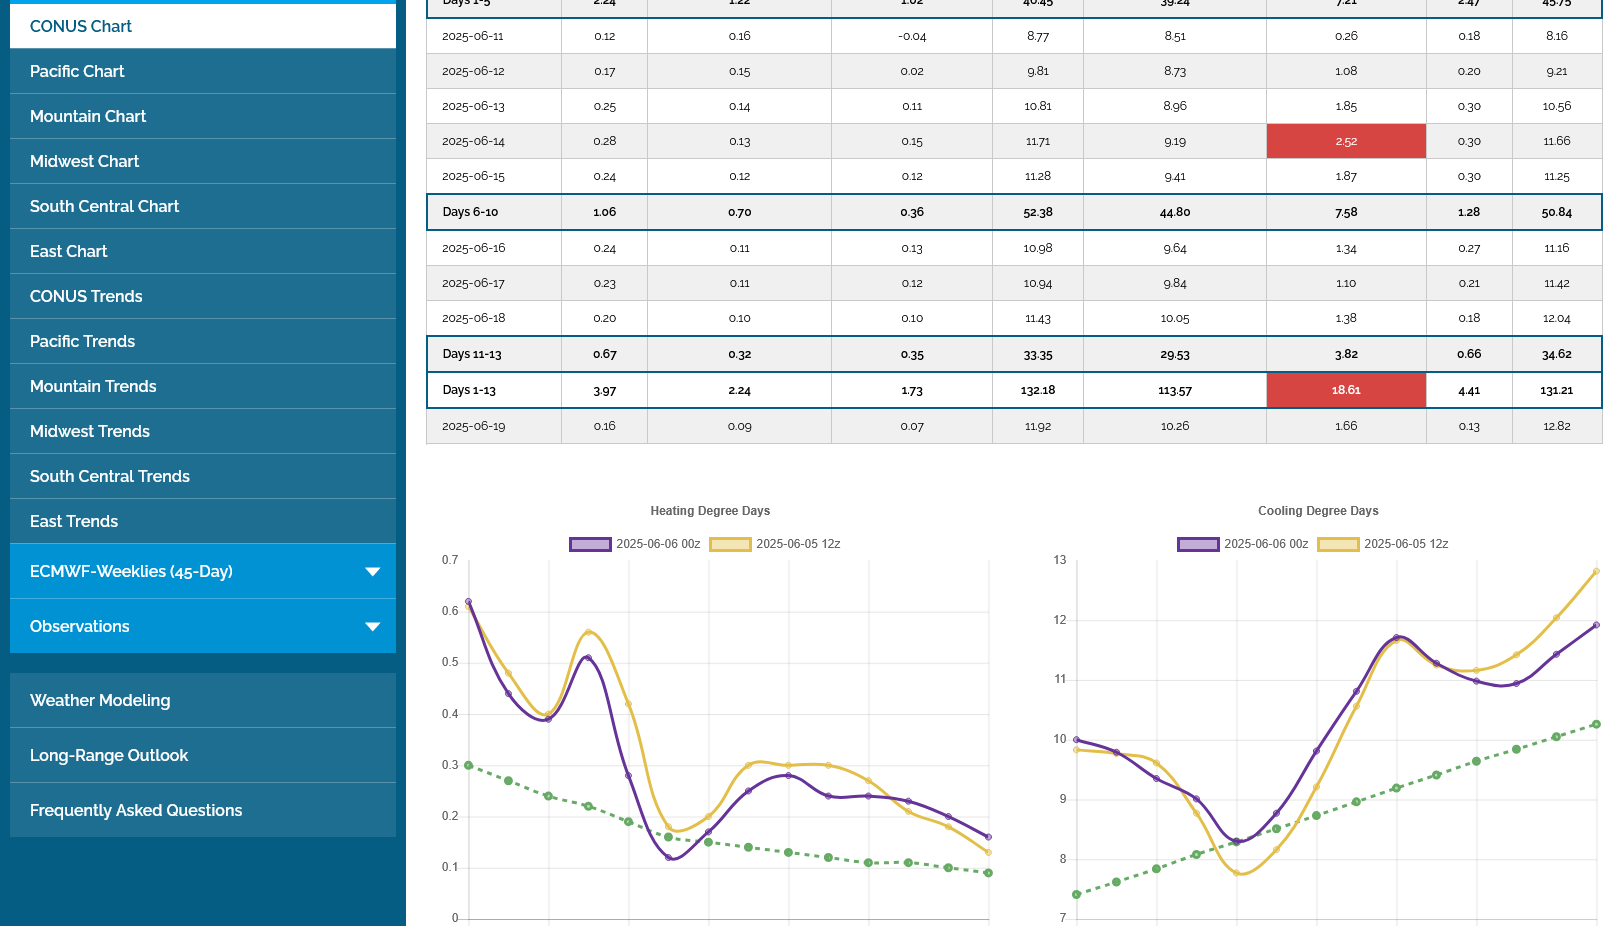
As expected, another HUGE injection of +120 Bcf! Note the blue line/current storage on the graph below is going higher at a faster rate than the 5 year average and has now been ABOVE it for several weeks and by an increasing amount each week.
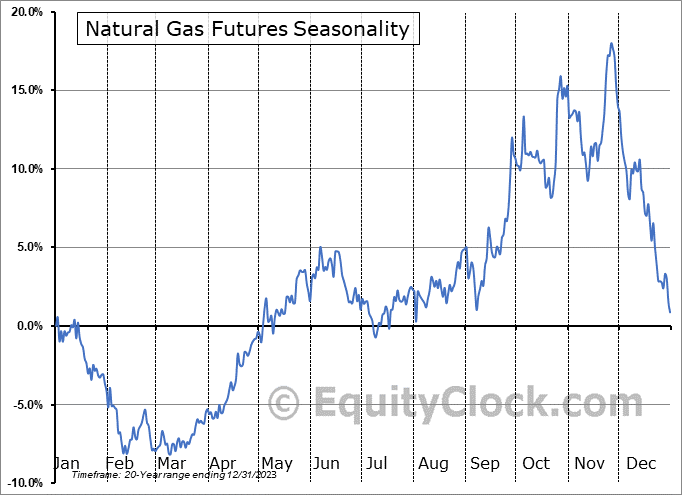
Price seasonals for NG are strongly up in April/May but each year is different. In 2025, the NG market is being crushed by increasing supplies in storage. This is a good thing for consumers! But bad for the trading bulls!
![]()
for week ending May 16, 2025 | Released: May 22, 2025 at 10:30 a.m. | Next Release: May 29, 2025 Working gas in underground storage, Lower 48 states Summary textCSVJSN Historical ComparisonsStocks
billion cubic feet (Bcf) Year ago
(05/16/24)5-year average
Working gas in storage was 2,375 Bcf as of Friday, May 16, 2025, according to EIA estimates. This represents a net increase of 120 Bcf from the previous week. Stocks were 333 Bcf less than last year at this time and 90 Bcf above the five-year average of 2,285 Bcf. At 2,375 Bcf, total working gas is within the five-year historical range.
For information on sampling error in this report, see Estimated Measures of Sampling Variability table below.

Note: The shaded area indicates the range between the historical minimum and maximum values for the weekly series from 2020 through 2024. The dashed vertical lines indicate current and year-ago weekly periods.
++++++++++++++++
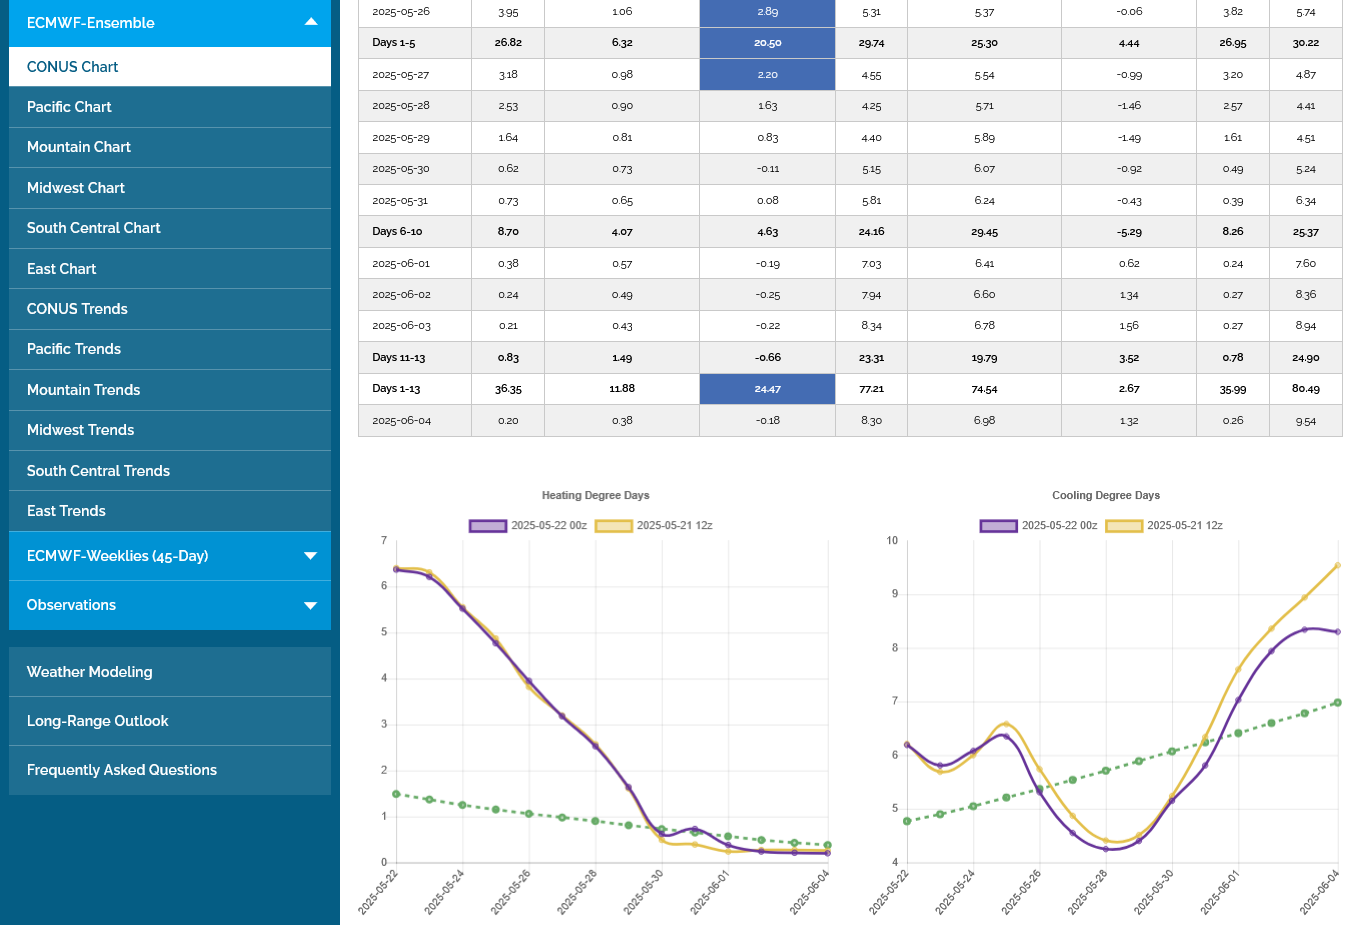
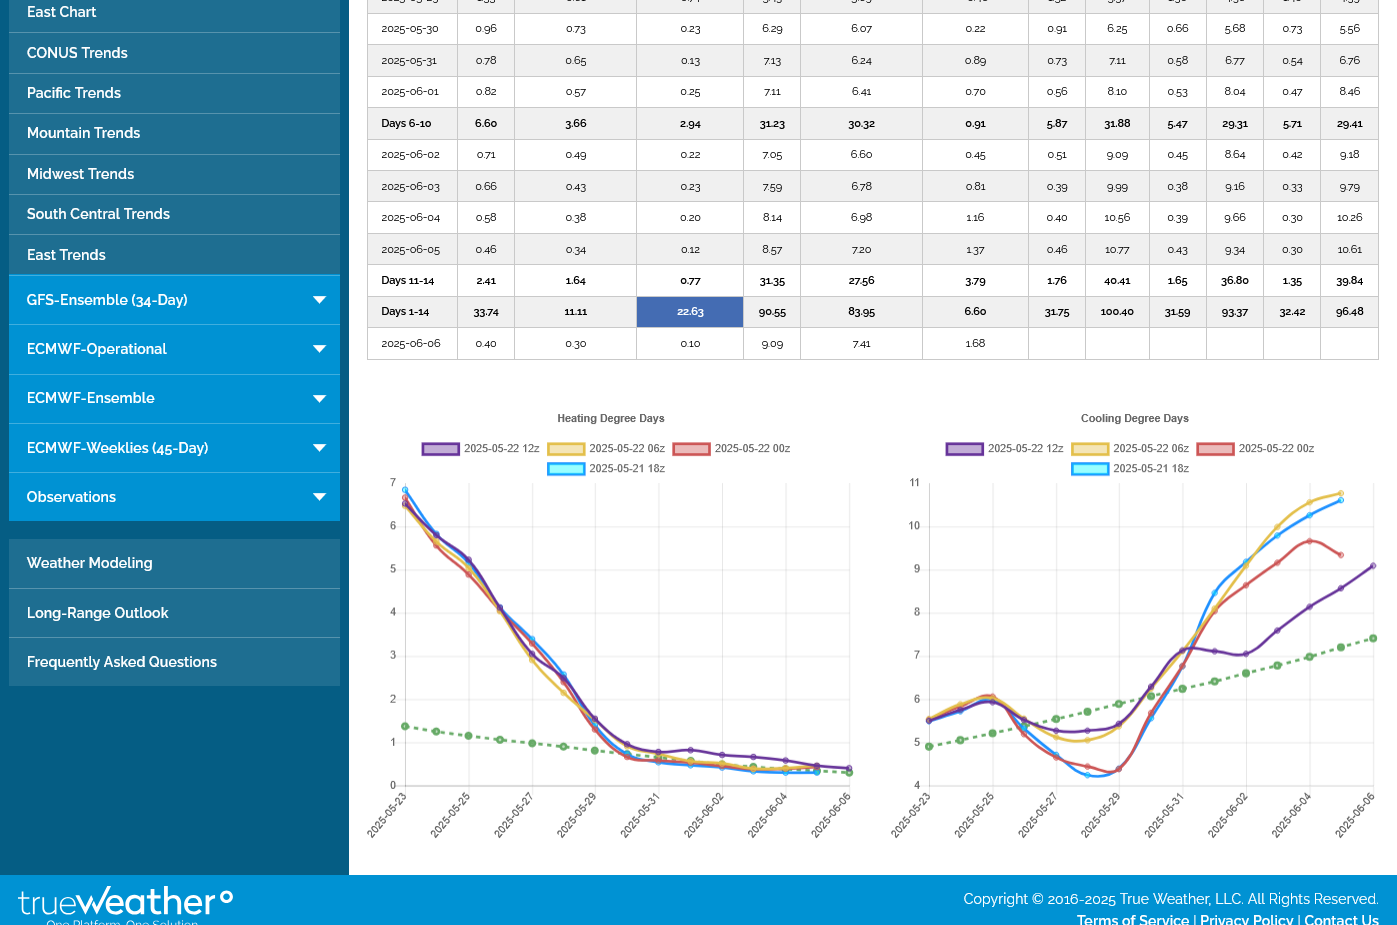
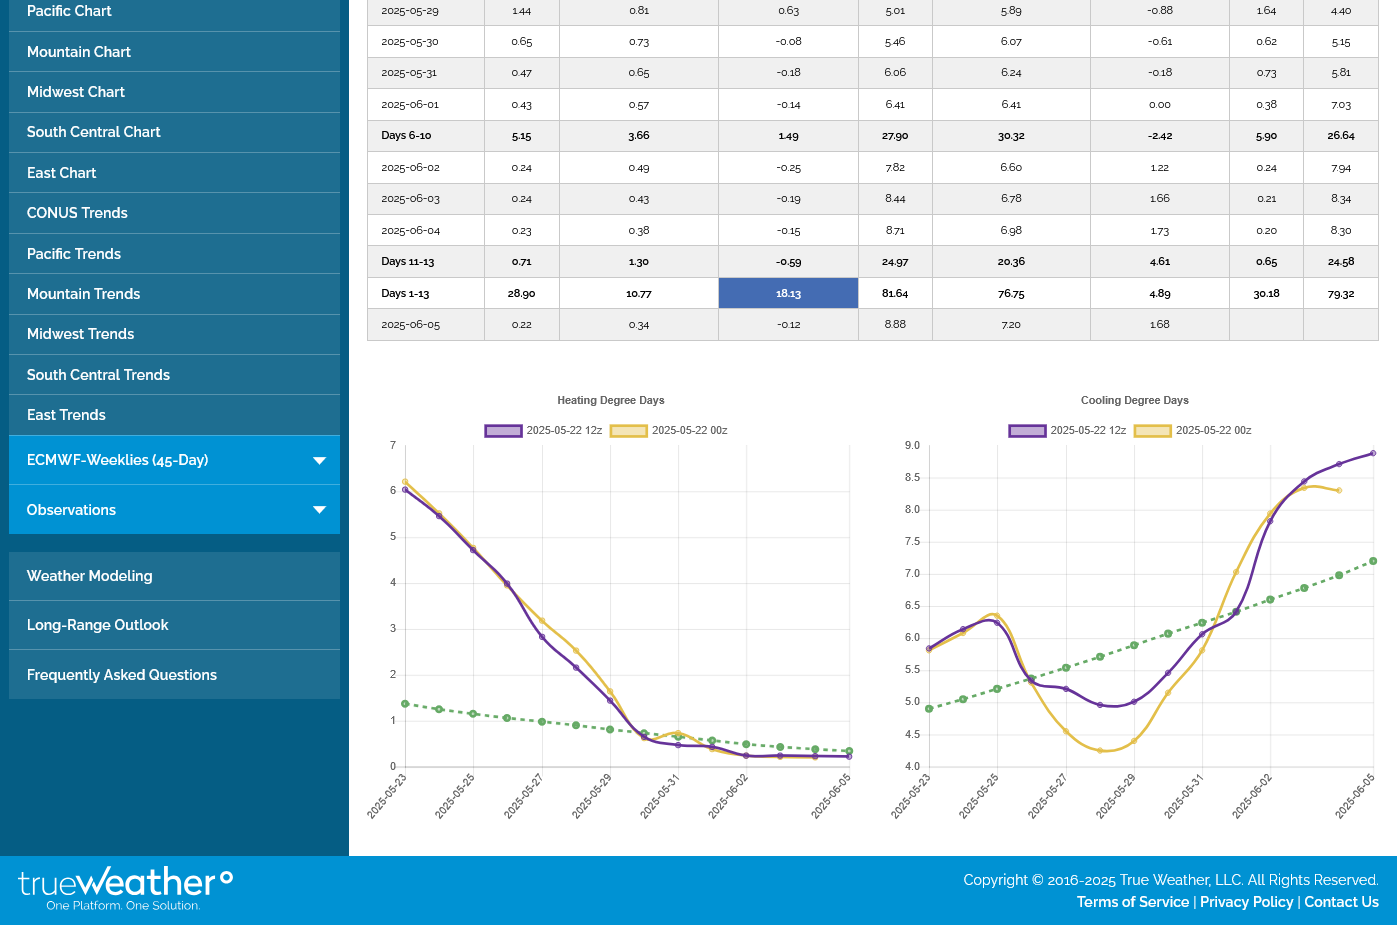
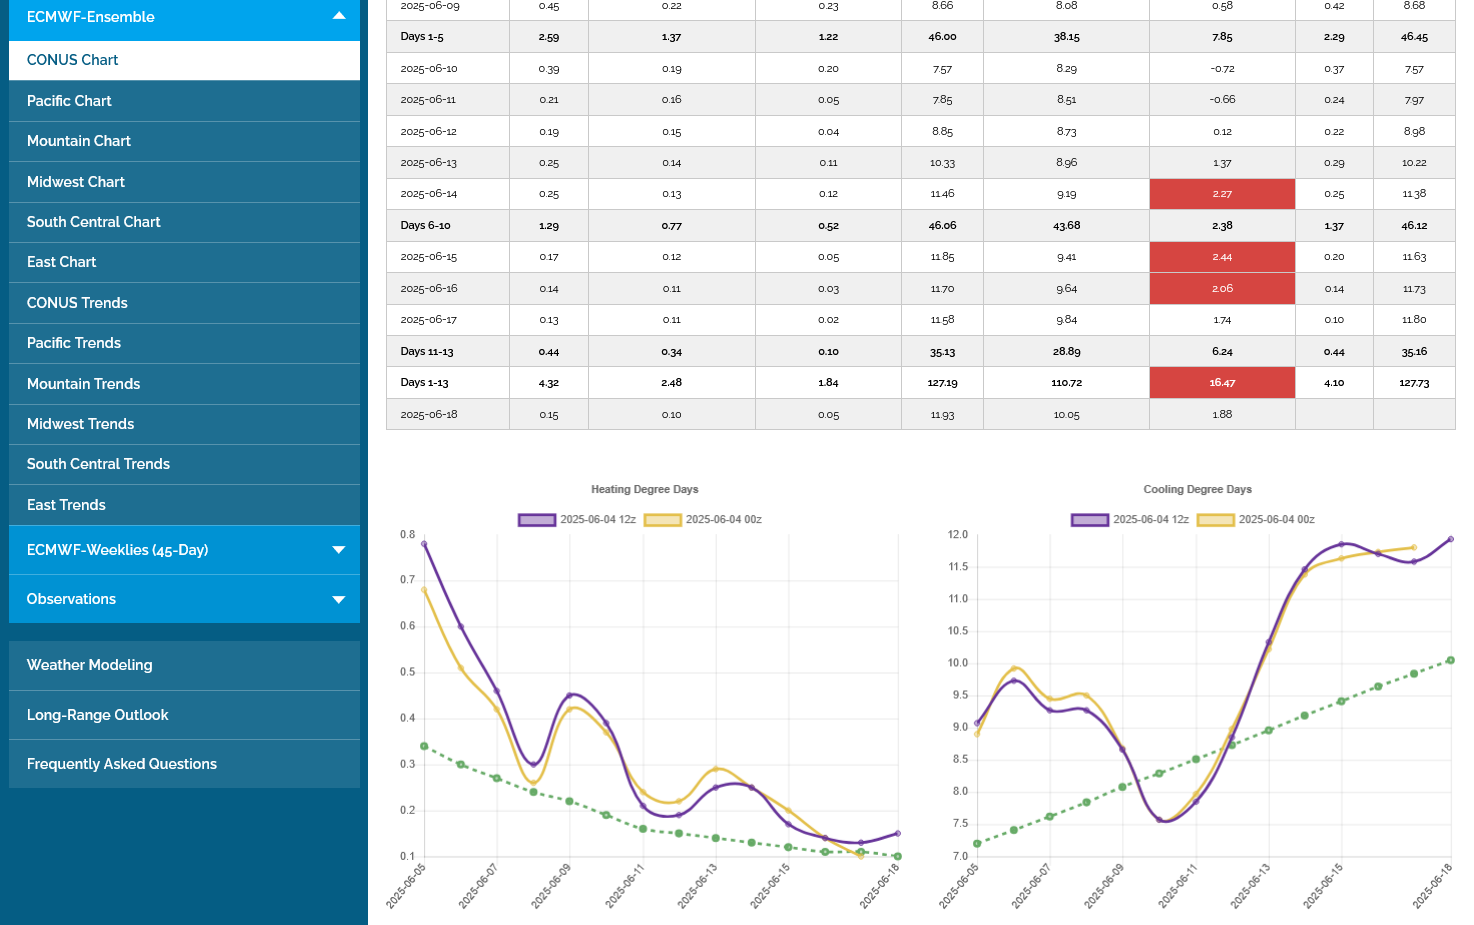
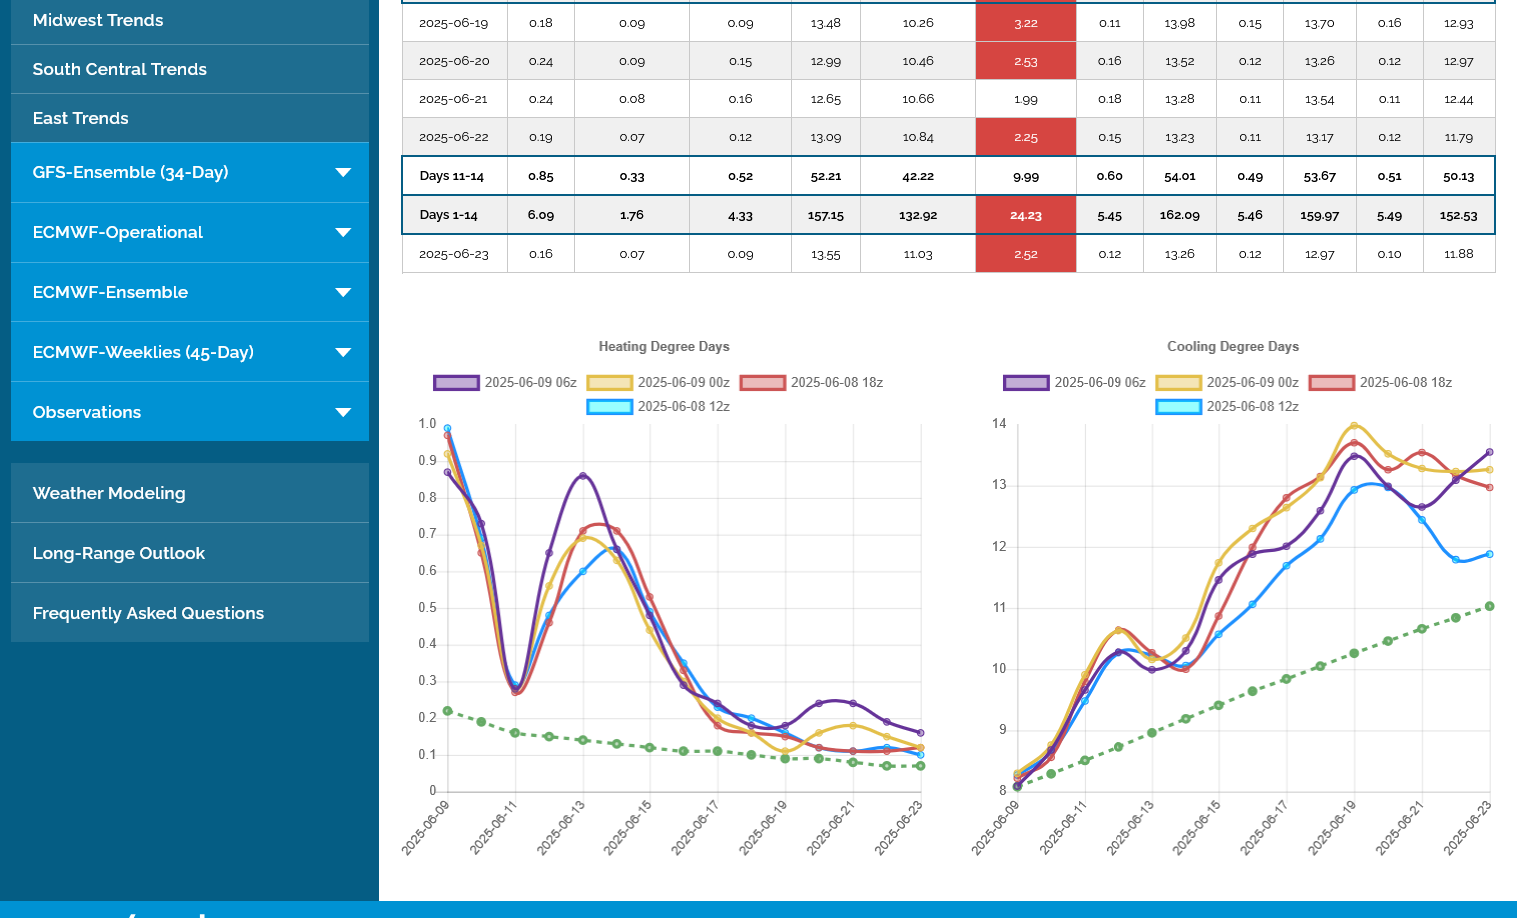
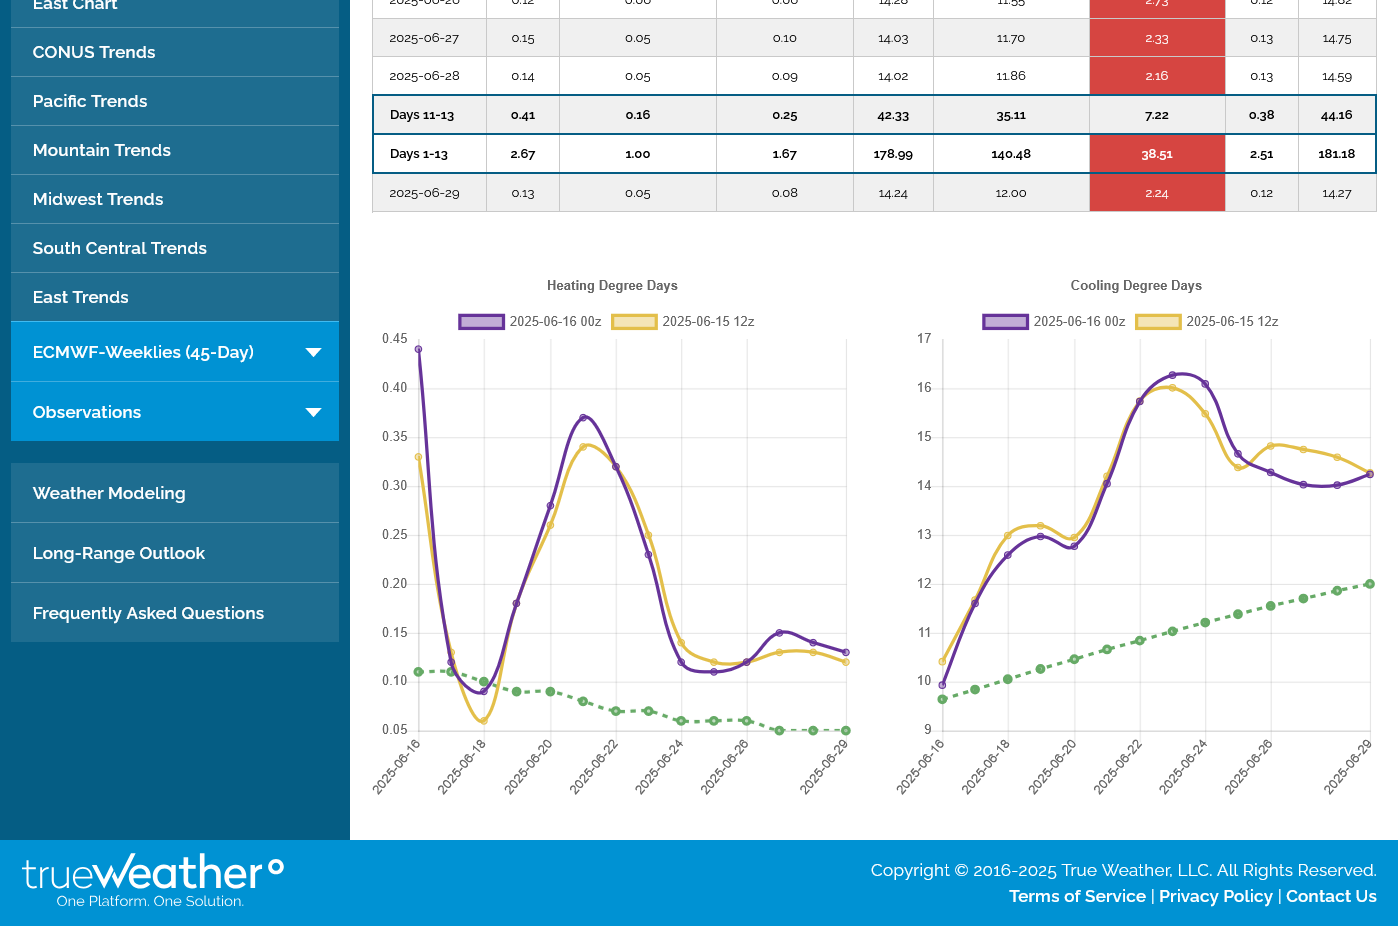
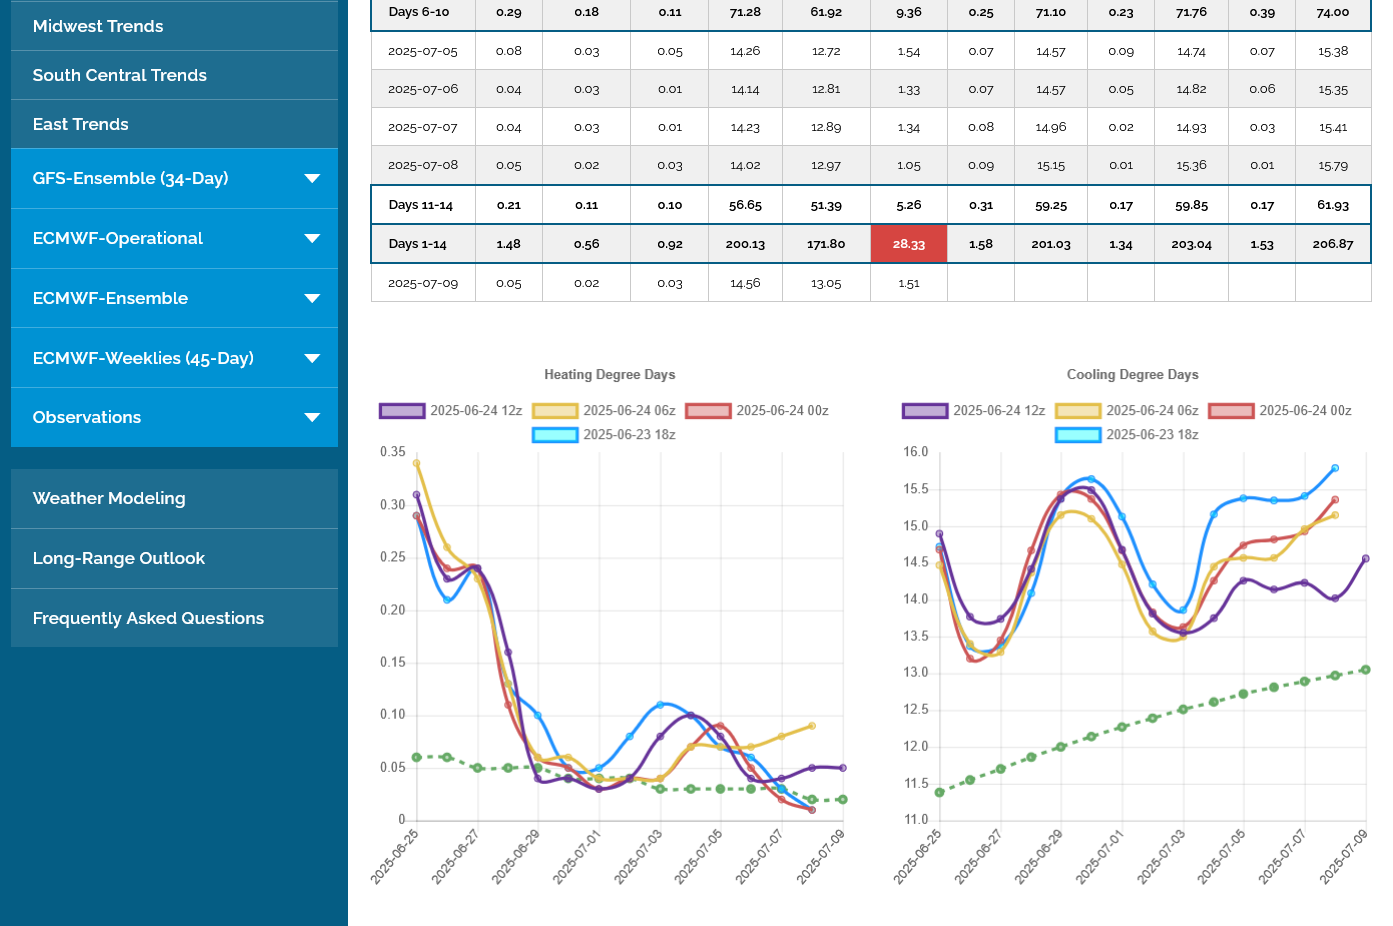
The last 0z European Ensemble(purple line on the right) was -6 CDDs(bearish). It's now the time of year when the seasonally increasing CDDs(dashed green line) are getting high enough for the market to trade it!!!
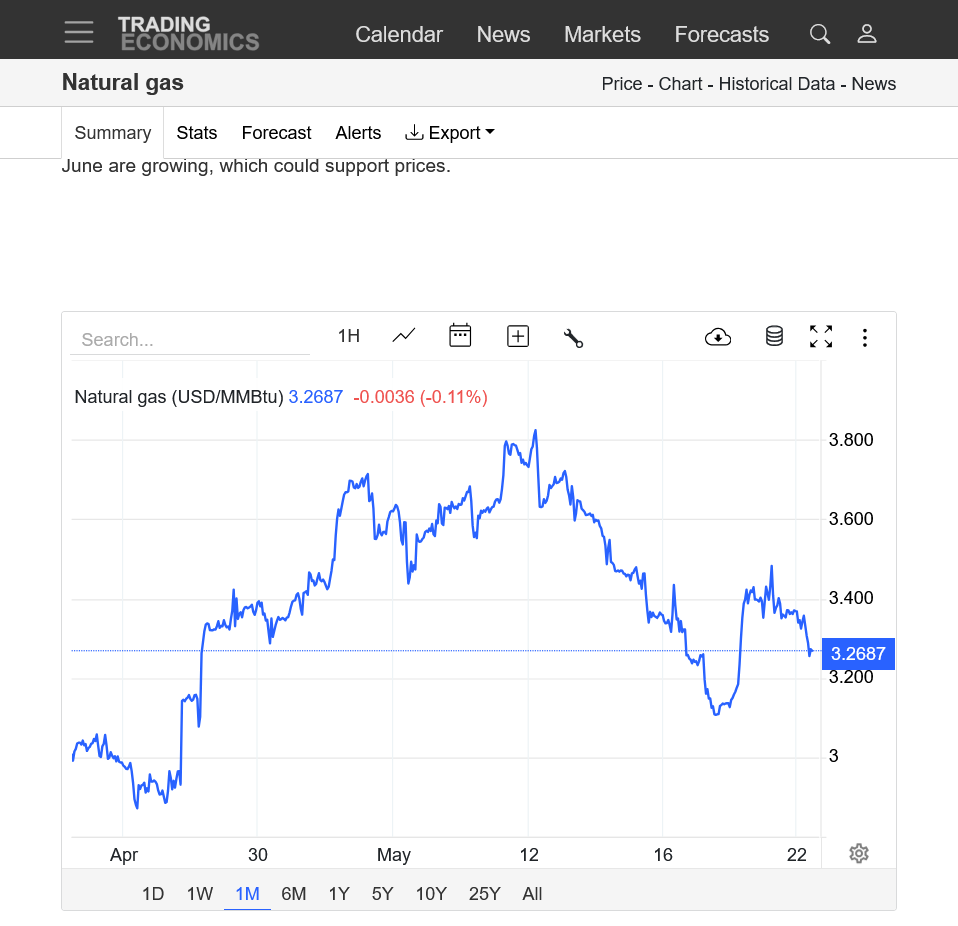
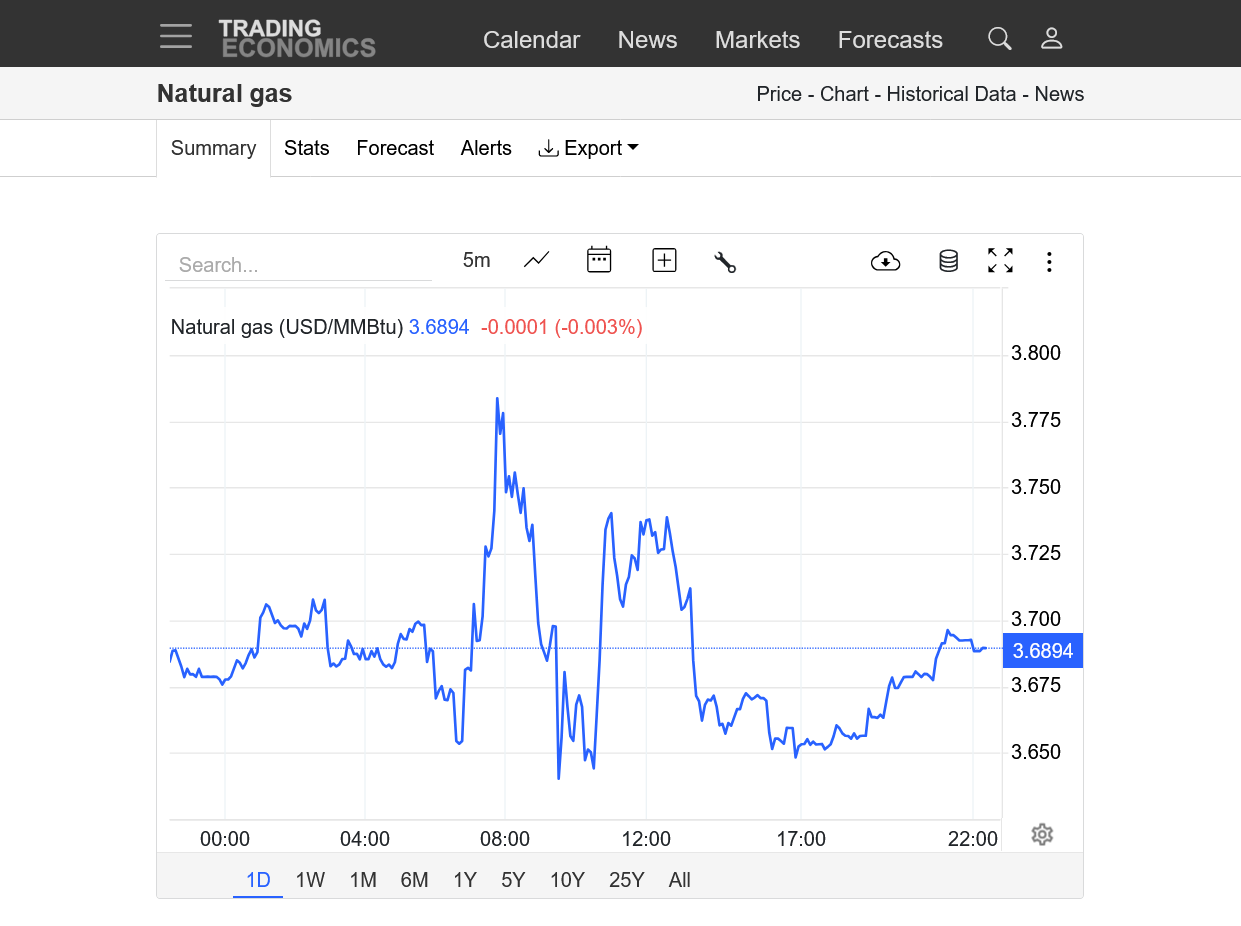
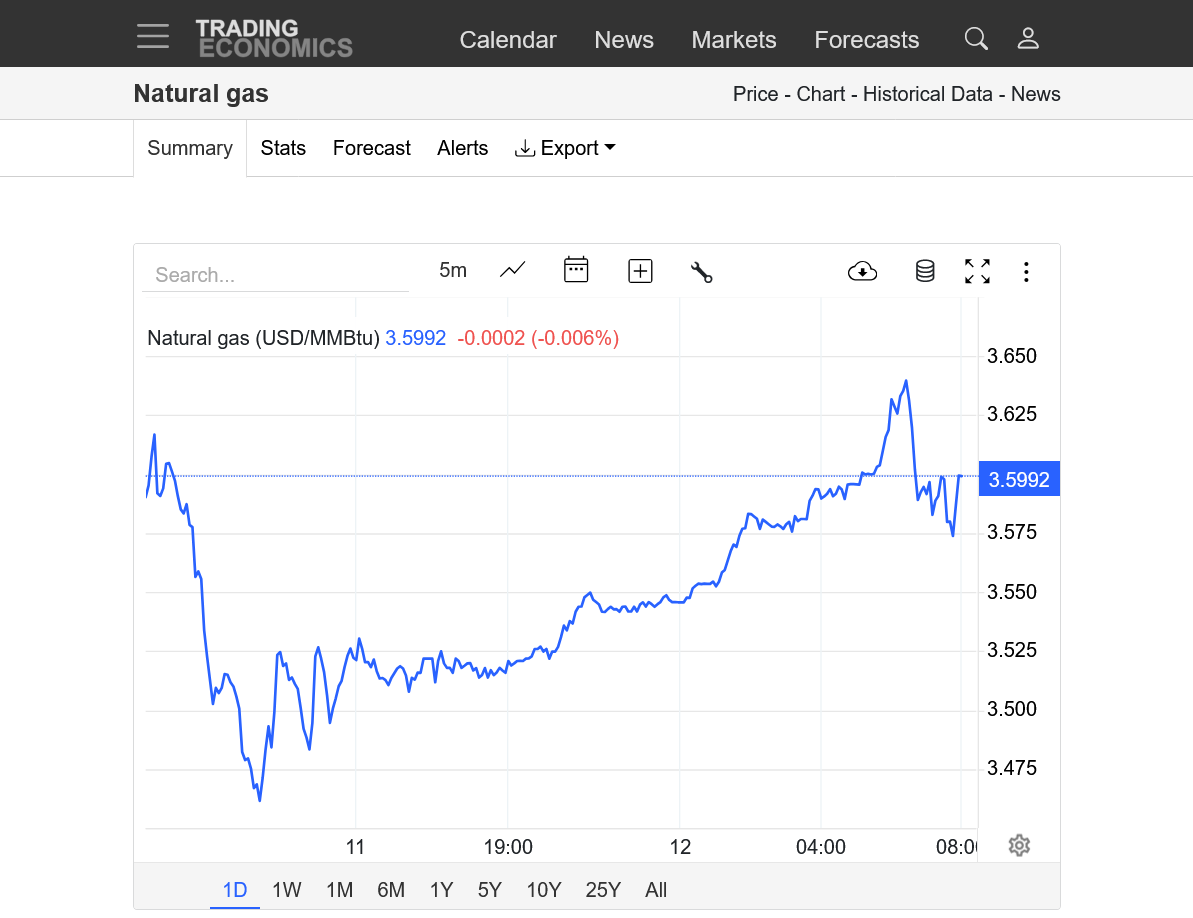
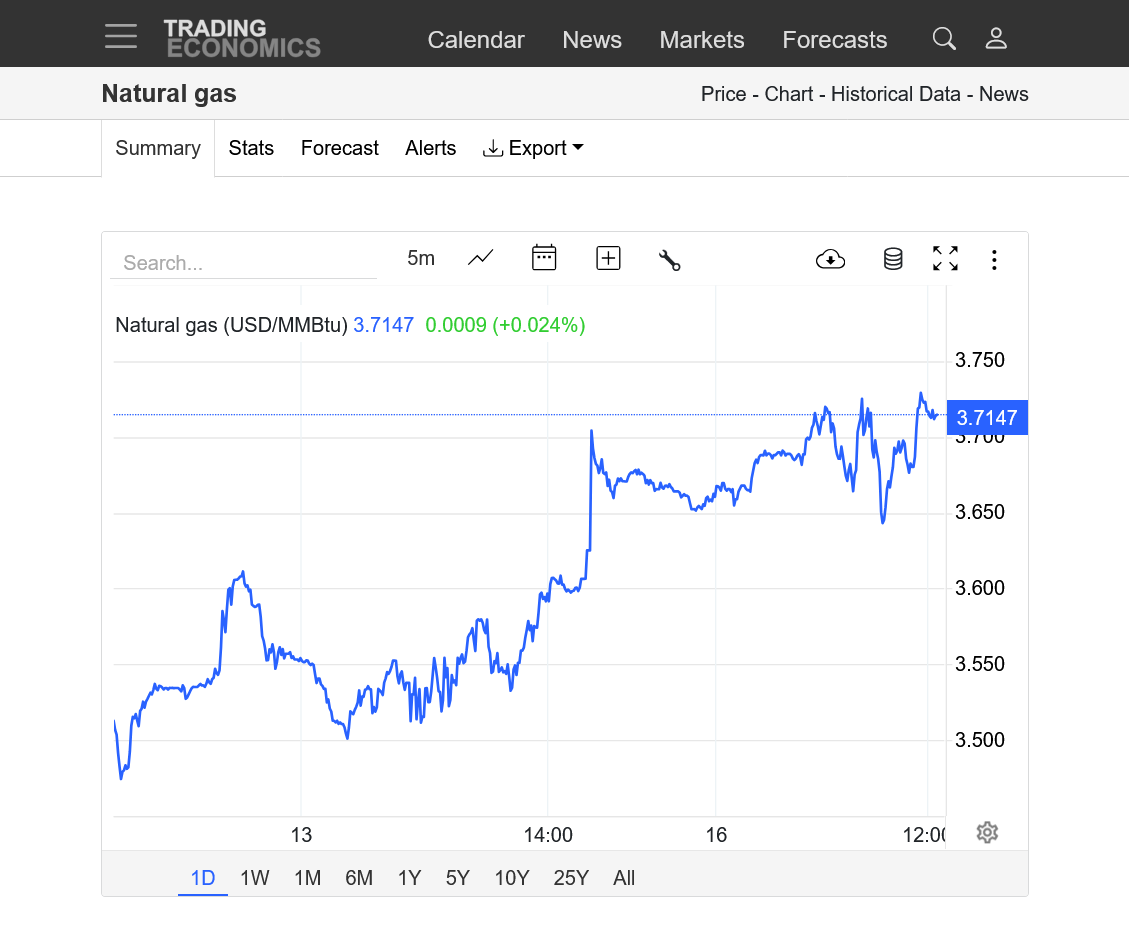
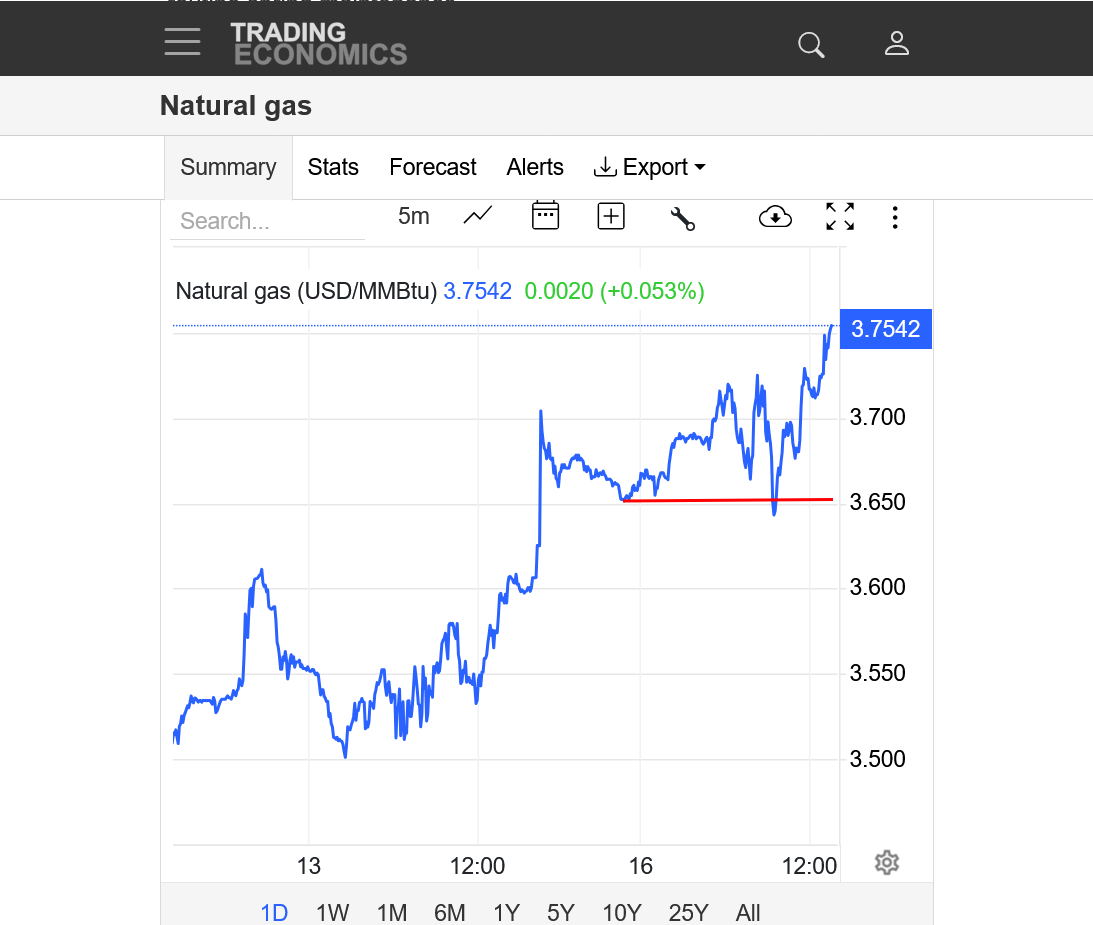
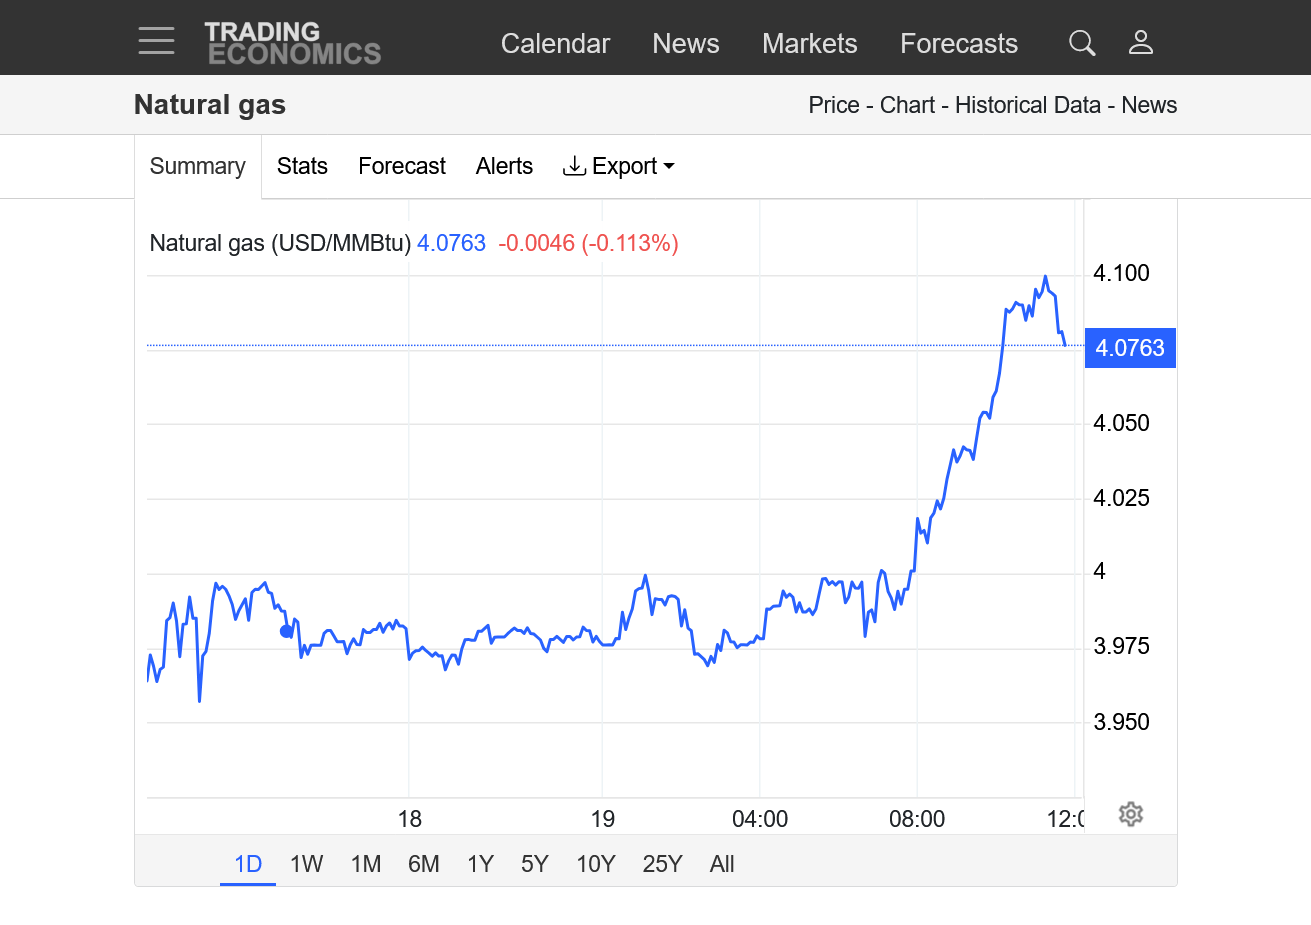
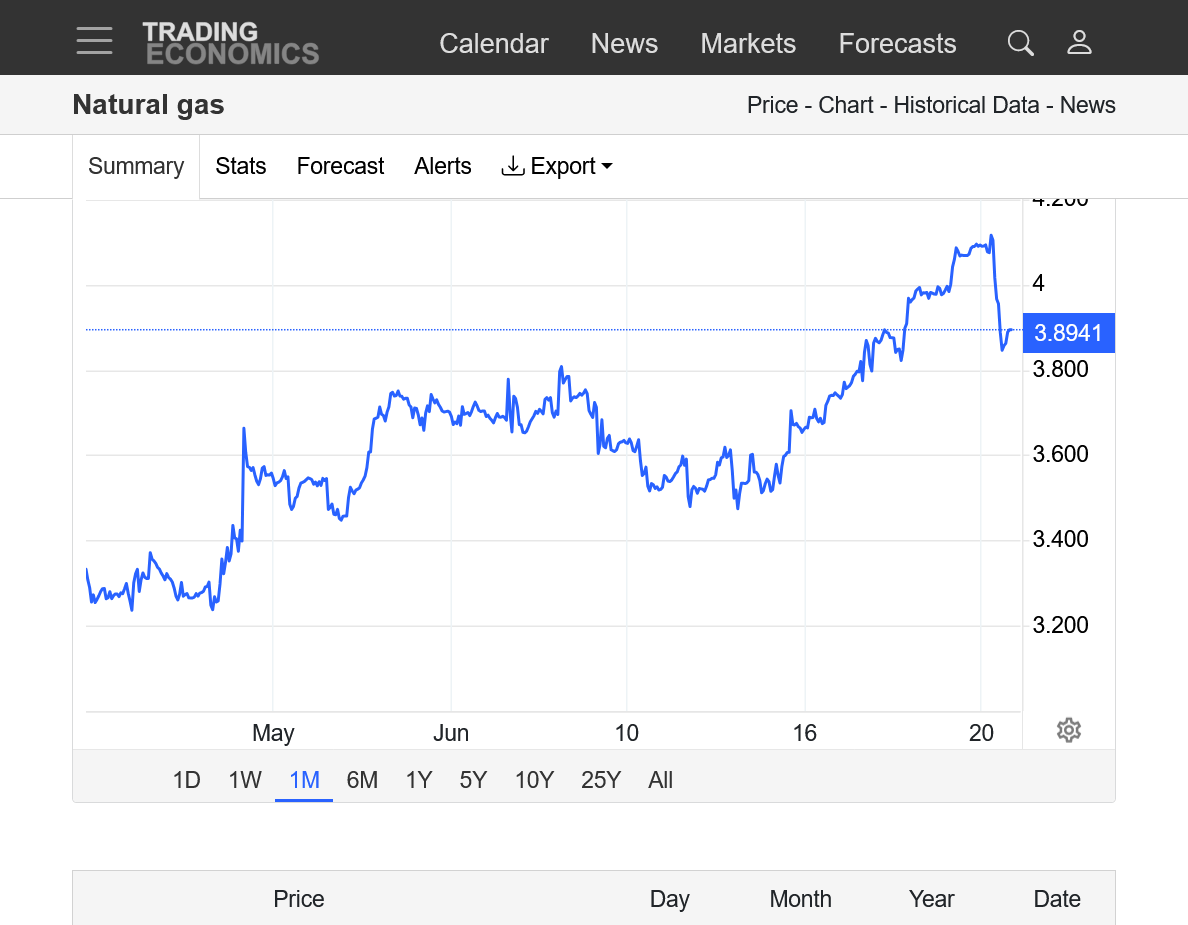
The price has been under pressure the last week+ as cooler and cooler temps in the forecast keep hitting weather traders computer screens..... including the one for June.
+++++++++++++
https://tradingeconomics.com/commodity/natural-gas
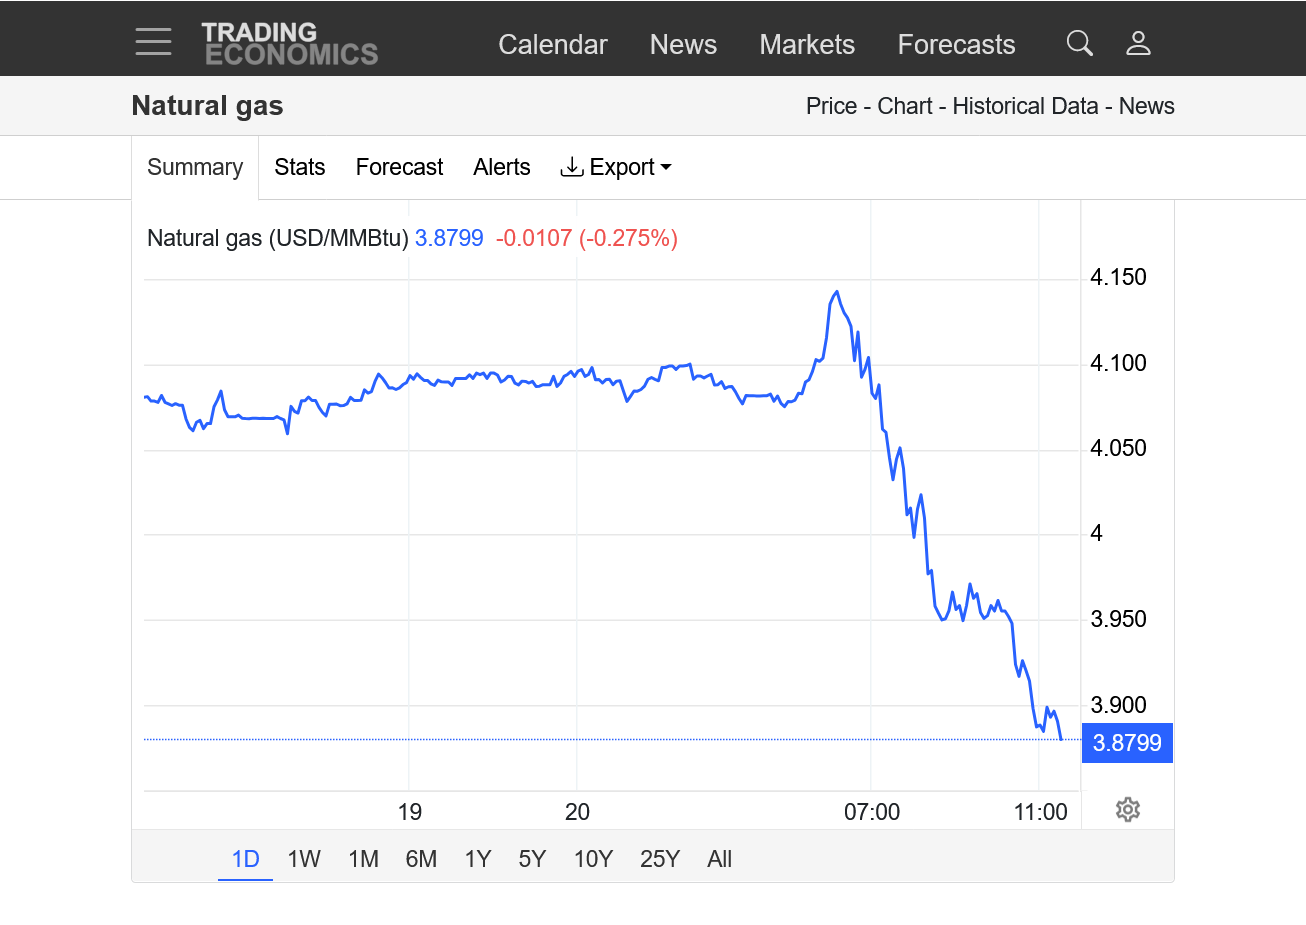
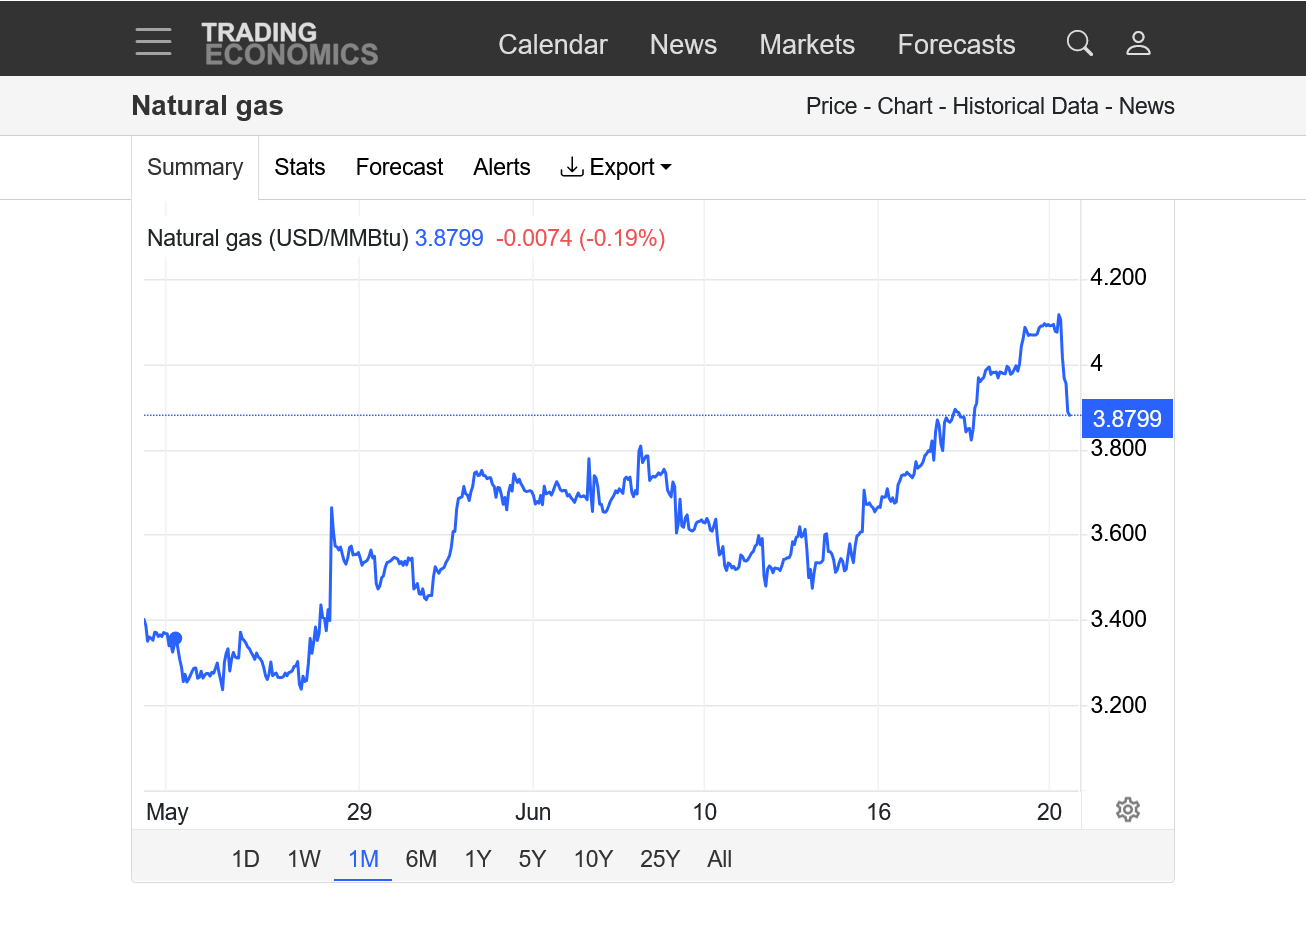
1. The last month below. Added heat in the forecast late April/early May. Much cooler mid/late last week and this week.
Re: Re: Re: Re: Natural gas 3-20-25
By metmike - May 18, 2025, 10:11 p.m.
This was a big part of the drop in prices the last 10 days:
Time to worry about 1930s type drought?
By metmike - May 18, 2025, 9:24 p.m.
mcfarm,
You are 100% on the money and understand this well!
The last long range European model, thru July 3rd has cooled off even more and added more rains in the Midwest:
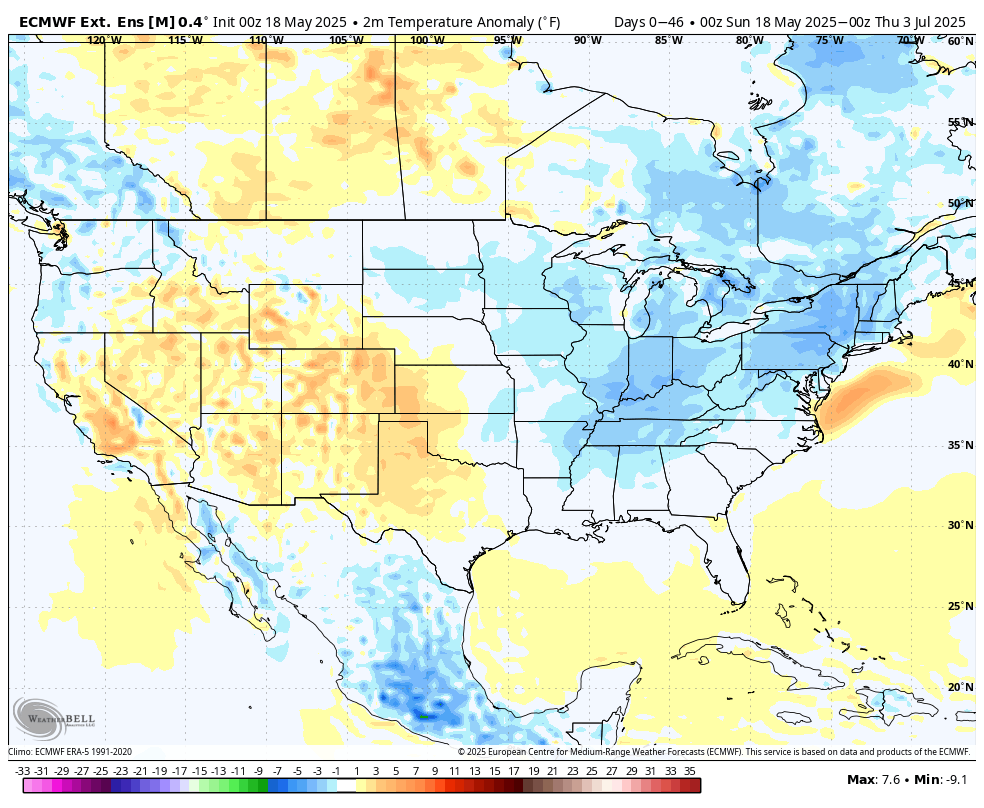
This was the same forecast just 9 days ago:
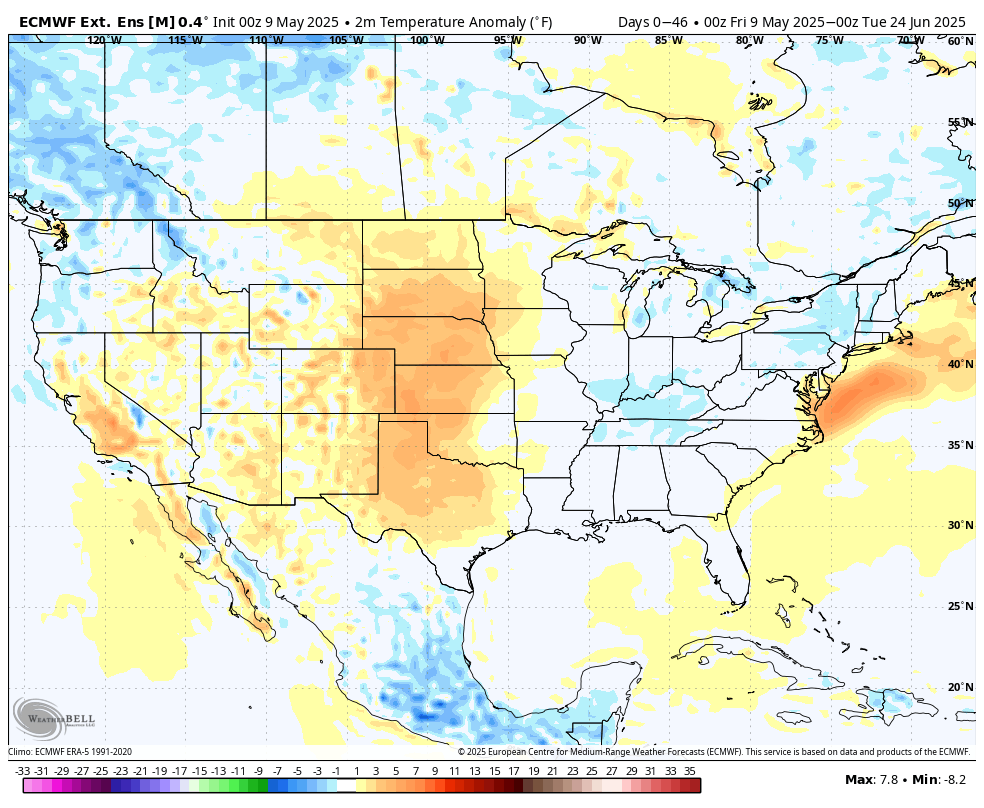
I'm speculating that much of this cooler weather is dialed in and within the next several days, the forecasts will start to increase the heat on the back end of the forecast and MAYBE add some support.
The only thing is that June typically slips the seasonals from positive to negative and there is tremendous uncertainty about the economy because of Trumps policies.
Having a position in any of the markets right now has added risk because an announcement about the tariffs can spike the price in either direction at any time.
If you trade with tight stops in natural gas, you'll get stopped out, then it will go the other way. Big traders using algorithms know where the stops are and they constantly use that to cause an extremely volatile, spiky market........even when the market is trending in 1 direction.
I haven't traded it for awhile because of that but am definitely not retired from trading like Larry. In fact, I am anticipating some trades this Summer but am not sure. Regardless, gathering information and analyzing it is great fun and free!! Sharing it makes it that much more fun!
Natural gas almost always goes higher in April/May but each year is different.
We crashed lower in 2020 because of COVID(MUCH less industrial demand) and made a major spike low in June.
2025 has also been weak because the fundamentals are causing massive injections.
Bearish weather demand and increased production caused that.
https://charts.equityclock.com/natural-gas-futures-ng-seasonal-chart
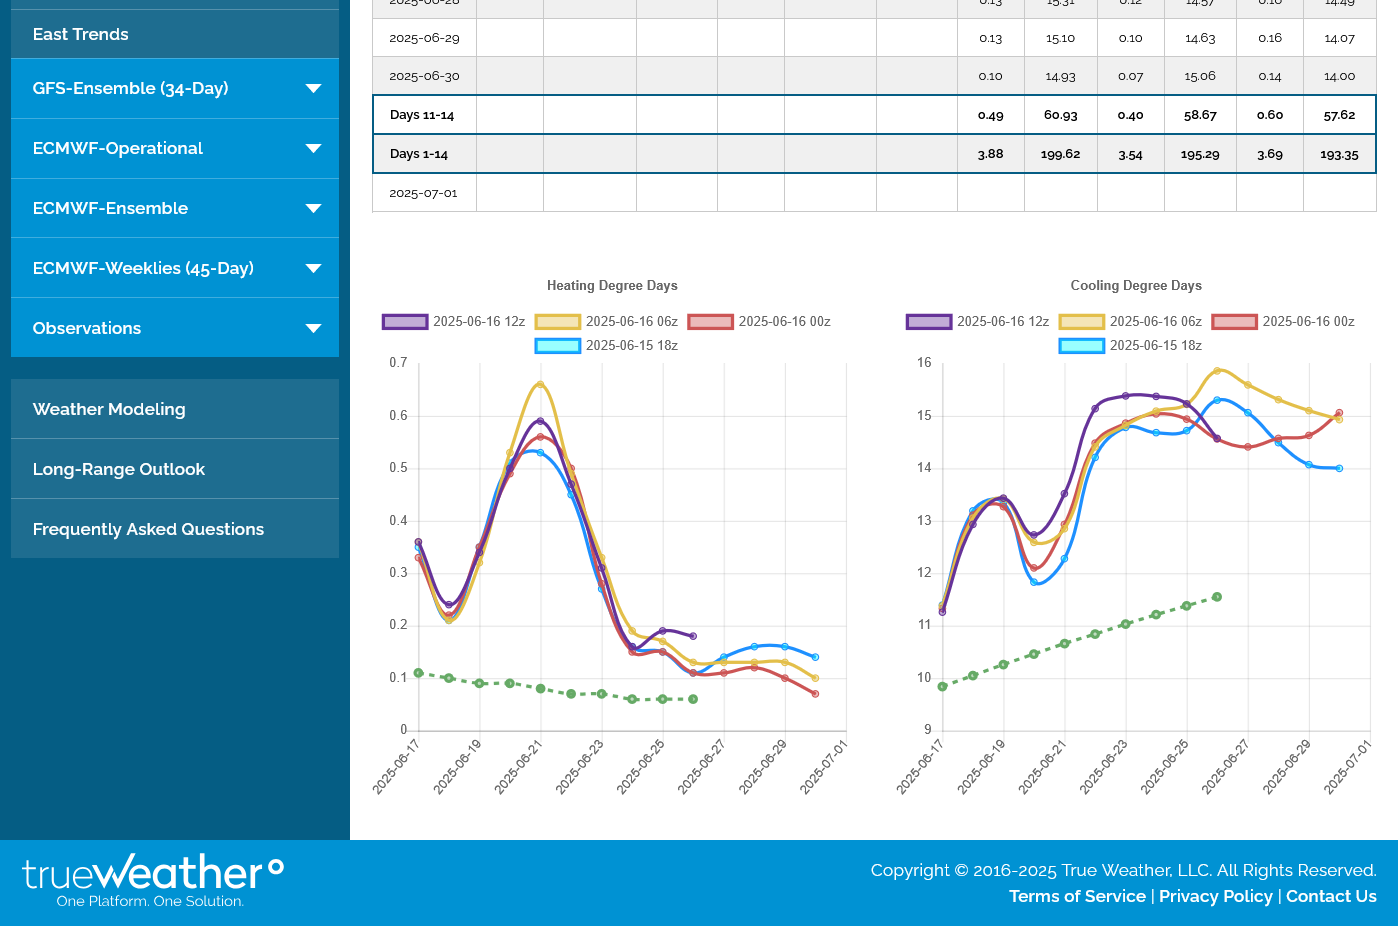
This last 12z GEFS in the purple, on the right was COOLER in week 2, when temps are predicted to heat up.
The European model actually added 2.3 CDDs in purple on the right. That might help explain the modest recovering from the spike low in the morning. I'm not sure.
However, the updated European model 46 day temperature forecast(low skill) is not that bullish:
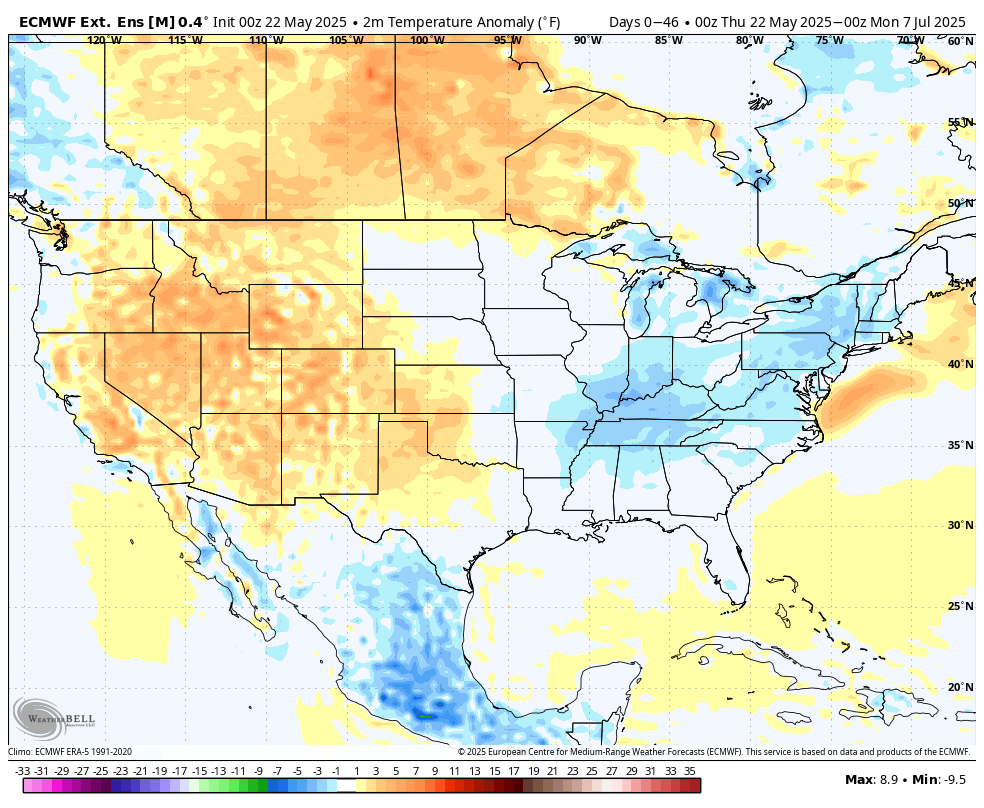
This applies to natural gas too with the caveat of the upper level ridging being more bullish the farther east that it is.
Re: Re: Re: Re: USDA May 12, 2025
By metmike - May 23, 2025, 3:51 p.m.
The markets are closed until Monday evening but the forecasts may turn bullish next week:
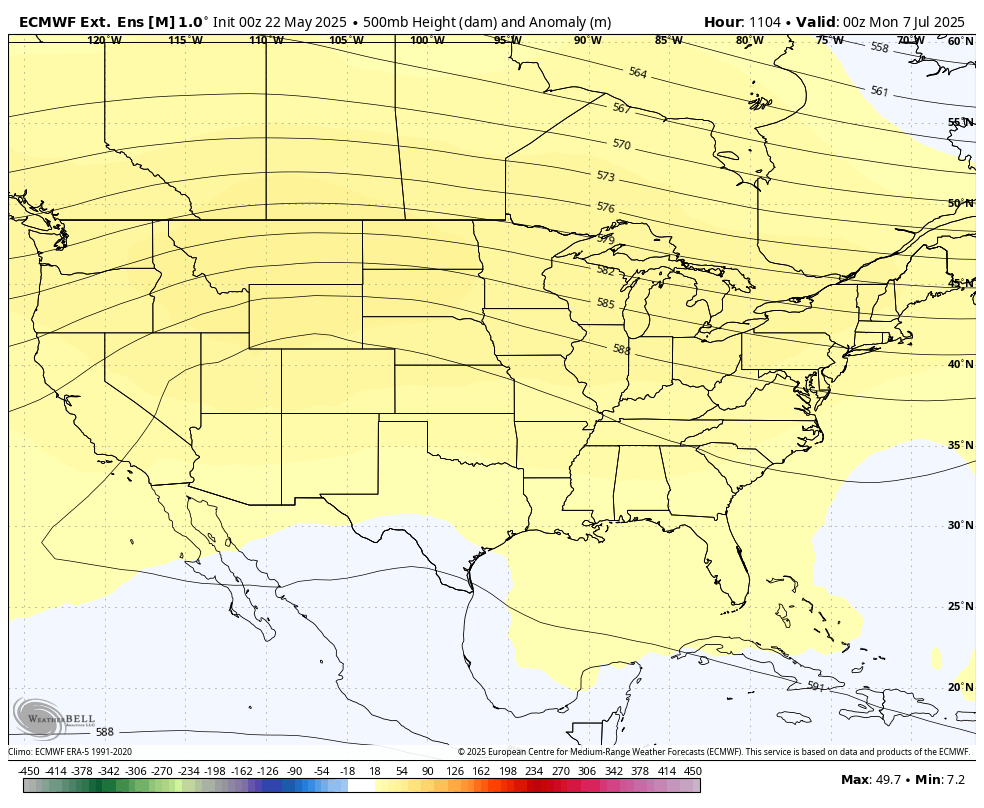
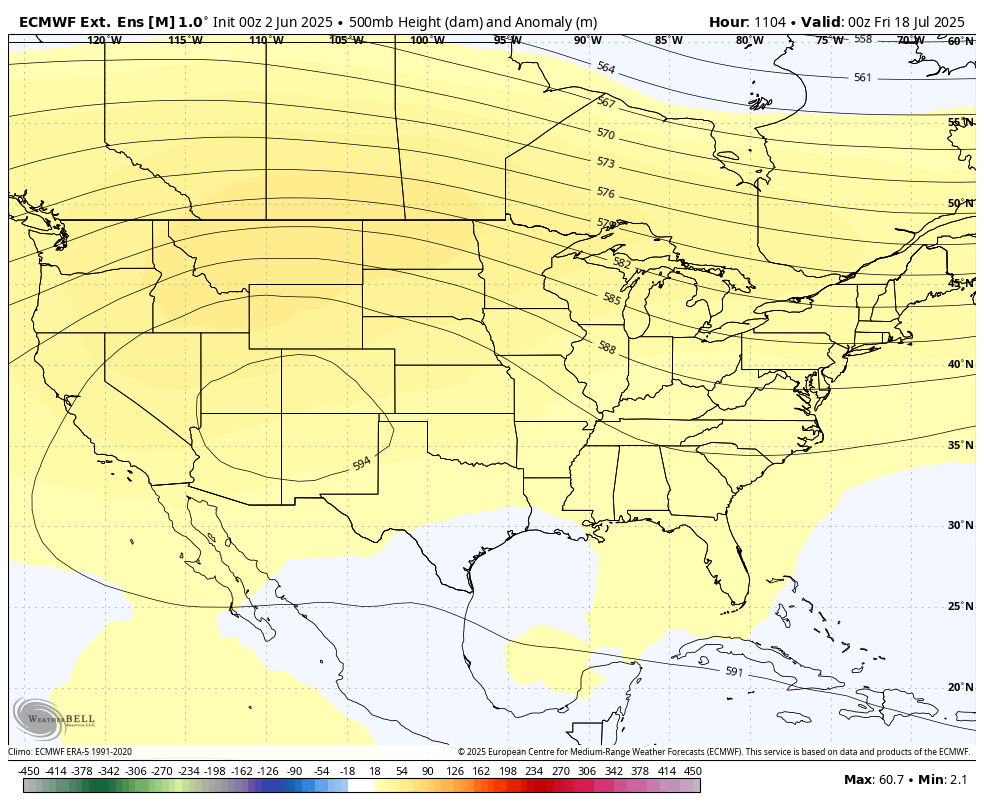
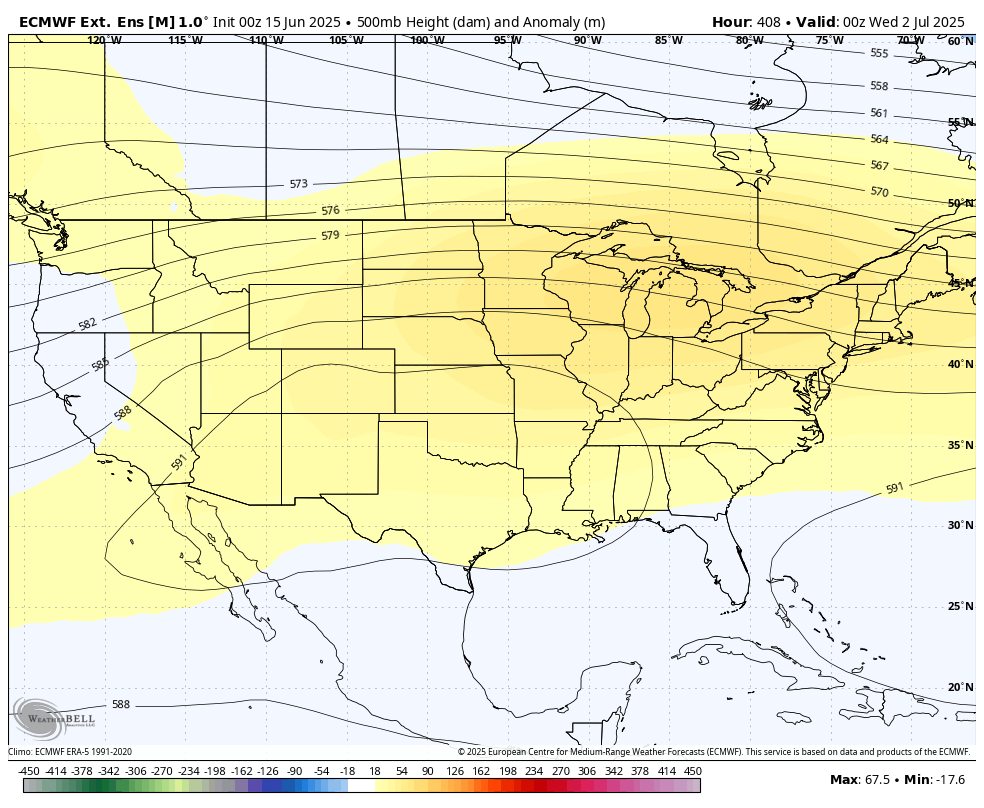
This is the upper level forecast at 500 mb with anomalies in color, at the end of the first week in July from the last European Ensemble model.
Predictions this far out have low skill. However, IF this is close to being correct, corn and beans will likely see some strength from bullish weather in June.
The stronger the upper level ridge is and farther north it is, the more bullish it will be.
Another triple digit injection and gain vs the previous years. Note the blue line of current storage climbing faster than anything else on the graph below:
https://ir.eia.gov/ngs/ngs.html
![]()
for week ending May 23, 2025 | Released: May 29, 2025 at 10:30 a.m. | Next Release: June 5, 2025
| Working gas in underground storage, Lower 48 states Summary text CSV JSN | |||||||||||||||||||||||||
|---|---|---|---|---|---|---|---|---|---|---|---|---|---|---|---|---|---|---|---|---|---|---|---|---|---|
| Historical Comparisons | |||||||||||||||||||||||||
| Stocks billion cubic feet (Bcf) | Year ago (05/23/24) | 5-year average (2020-24) | |||||||||||||||||||||||
| Region | 05/23/25 | 05/16/25 | net change | implied flow | Bcf | % change | Bcf | % change | |||||||||||||||||
| East | 462 | 432 | 30 | 30 | 534 | -13.5 | 455 | 1.5 | |||||||||||||||||
| Midwest | 541 | 512 | 29 | 29 | 657 | -17.7 | 549 | -1.5 | |||||||||||||||||
| Mountain | 198 | 192 | 6 | 6 | 209 | -5.3 | 145 | 36.6 | |||||||||||||||||
| Pacific | 254 | 244 | 10 | 10 | 266 | -4.5 | 226 | 12.4 | |||||||||||||||||
| South Central | 1,021 | 996 | 25 | 25 | 1,127 | -9.4 | 1,008 | 1.3 | |||||||||||||||||
| Salt | 328 | 321 | 7 | 7 | 324 | 1.2 | 304 | 7.9 | |||||||||||||||||
| Nonsalt | 693 | 674 | 19 | 19 | 802 | -13.6 | 704 | -1.6 | |||||||||||||||||
| Total | 2,476 | 2,375 | 101 | 101 | 2,792 | -11.3 | 2,383 | 3.9 | |||||||||||||||||
| Totals may not equal sum of components because of independent rounding. | |||||||||||||||||||||||||
Working gas in storage was 2,476 Bcf as of Friday, May 23, 2025, according to EIA estimates. This represents a net increase of 101 Bcf from the previous week. Stocks were 316 Bcf less than last year at this time and 93 Bcf above the five-year average of 2,383 Bcf. At 2,476 Bcf, total working gas is within the five-year historical range.
For information on sampling error in this report, see Estimated Measures of Sampling Variability table below.
Note: The shaded area indicates the range between the historical minimum and maximum values for the weekly series from 2020 through 2024. The dashed vertical lines indicate current and year-ago weekly periods.
Much hotter forecast over the weekend has ng prices off to a bullish start.
These were the last 2 runs of the European Ensemble model. The CDDs are on the right, purple was the last 12z run. Green is the climatological average. Note how far above average, they are.......and sustained heat, not just a spike higher. The hottest part of the forecast is actually after this 2 week period, in week 3!
NG price charts below:
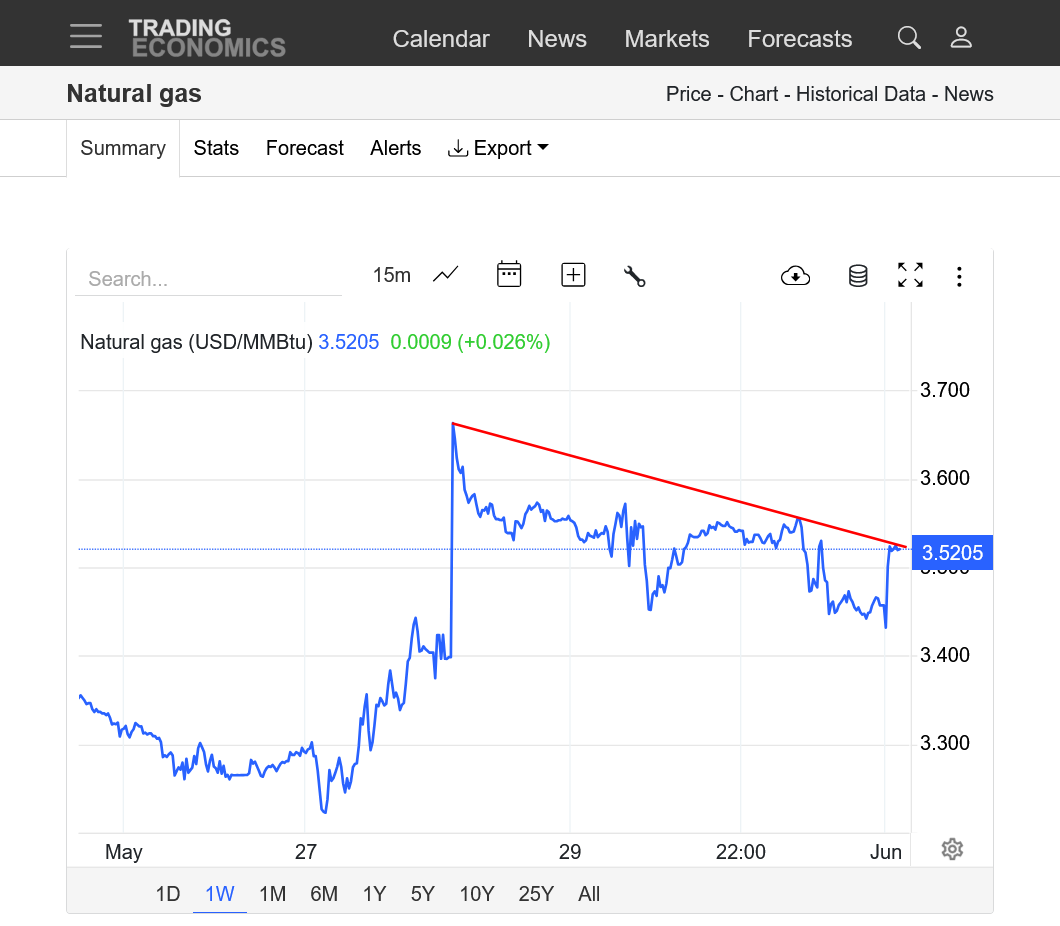
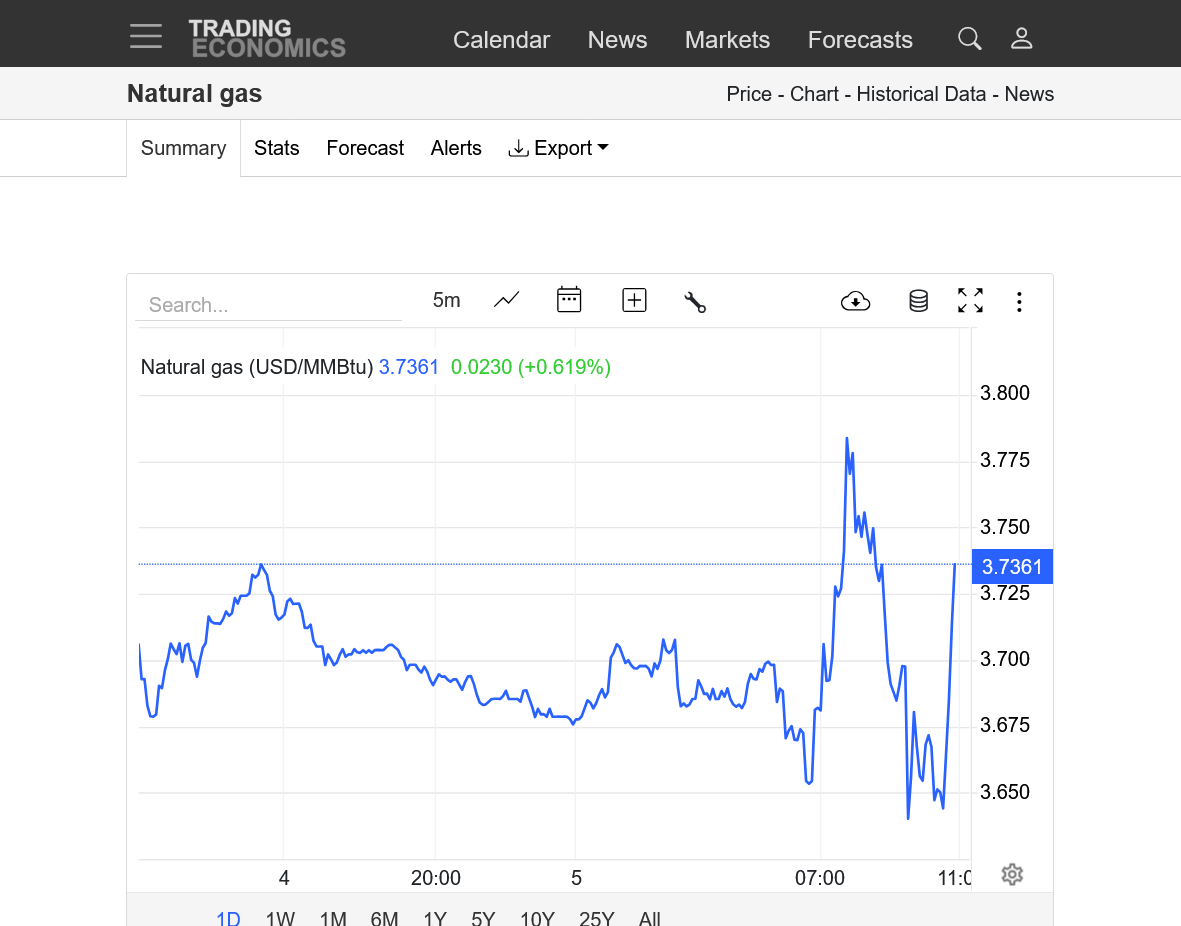
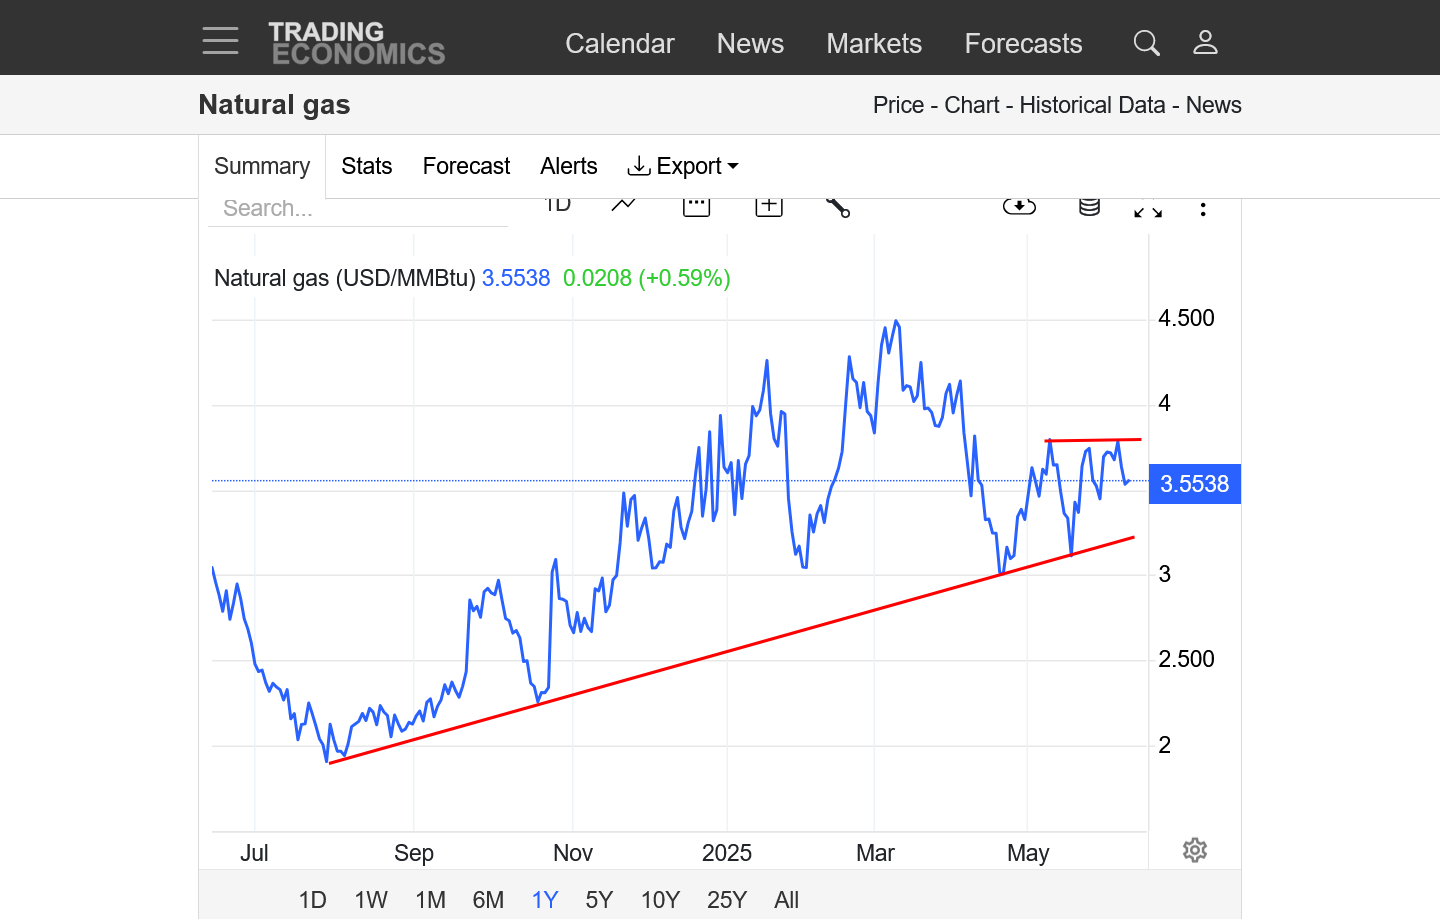
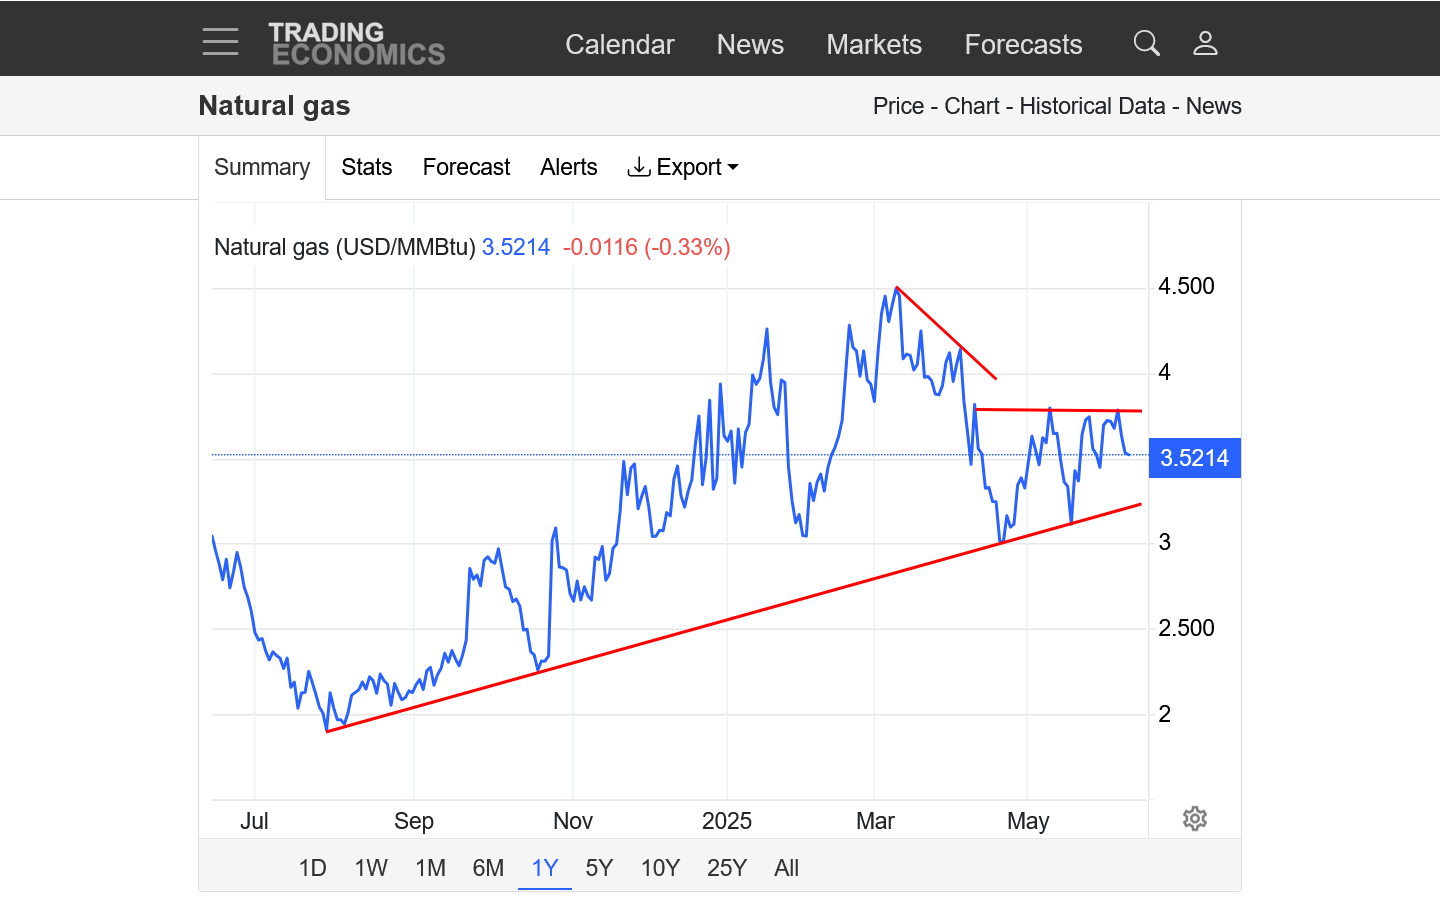
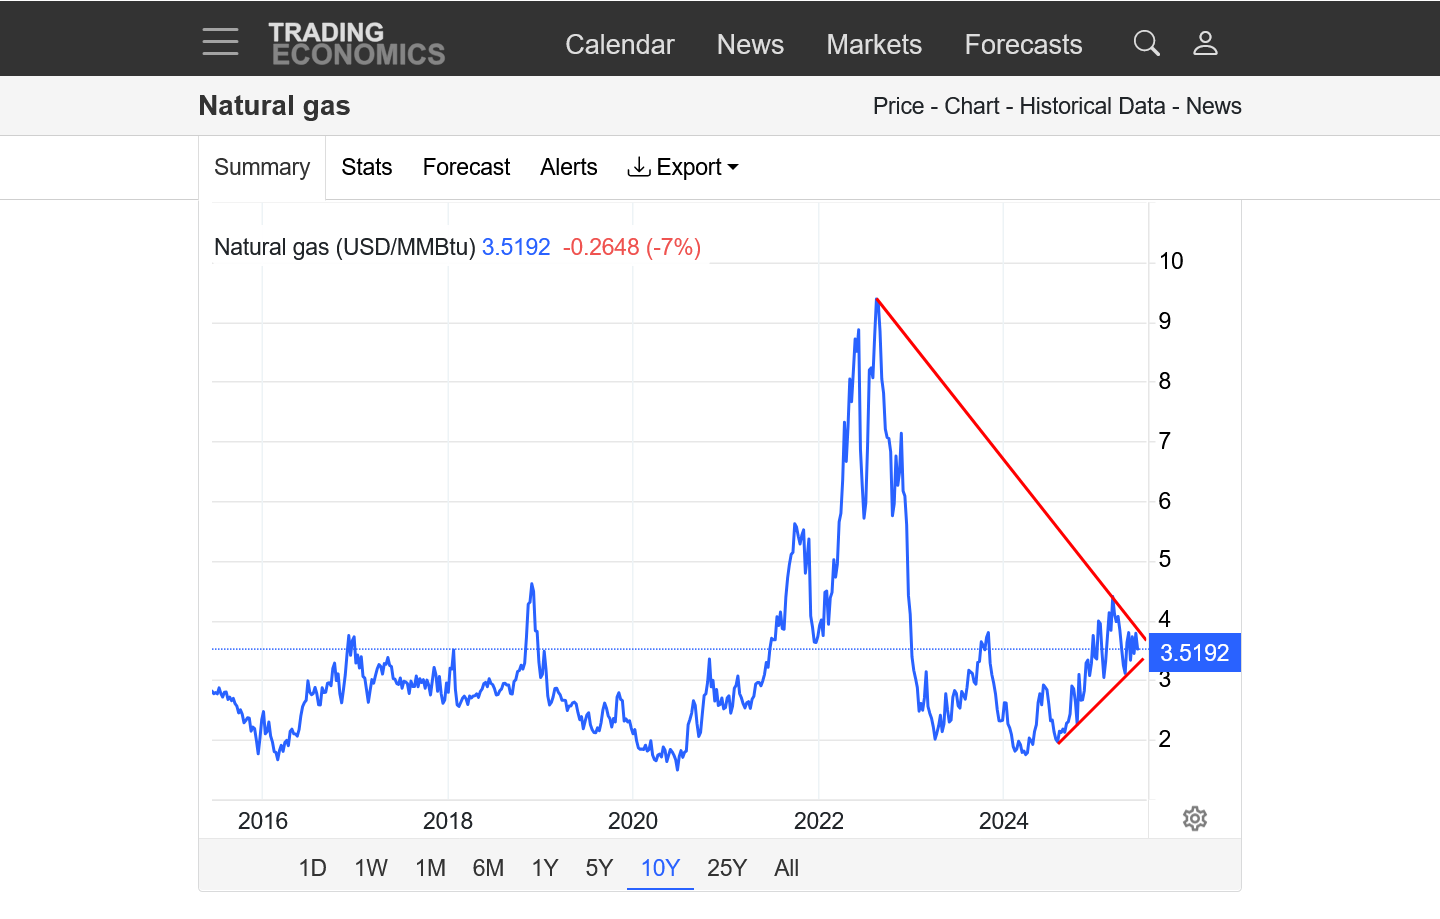
https://tradingeconomics.com/commodity/natural-gas
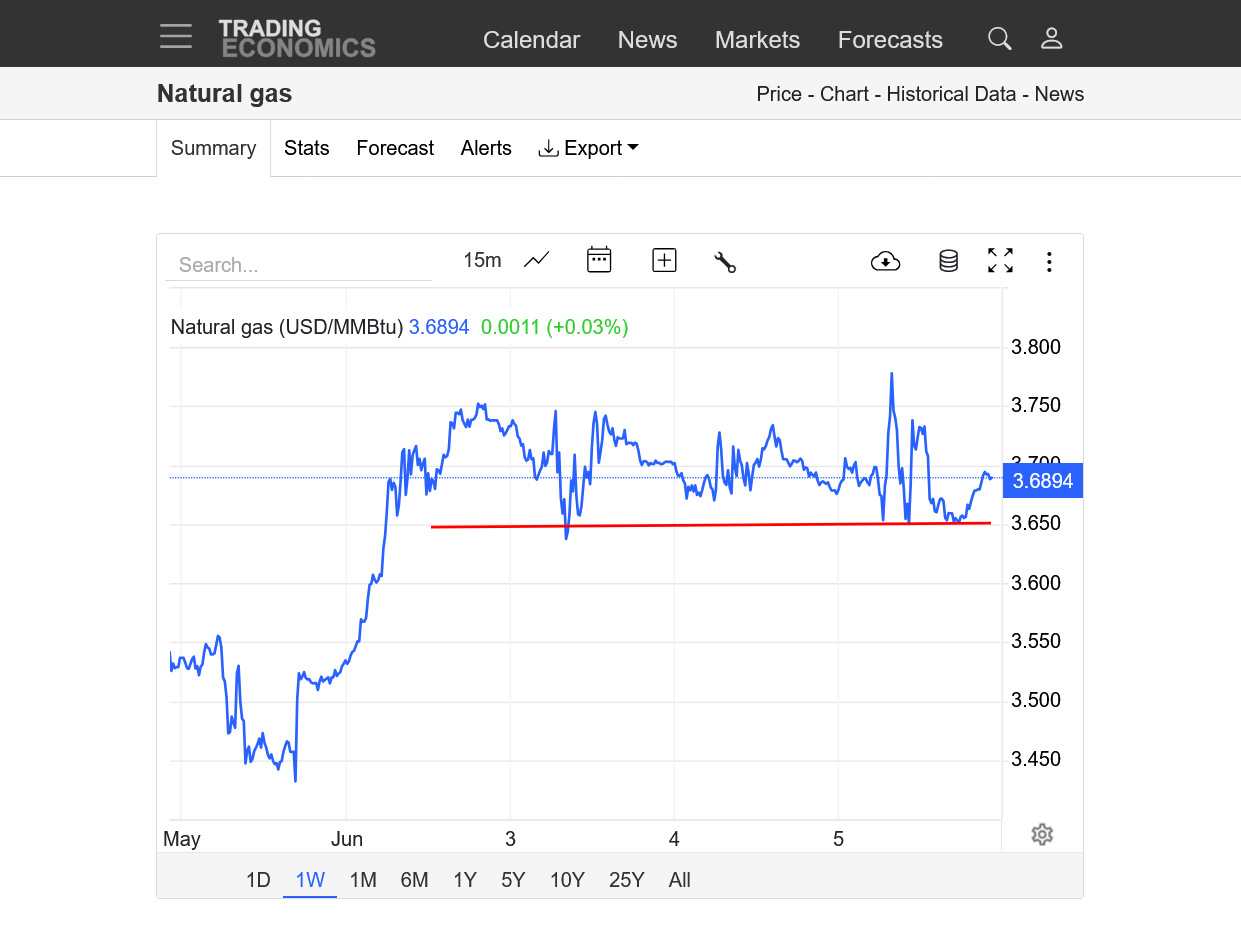
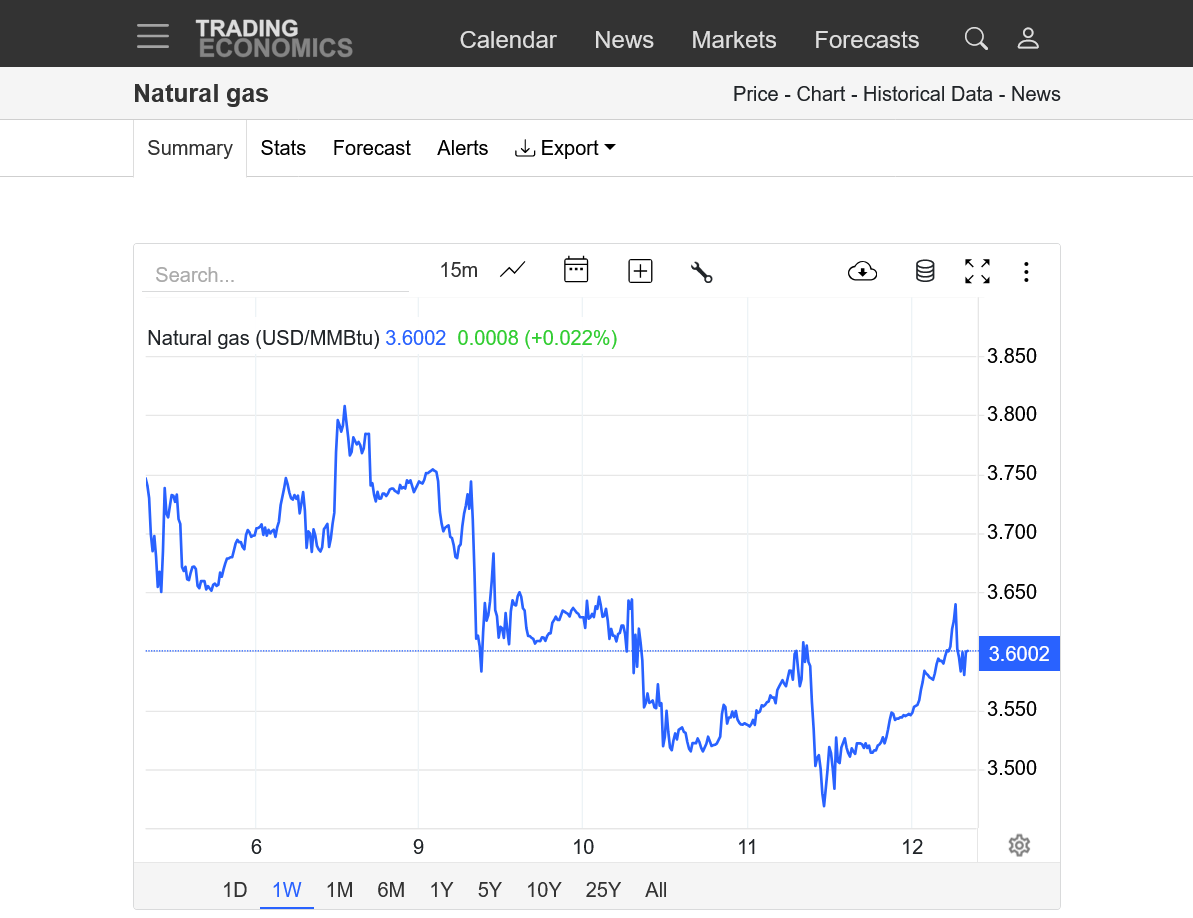
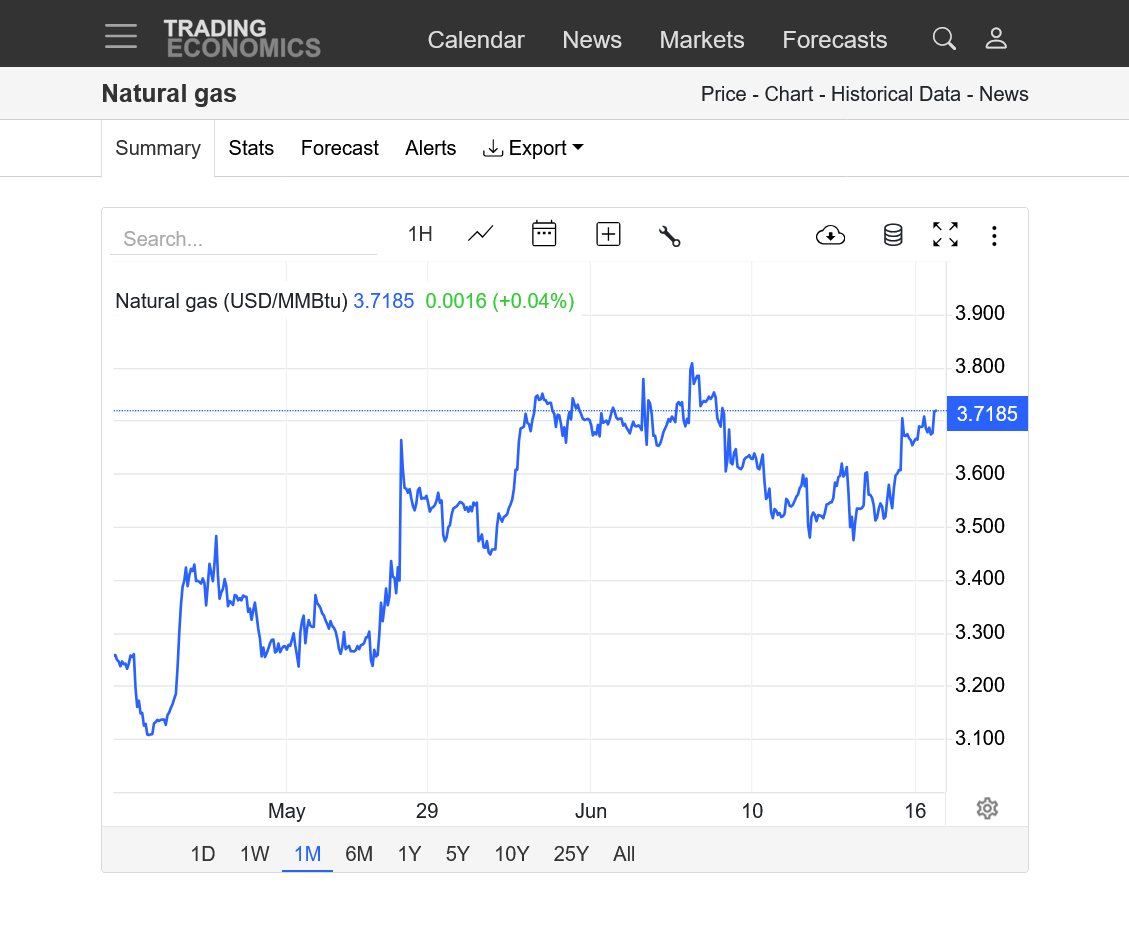
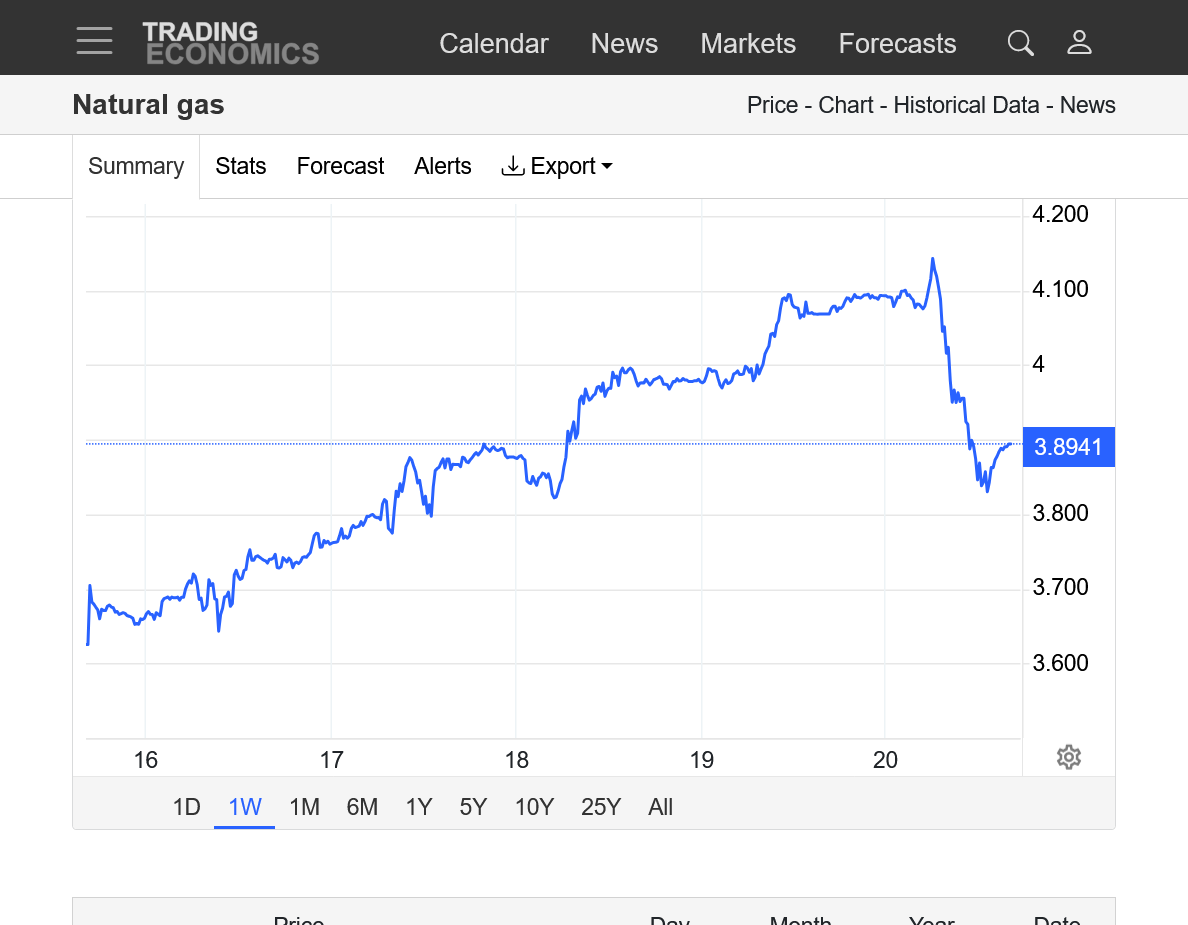
1. 1 week. Sharply higher open tonight from the extra heat in the forecast. The previous front month, June expired last week and the spike up was from the new front month being July that was trading $2,500/contract higher. So the prices previous to that were JUNE contract prices. We could be on the verge of an upside break out from a little bull flag.
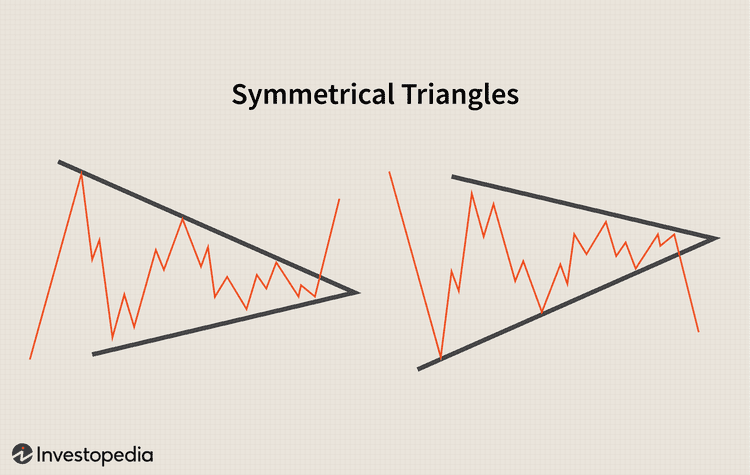
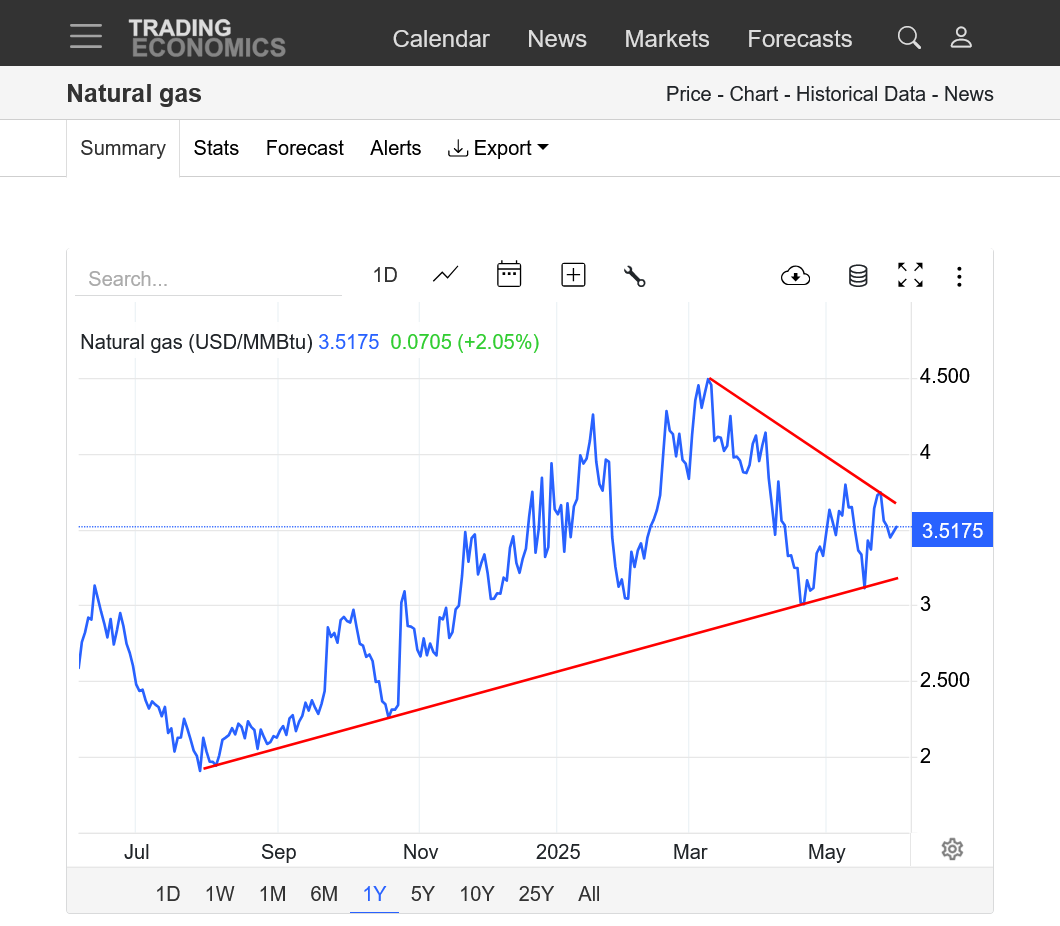
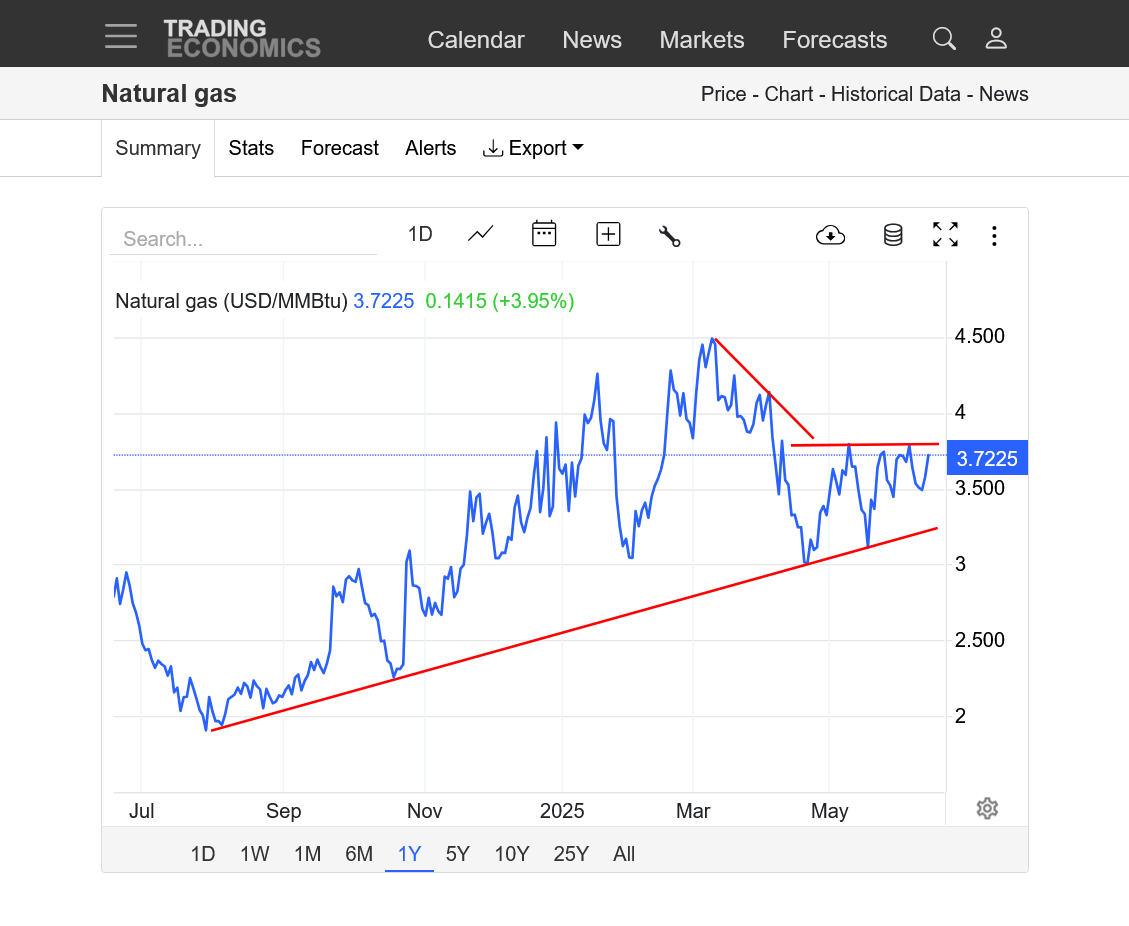
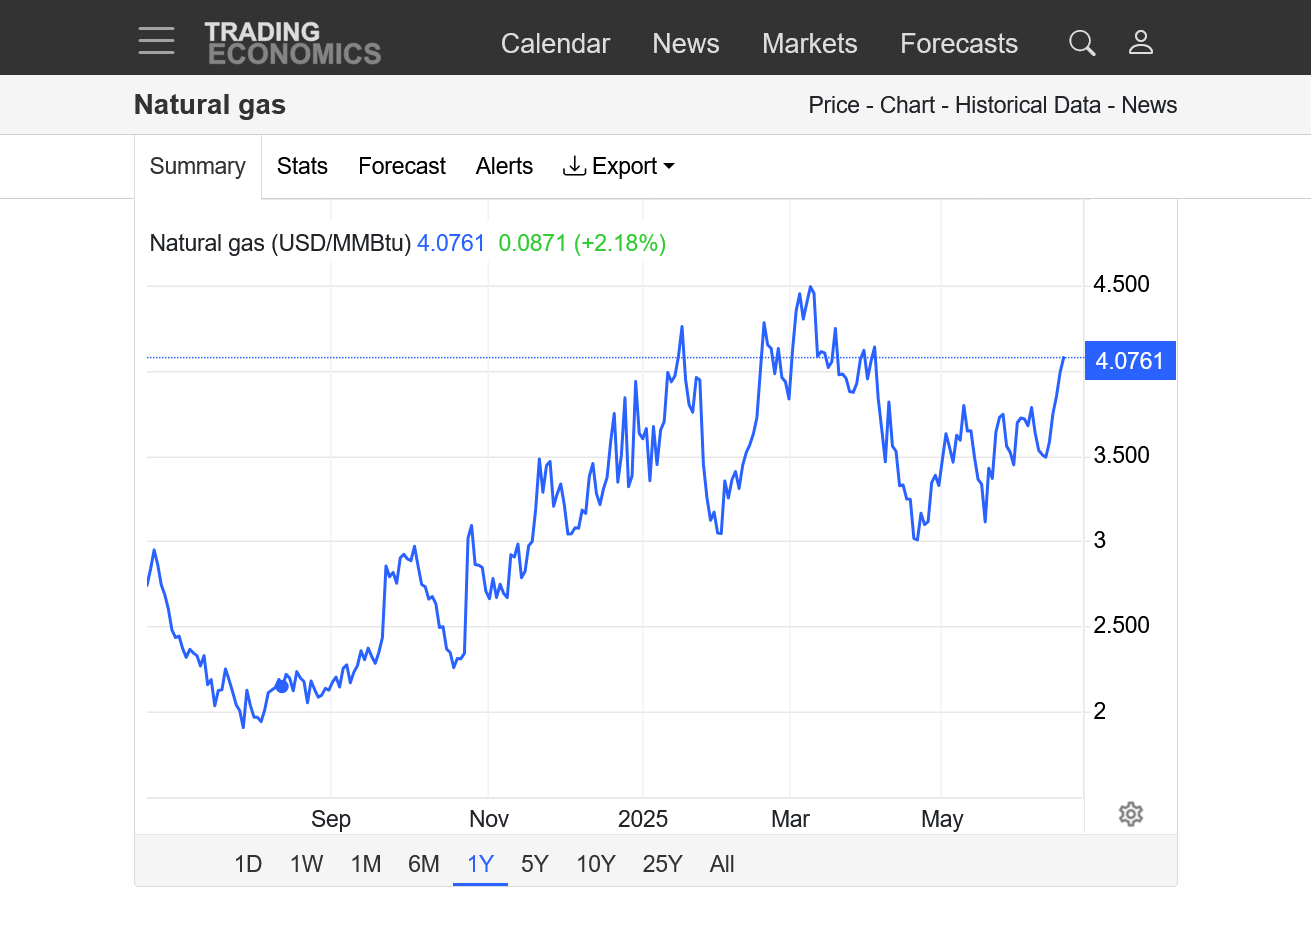
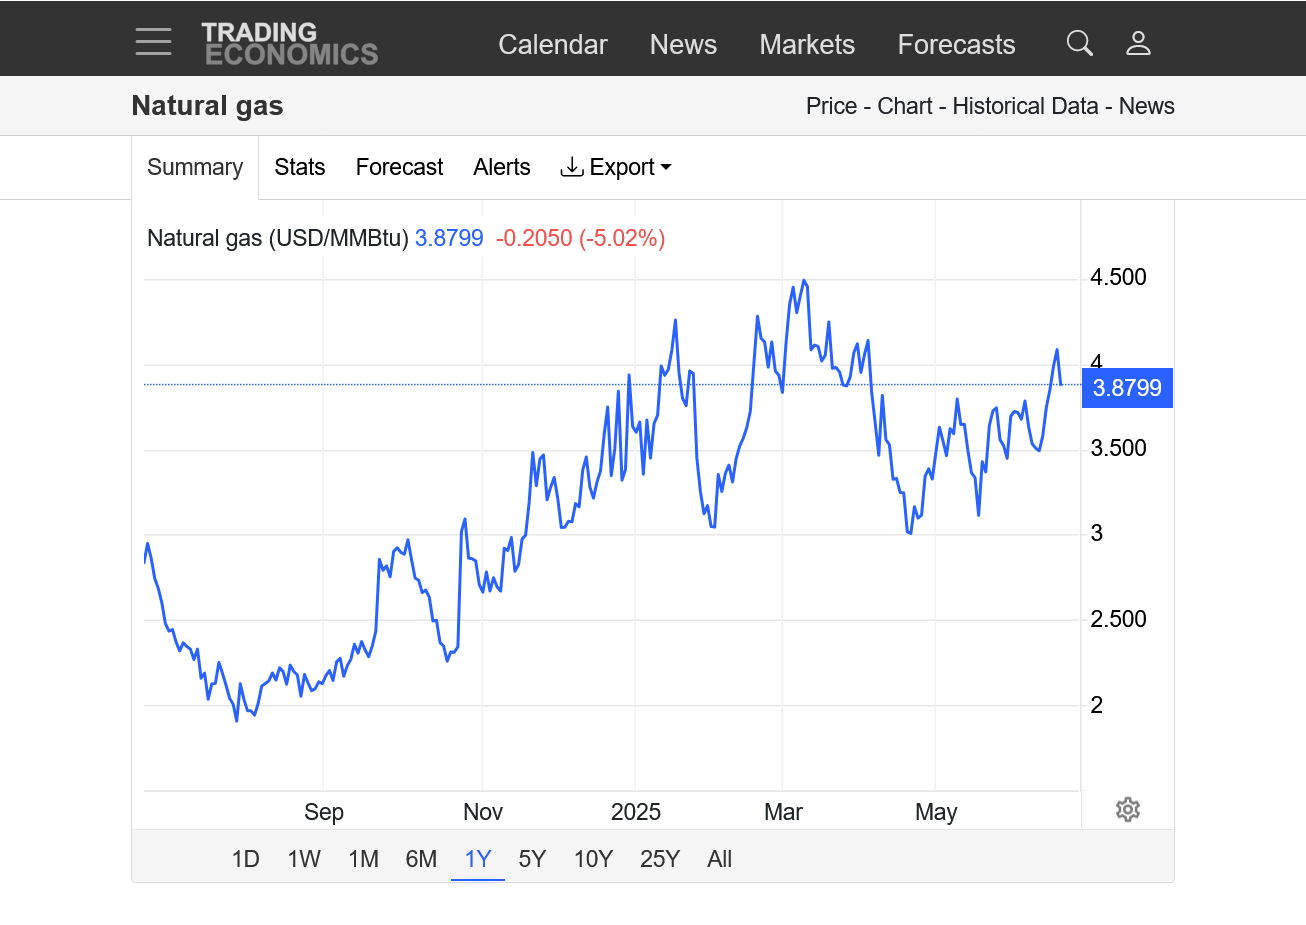
2. 1 year-symmetrical triangle with higher lows and lower highs. My guess is an upside breakout from the heat.
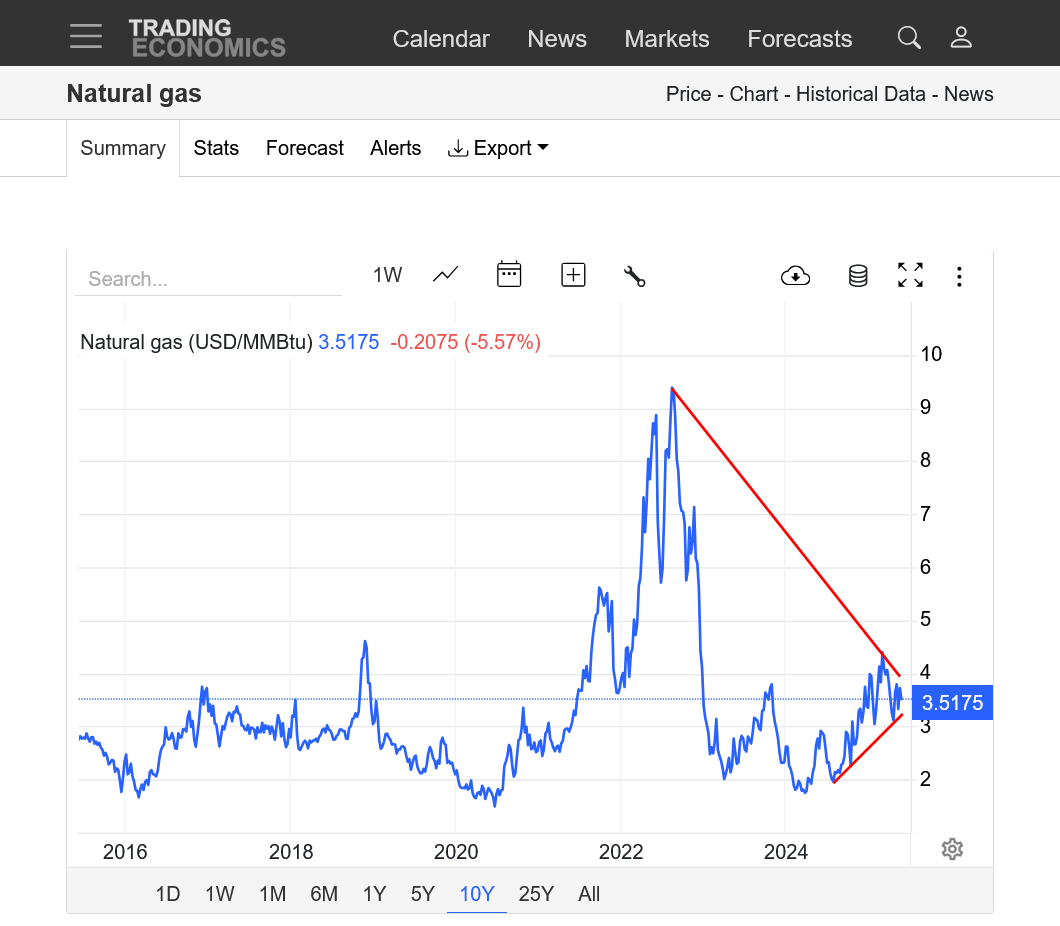
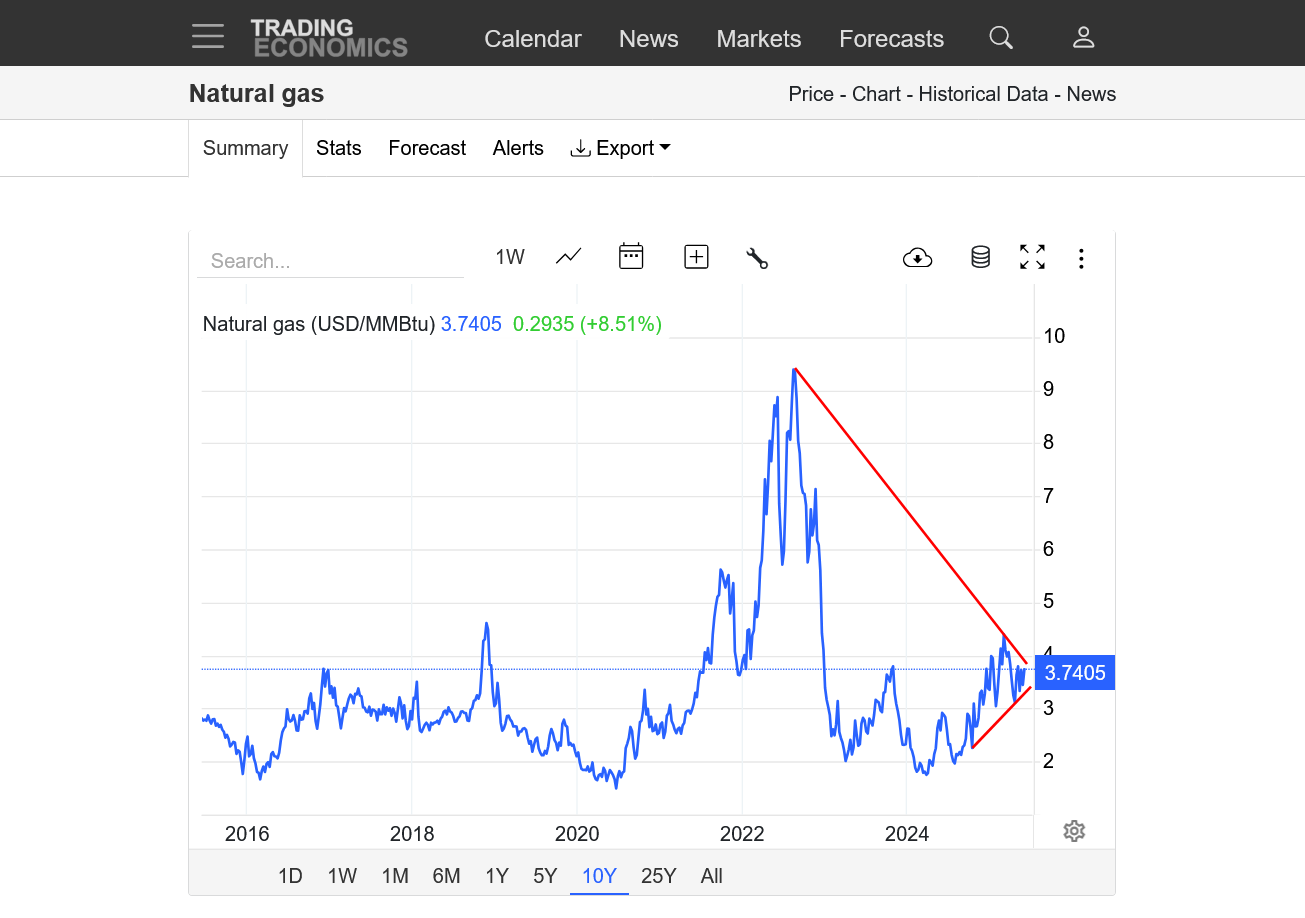
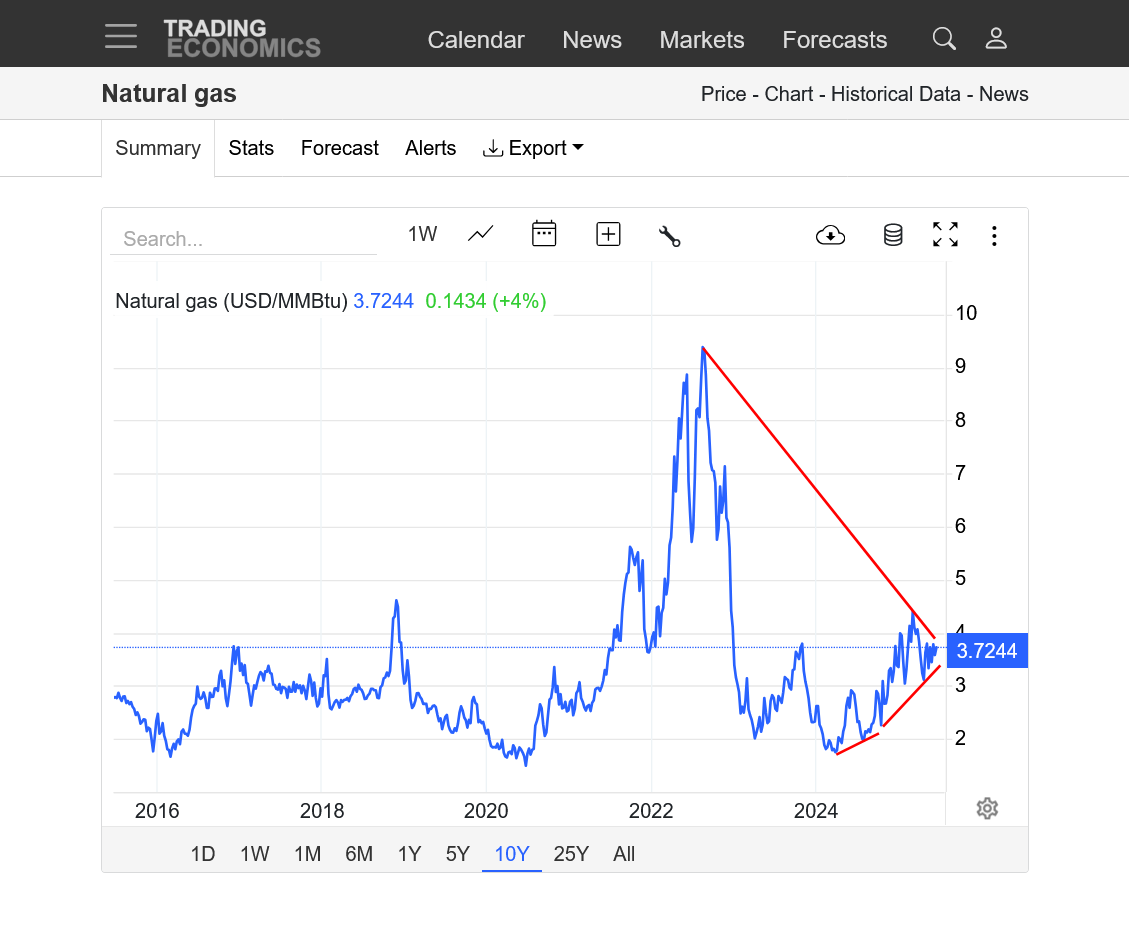
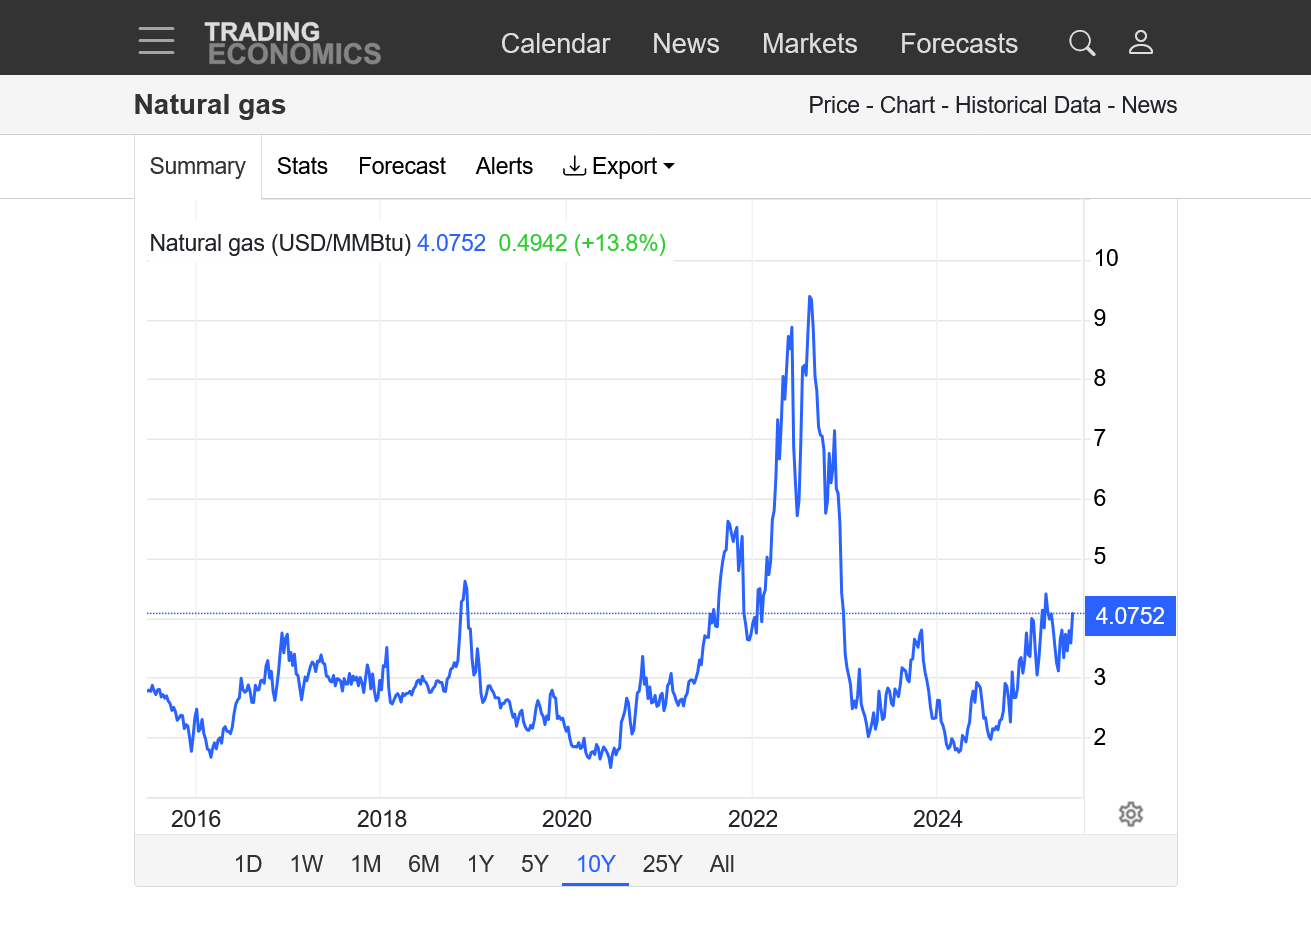
3. 10 years-symmetrical triangle on a longer scale. Huge supply/storage increase this Spring, if it continued would suggest a downside break out. But Summer heat can change that.
The EIA this Thursday at 9:30 am will show a very robust storage increase.
Near record cool temps over the northeastern 1/2 of the of the country and near 0 AC use. Much of the AC in this country comes from electricity generated from burning natural gas.
The market likely dialed that in already and sharply lower prices on Friday were likely part of that.
https://www.cpc.ncep.noaa.gov/products/tanal/temp_analyses.php
The last 0z Euro Ensemble was +3.5 CDDs so NG spiked much higher immediately and got to +2,000/contract from the open!
i bought the open and the low but unfortunately got stopped out early in the evening with a tiny profit from having a stop too tight
This was the last map of the 0z EE model that shows the huge heat dome overspreading much of the country all the way up to the southern Great Lakes.
.
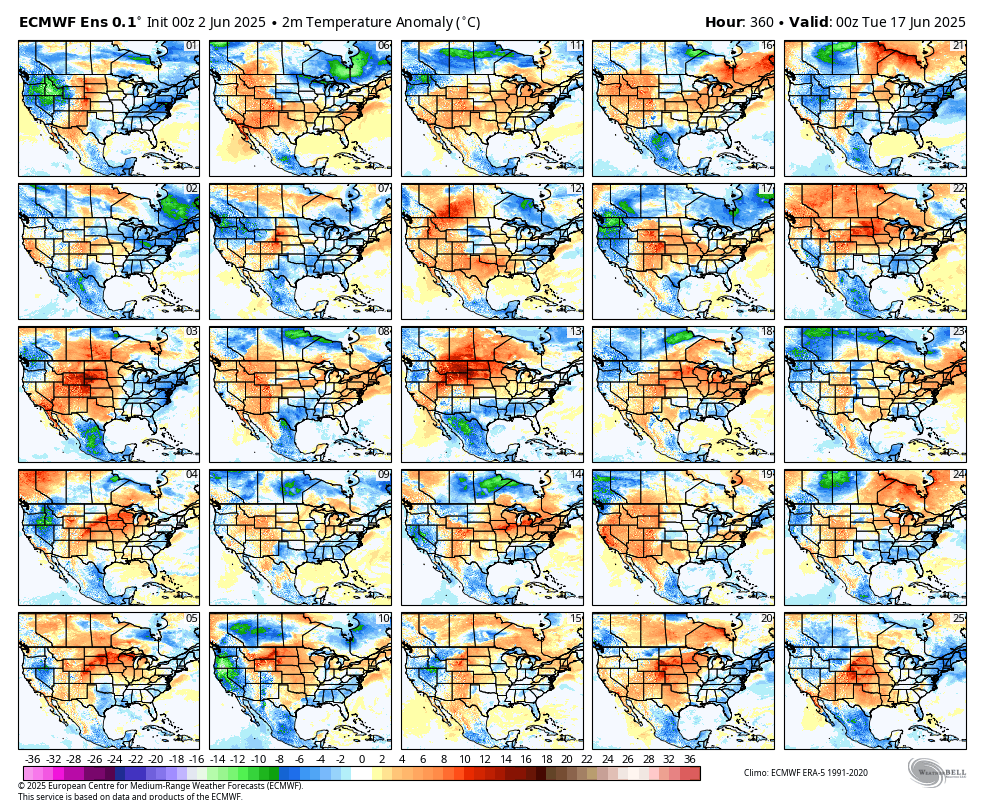
What's interesting is that the individual ensemble members are not in very good agreement on what the means for temperatures: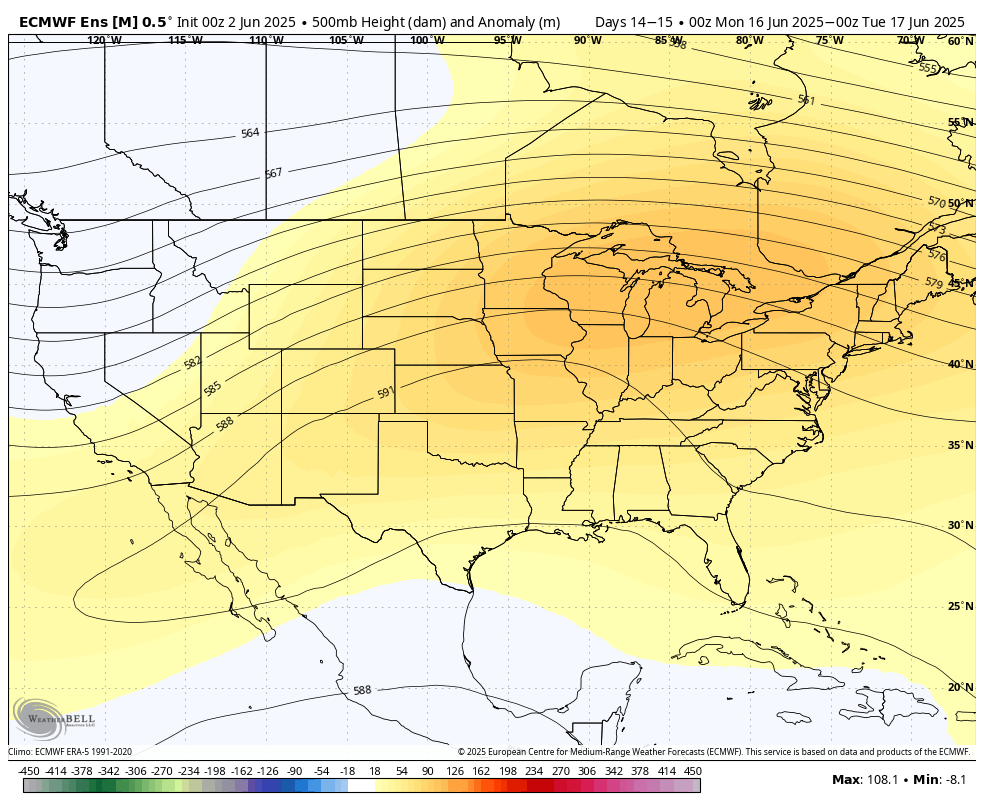
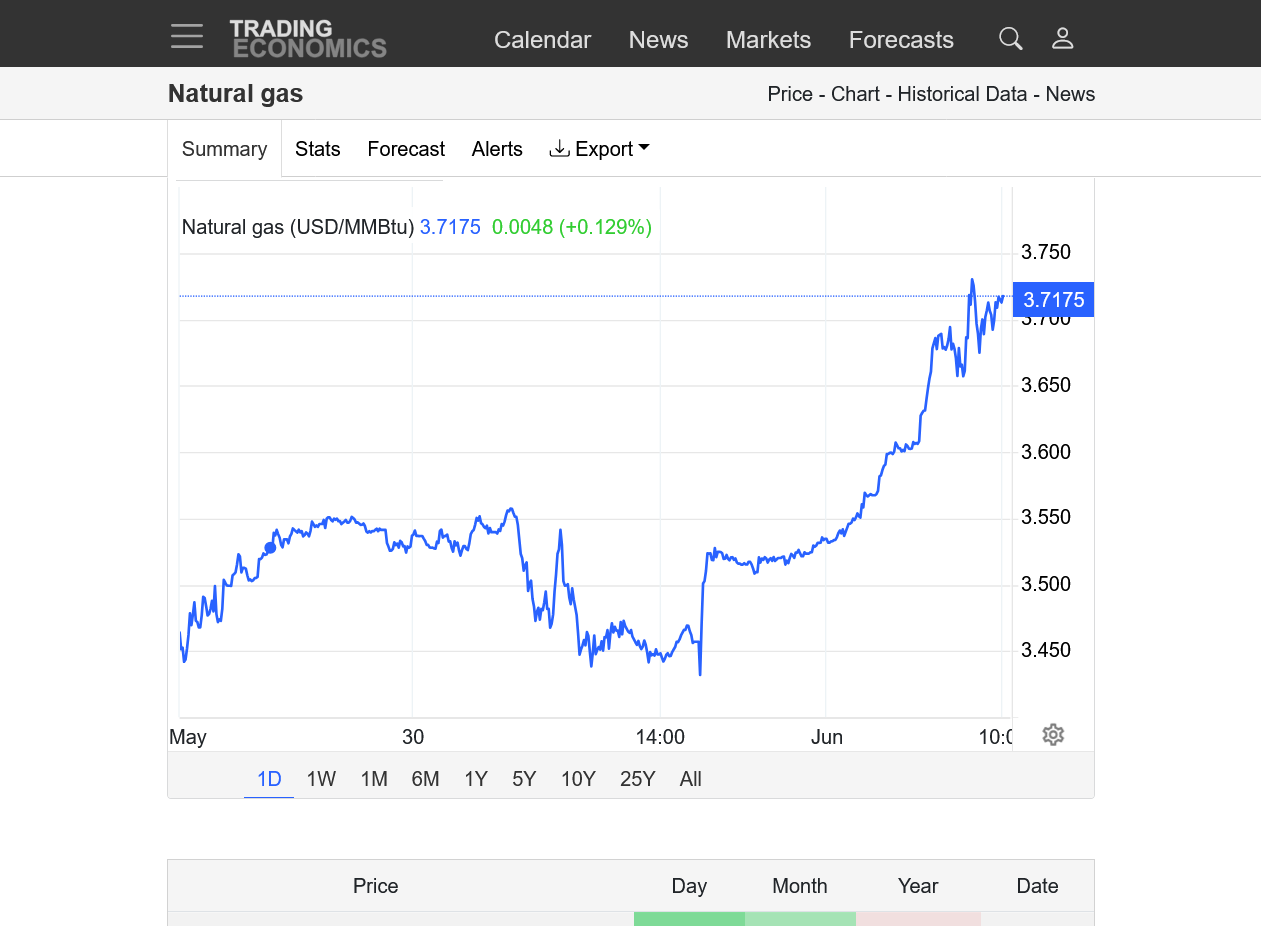
The last day of prices below. The open last night was 3501. We are up over $2,000/contract since then.
https://tradingeconomics.com/commodity/natural-gas
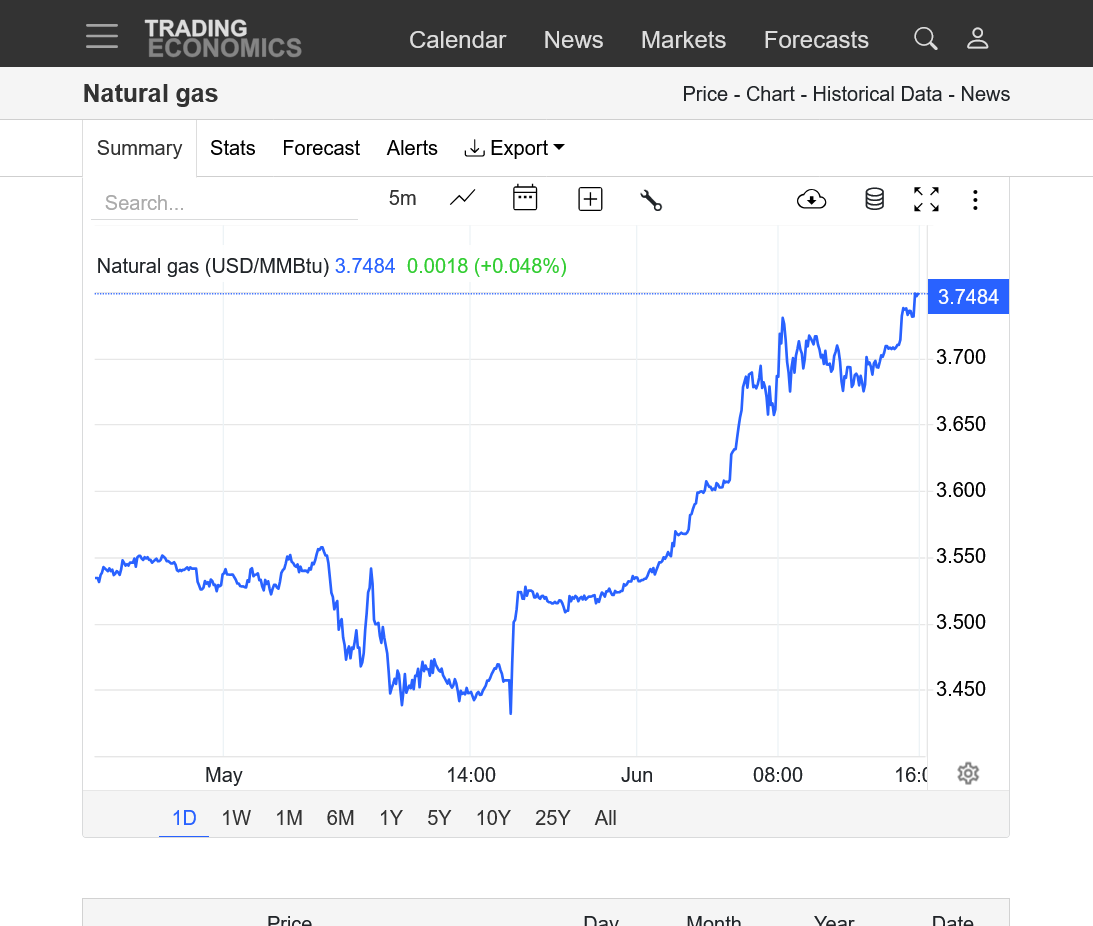
Incredible 1 day surge in natural gas today!
https://tradingeconomics.com/commodity/natural-gas
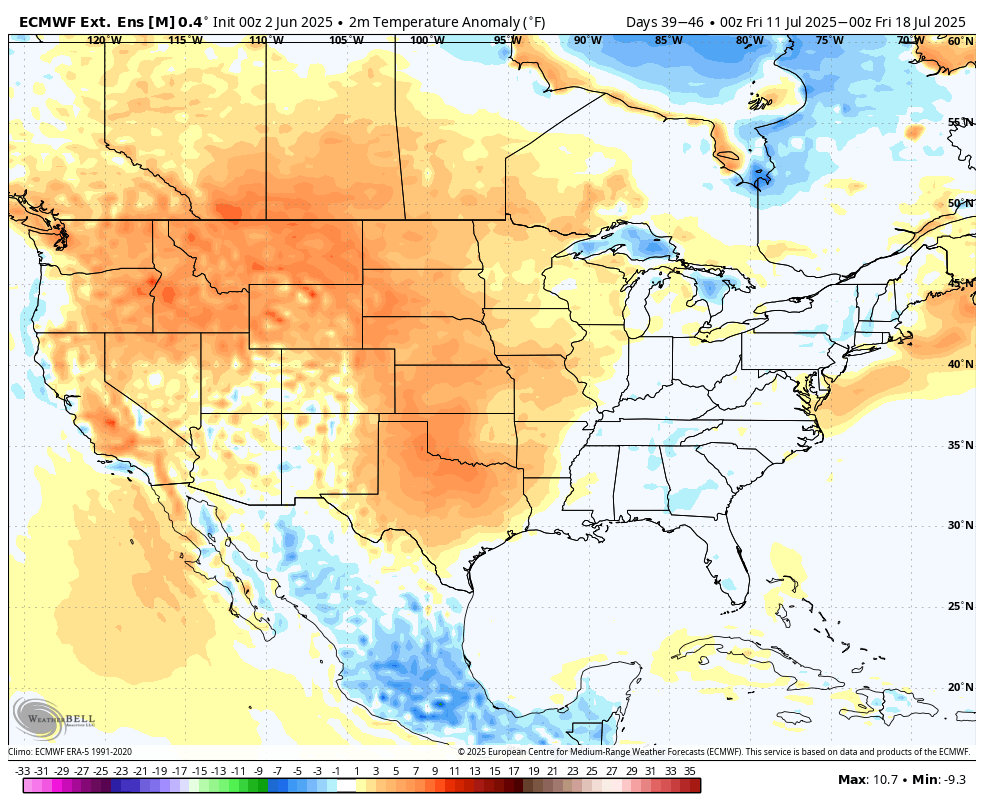
The last 46 day European Ensemble model came out slightly hotter too this afternoon:
This was the 850 mb temperature anomaly for the last map on July 18th.
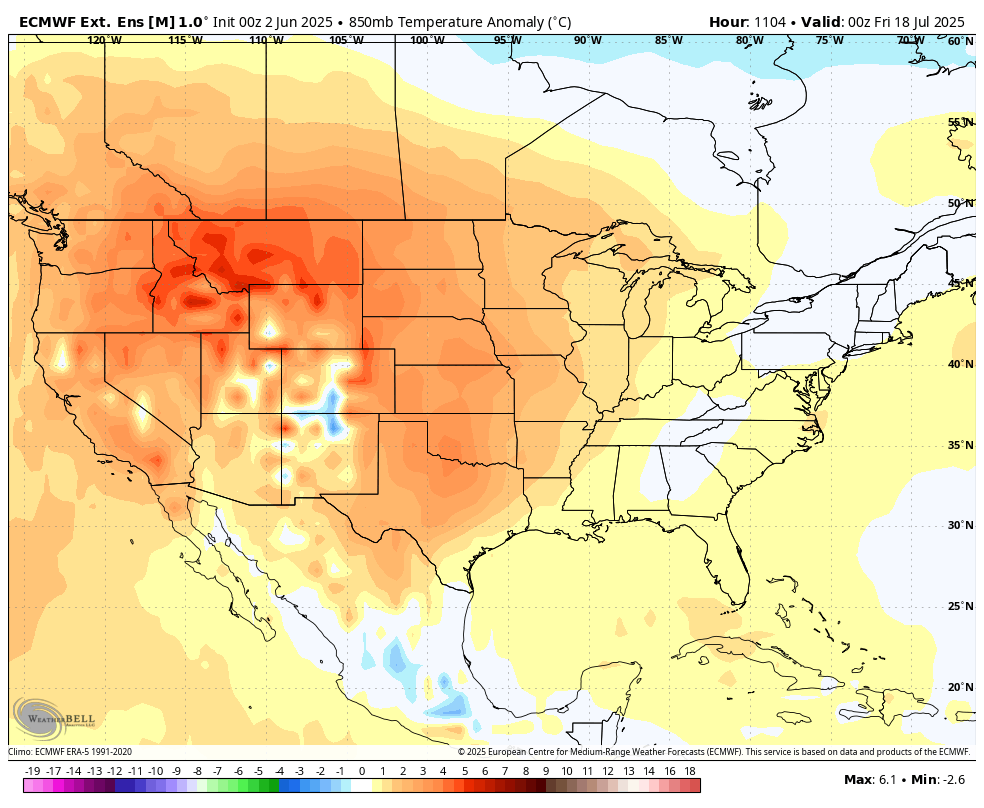
7 day temps for the week leading up to that. This will very likely be widespread 100 degree heat because these anomalies are happening in the hottest time of year.
The powerful upper level heat dome will be centered far enough southwest for some perturbations to track around the periphery of the dome, then turn southward in northwest flow across the Midwest. However, the Plains and WCB will have very high drying rates and below normal rains there would spell rapidly drying soils and drought expanding again.
Here comes the heat.
This is what spiked the price of ng on Monday by $3,000/contract!
This map will update by mid afternoon every day.
https://www.marketforum.com/forum/topic/83844/#83852
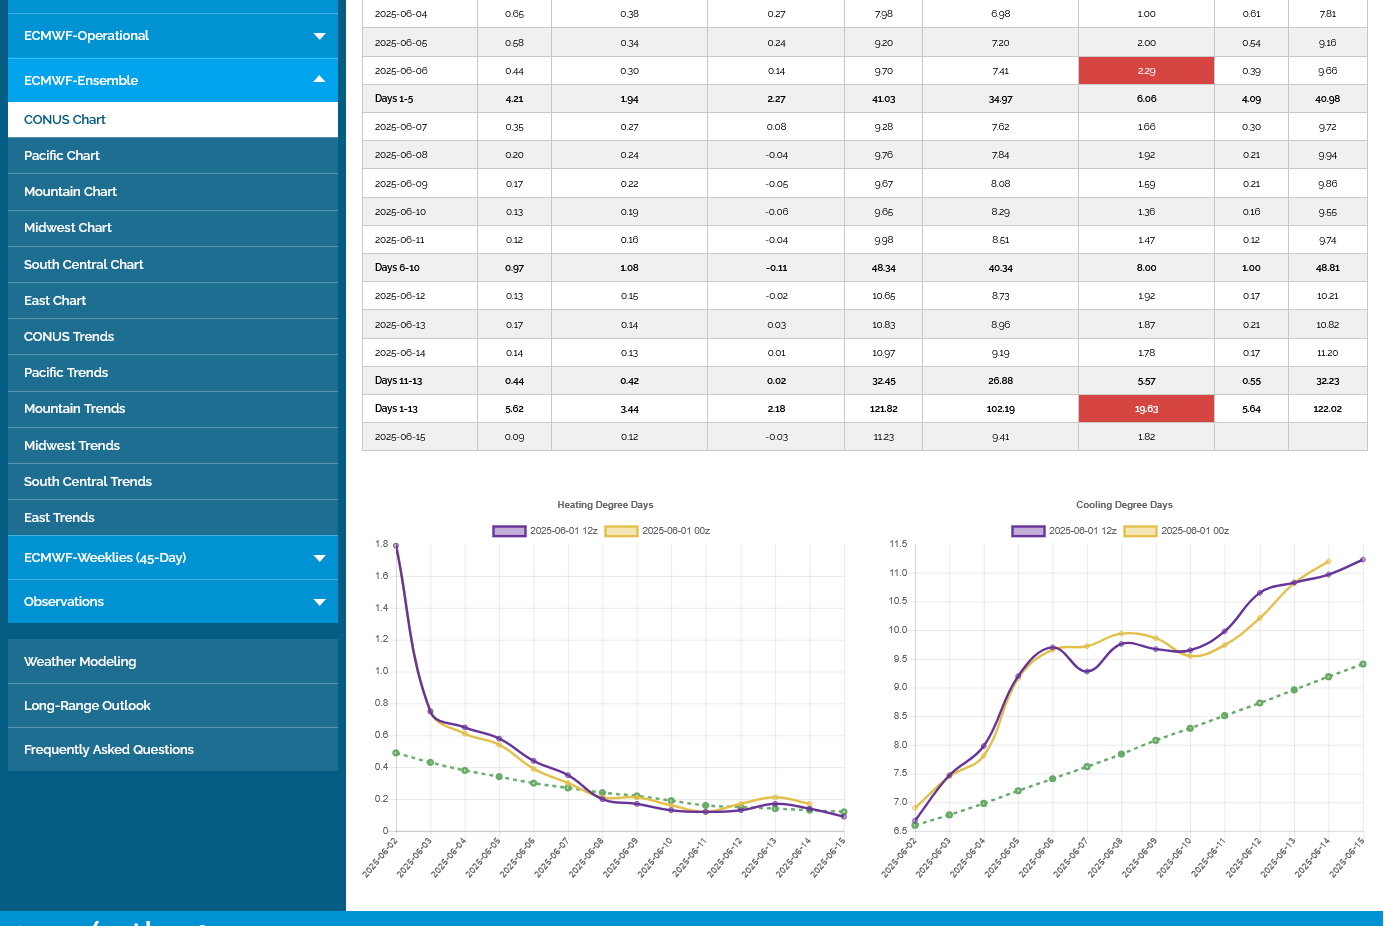
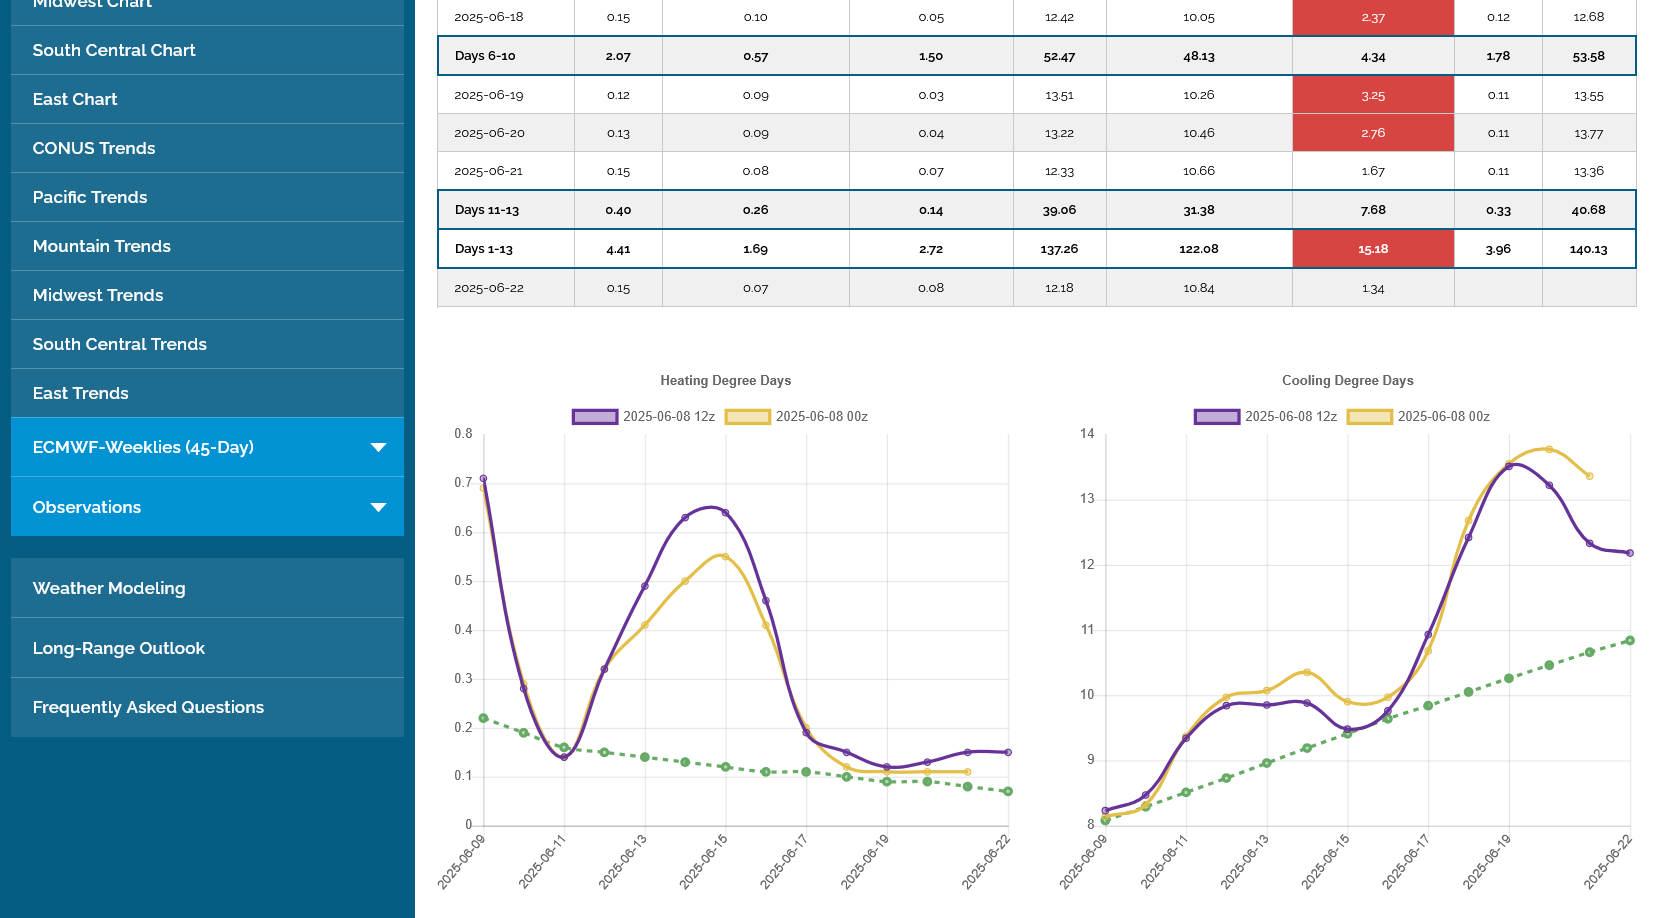
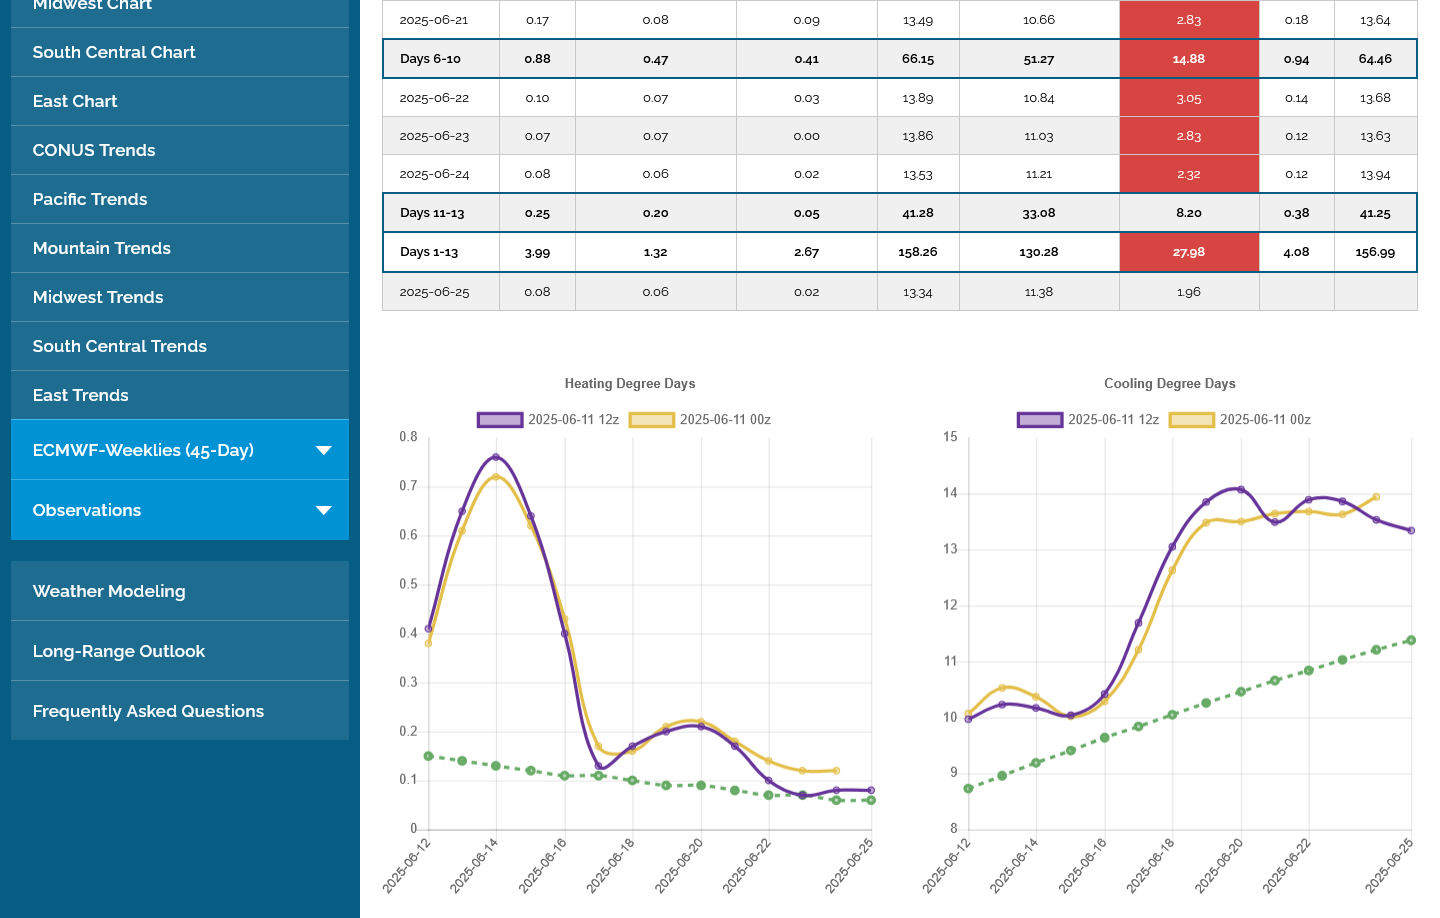
Here's the last 12z European Ensembles model. CDDs are on the right. Purple was the 12z run. Tan was the previous 0z run. Dashed green line is the climatological average.
Heating up in week 2. EIA out tomorrow morning should be a large/bearish number but the market traded that weather last month when it was in the forecast.
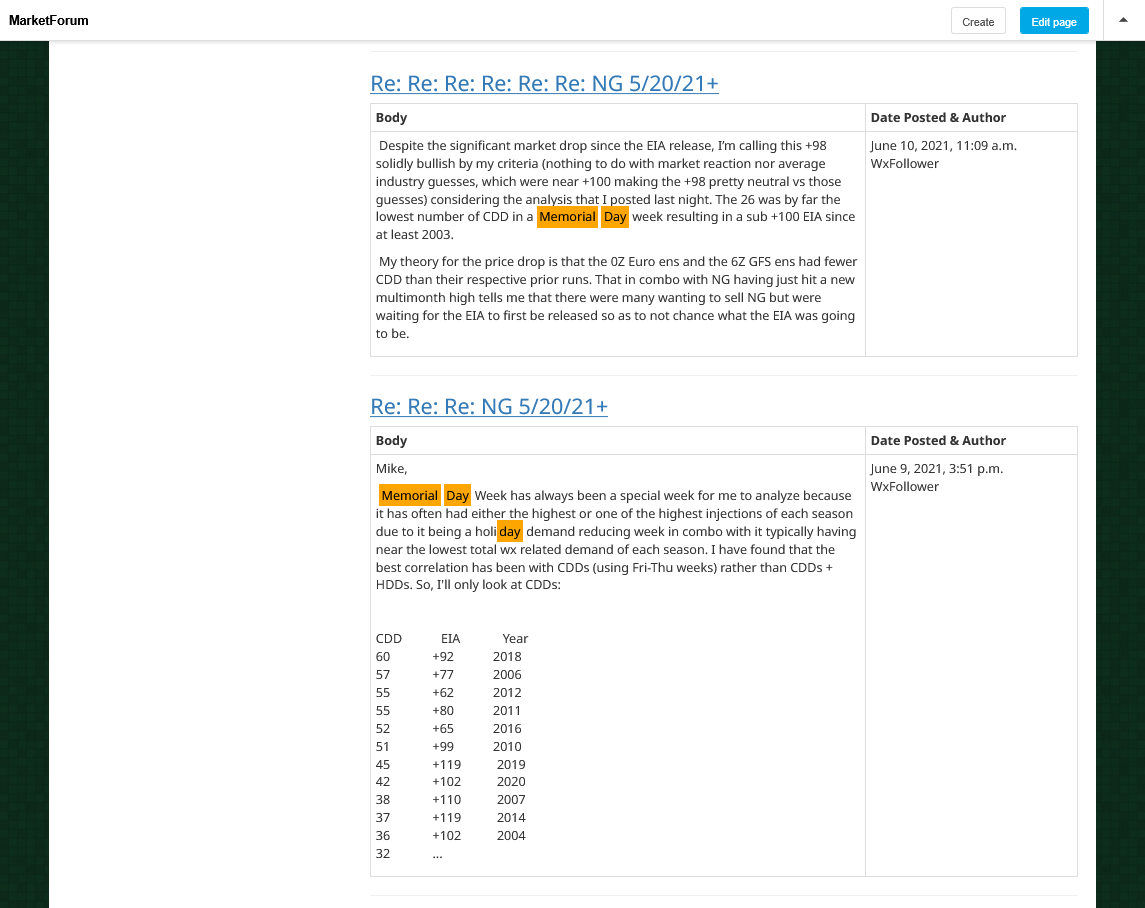
+122 Bcf. Holy Cow! That's 7 weeks in a row with higher than the historical average for injections.
That has to easily be a record for the month of June, thanks to the near record cool weather. It was a holiday week of course/Memorial Day which lowers industrial demand a bit.
This WILL BE coming to an end later this month after another robust injection next Thursday. The market has been trading that this week/the reason for the big gains but this was a short term shock-a-roo! If the models keep the heat or add some, we will likely be able to overcome it.
Note the blue line below for current storage continuing to climb vs the 5 year average(we're above that) and the 5 year range.
https://ir.eia.gov/ngs/ngs.html
for week ending May 30, 2025 | Released: June 5, 2025 at 10:30 a.m. | Next Release: June 12, 2025
| Working gas in underground storage, Lower 48 states Summary text CSV JSN | |||||||||||||||||||||||||
|---|---|---|---|---|---|---|---|---|---|---|---|---|---|---|---|---|---|---|---|---|---|---|---|---|---|
| Historical Comparisons | |||||||||||||||||||||||||
| Stocks billion cubic feet (Bcf) | Year ago (05/30/24) | 5-year average (2020-24) | |||||||||||||||||||||||
| Region | 05/30/25 | 05/23/25 | net change | implied flow | Bcf | % change | Bcf | % change | |||||||||||||||||
| East | 498 | 462 | 36 | 36 | 570 | -12.6 | 486 | 2.5 | |||||||||||||||||
| Midwest | 579 | 541 | 38 | 38 | 684 | -15.4 | 576 | 0.5 | |||||||||||||||||
| Mountain | 205 | 198 | 7 | 7 | 217 | -5.5 | 152 | 34.9 | |||||||||||||||||
| Pacific | 261 | 254 | 7 | 7 | 272 | -4.0 | 236 | 10.6 | |||||||||||||||||
| South Central | 1,055 | 1,021 | 34 | 34 | 1,144 | -7.8 | 1,031 | 2.3 | |||||||||||||||||
| Salt | 340 | 328 | 12 | 12 | 329 | 3.3 | 309 | 10.0 | |||||||||||||||||
| Nonsalt | 715 | 693 | 22 | 22 | 815 | -12.3 | 722 | -1.0 | |||||||||||||||||
| Total | 2,598 | 2,476 | 122 | 122 | 2,886 | -10.0 | 2,481 | 4.7 | |||||||||||||||||
| Totals may not equal sum of components because of independent rounding. | |||||||||||||||||||||||||
Working gas in storage was 2,598 Bcf as of Friday, May 30, 2025, according to EIA estimates. This represents a net increase of 122 Bcf from the previous week. Stocks were 288 Bcf less than last year at this time and 117 Bcf above the five-year average of 2,481 Bcf. At 2,598 Bcf, total working gas is within the five-year historical range.
For information on sampling error in this report, see Estimated Measures of Sampling Variability table below.
Note: The shaded area indicates the range between the historical minimum and maximum values for the weekly series from 2020 through 2024. The dashed vertical lines indicate current and year-ago weekly periods.
Trading got very wild just before 7am this morning. Spiking to a new low for the session, then really spiking higher to a new high for the move and +1,200 in just an hour without much NEW news. (actually, it looks like the end of the 6z GEFS model being hotter might be the reason for the spike higher)
Imagine trying to trade this?
I don't have to imagine it, being active trading natural gas this week for the first time in awhile. It's been very challenging but at least I haven't lost any money on any trades........yet.
Then the spike to NEW lows for the session after the massive, 122 Bcf injection, with a bit of a recovering. The heat is still coming in week 2 and beyond with CDDs just a tad lower vs yesterday.
https://tradingeconomics.com/commodity/natural-gas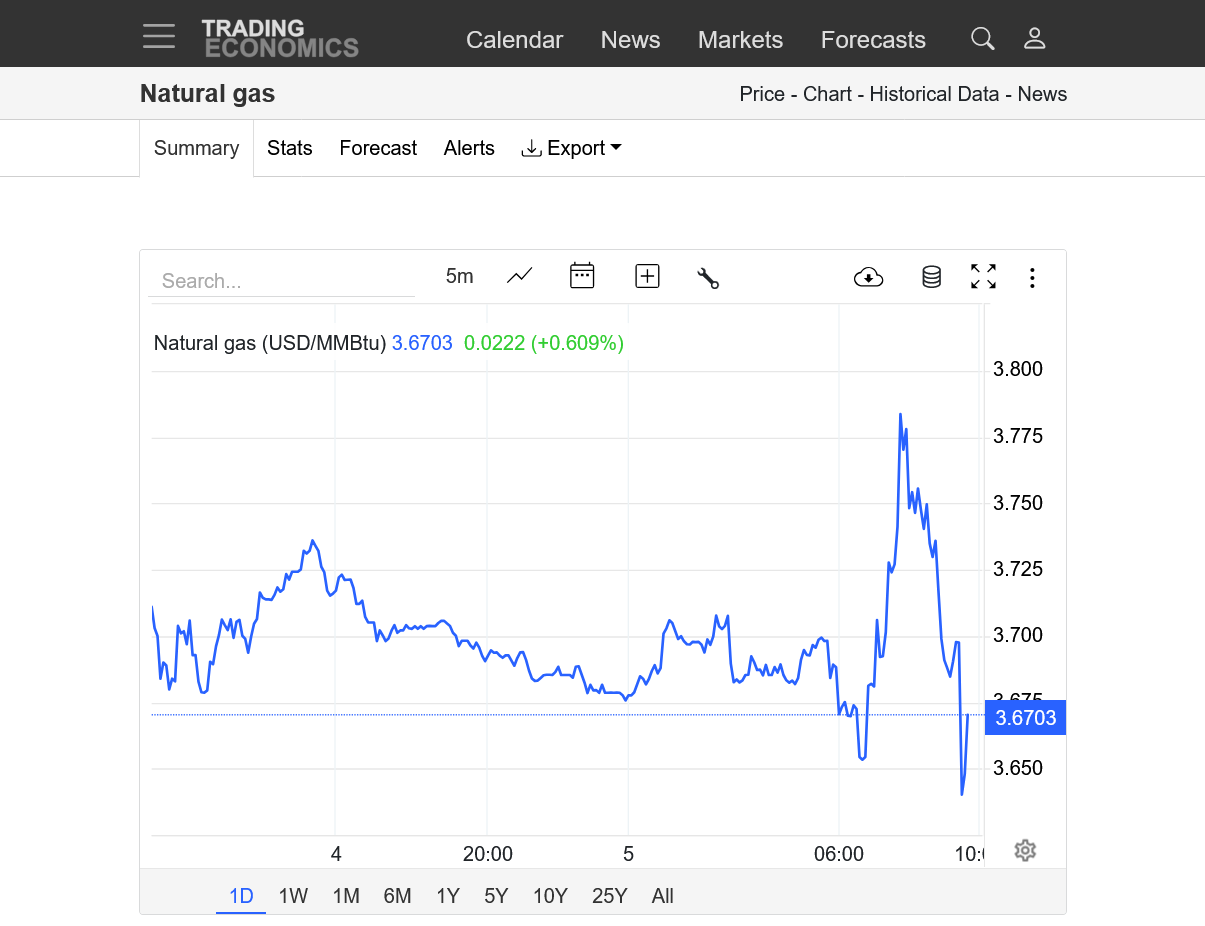 +++++++++++
10:54 am update: We've completely recovered from the EIA spike lower!
NG sold off during the afternoon session, despite the 12z European model being a bit more bullish with +2.3 CDDs vs the previous 0z run as seen below on the right in purple.
This supportive/bullish change in the weather forecast was trumped by the bearish shocker +122 Bcf injection. Without that, NG would have likely traded HIGHER during the afternoon
Extremely volatile trading today!
https://tradingeconomics.com/commodity/natural-gas
1. 1 day/24 hours
2. 1 week-solid support at 3650!
3. Weather models overnight will play a big role in determining price direction and magnitude of changes.
This is the first 5 days of the next EIA report. Certainly not nearly as bearish as this last one but still a robust injection for June.
Even the report that comes out on 6-19-25, 2 weeks from today will be large for the time of year.
Starting on 6-26-26, 3 weeks from today we will start having more bullish injections that continue well into July.
Mike said: “+122 Bcf. Holy Cow! That's 7 weeks in a row with higher than the historical average for injections.
That has to easily be a record for the month of June, thanks to the near record cool weather. It was a holiday week of course/Memorial Day which lowers industrial demand a bit.
——————-
Hey Mike,
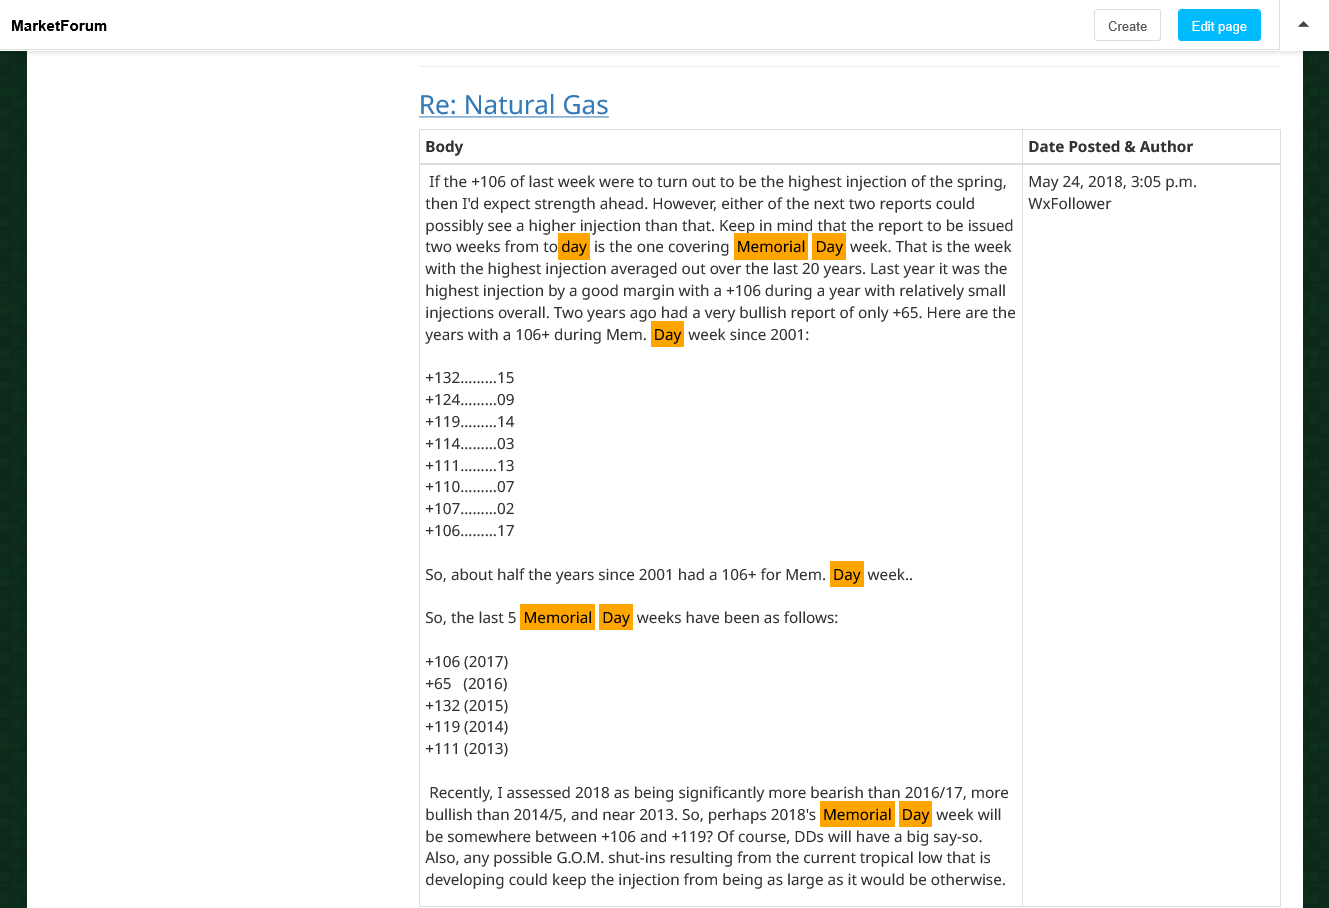
1. Until recently, I posted an annual detailed screed about the history of Memorial Day week NG injections because that week by a good margin averaged the largest injection of the year.
2. That’s because of the combo of the holiday and associated vacations during at or near the lowest total HDD/CDD related demand of the year.
3. I used to have all of the most up to date Memorial Day week DD and storage changes at my fingertips, which allowed me to post tables to analyze.
4. This really wasn’t a June injection as the end of the reporting period is the AM of Fri May 30th. For May, it isn’t a record due to other very high Memorial Day week injections.
5. Due to many NG industry folks every year not taking into account enough of a demand slowdown due to the holiday week and thus projecting too low of an injection, the injection guess average is usually too low.
6. I see that the NGI guess range was +95 to +126. The Reuters median guess was +111. The NGI model had +110.
7. The kneejerk reaction to the EIA report was a drop of 5 cents per NGI.
Thanks very much, Larry!
I remember those posts extremely well. Thanks for your analysis. Yes, I'm aware that this EIA report was for May days, even though it came out in the first week of June but good point for others.
I'll try to retrieve one of your past posts on this.
I'm unable to generate a link to this from our mediocre search engine but was able to take a screenshot. Great stuff, Larry! Did you ever think we would be looking at it 7 years later?????
From 2018:
+++++++++++++++
From 2021:
+++++++
From 2022:
0z European model CDDs on the right/purple were ~+1 vs the previous 12z run so we had a spike higher in prices earlier this morning but have backed down.
Models turned a bit cooler today which has ng opening modestly lower:
The last 12z European Ensemble model was almost -3 CDDs. Purple on the right:
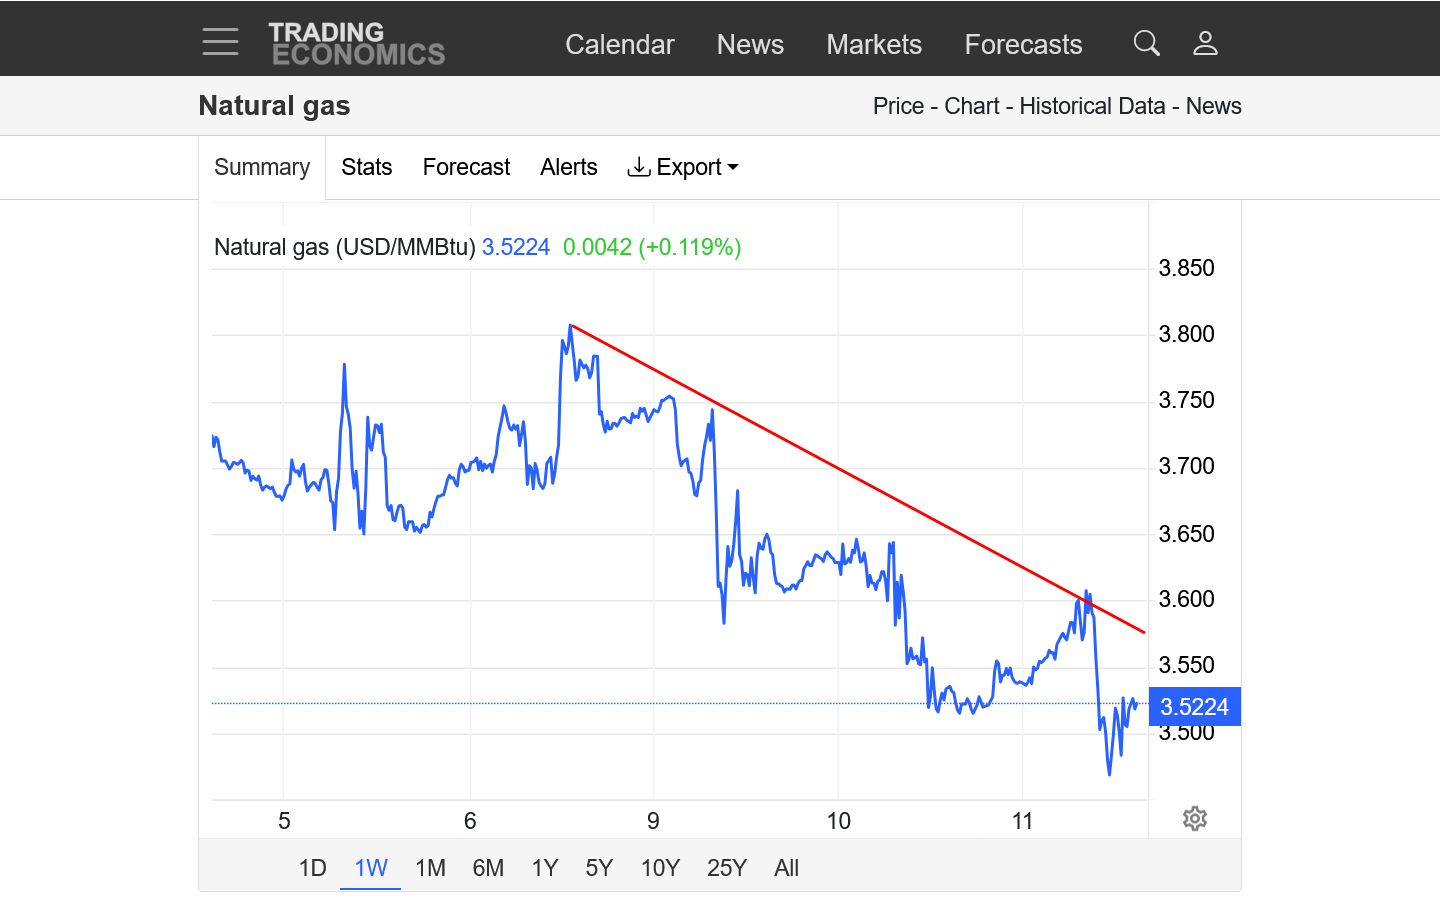
https://tradingeconomics.com/commodity/natural-gas
1. 1 week. Lower start tonight from less heat but the market spiked lower and is ABOVE the open because the heat is still coming. (6pm-now its a bit lower than the open-weather updates overnight will play the biggest role in price direction).
2. 10 years. This is a continuation chart. Symmetrical wedge. See below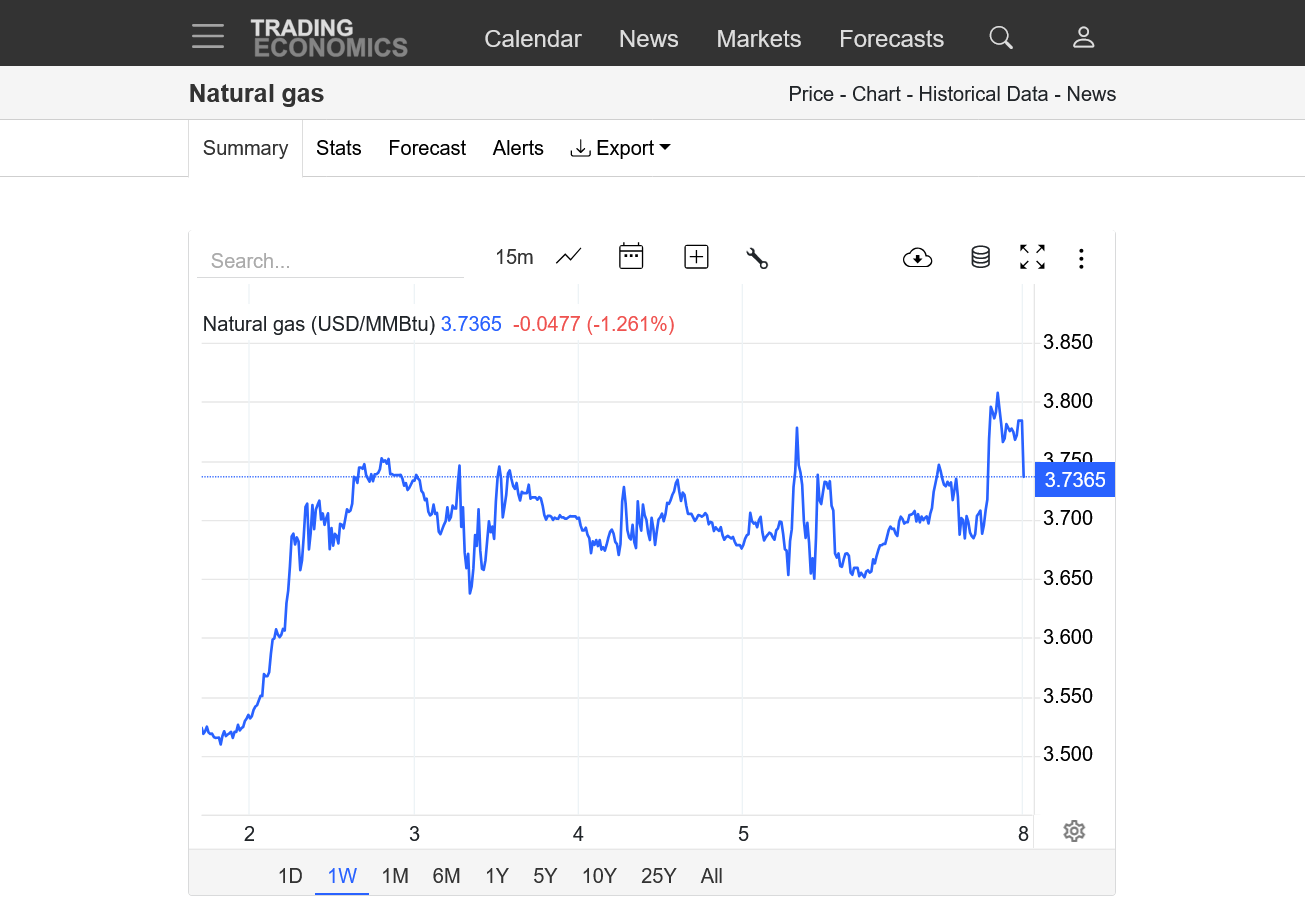
https://itez.com/en/blog/education/lower-highs-higher-lows-trading-guide
Both the last EE and GEFS had LESS heat and natural gas prices immediately spiked lower after they came out. We are -1,500/contract right now. This was the last 0z EE below:

https://naturalgasintel.com/news/natural-gas-futures-lower-as-output-jumps-lng-exports-limp-along/
+++++++++++++++++++
There in no way that this guy actually trades natural gas. He has no clue! He is being paid to write a story to give reasons for why ng is down sharply and is obviously not following the latest weather guidance(and doesn't have contacts that trade weather to tell him).
Let me demonstrate this below:
1. The 1st red line up is after the 18z and 0z GEFS came out HOTTER.
1. The 2nd red line DOWN was the reaction to the market when the less hot EE came out.
2. The 3rd red line DOWN is after the 6z GEFS came out COOLER.
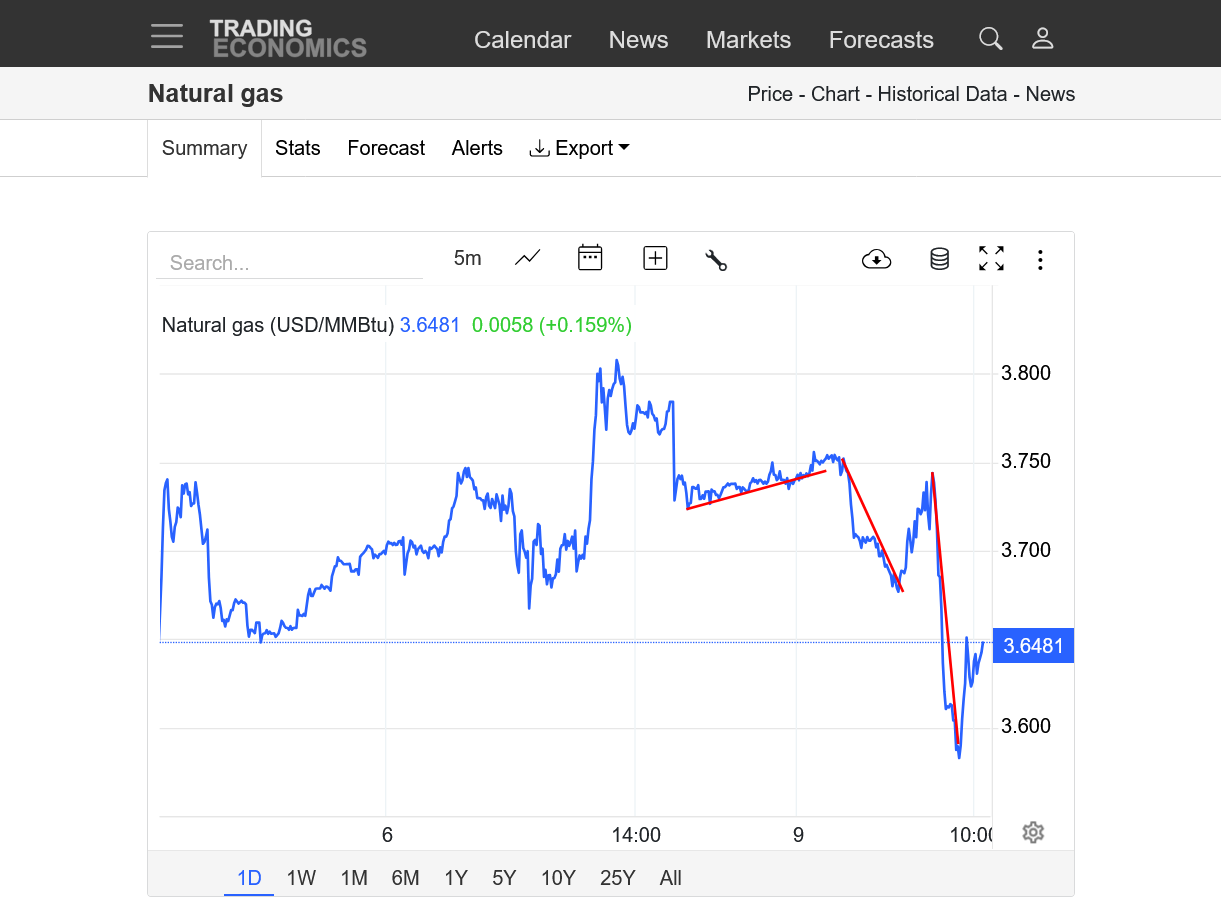
Here are the CDDs from the last 4 runs of the GEFS (below) to show this:
1. 12z run: Blue=152.57
2. 18z run: Red=159.97=+7.40 CDDs HOTTER=market moved slightly higher-red line 1 above
3.a: 0z run: Tan=162.09=+2.12 CDDs HOTTER=market continued slightly higher-red line 1 above
3.b: 0z run of EE (ABOVE) =-.5 CDDS COOLER=market made new lows but came back before the next GEFS was released-red line 2 above. See a more detailed explanation here thanks to WxFollower's comment: https://www.marketforum.com/forum/topic/112055/#112433
4. 6z run: Purple=157.15=-4.94 CDDs COOLER-market crashed lower as this added to the last EE that was cooler-red line 3 above.
I don't want to give the illusion that it's easy to trade this because its the complete opposite of that:
1. Very often, there is a lag in the reaction. The cooler, 6z GEFS for instance was coming out bearish but the market went up the entire time until it tested the highs from earlier in the session. If you were selling the cooler maps coming out, you were way behind until the test, then you had massive profits...........unless you got stopped out for a loss and had to painfully watch.
2. Sometimes the market will go in the opposite direction compared to what is expected from a weather model temperature change.
3. Sometimes the market will react just BEFORE the weather model changes. I think part of this is from big traders with meteorologists that have their own in house models and forecasting techniques that anticipate what the next model will show BEFORE it comes out.
Mike said: “0z run of EE (ABOVE) =-.5 CDDS COOLER=market made new lows”
——————-
Hey Mike,
We both know that a reduction of a mere 1/2 of a CDD is essentially nothing. Keeping that in mind, do you think that it went to new lows due to that minuscule EE CDD drop?
Good point, Larry and thanks:
That was just a CDD summary without much elaboration.
But here is the complete explanation, as you may have missed from looking at the graph above it. I added this to that thread you commented too.
Here's that CDD chart again for the EE. Note the last 3 days. The market is always trading more on NEW information, especially when it comes to the time frame.
A week 1 change is usually just a change in individual days vs the previous forecasts.
Pattern changes are most often FIRST seen in the week 2 period........especially at the end of week 2. As somebody that is extraordinarily gifted with analytical skills you will also note that not only is the cooling even greater than the previous run, the previous run already had this pattern change to cooler at the end of the period.
So we had a confirmation of the previous 12z Sunday run that caused NG to open lower on Sunday Evening and it was even MORE cooling.
The reason that we didn't fall much more at that point (after the 0z run came out) is that the previous 2 GEFS runs were HOT. We actually came back after that 0z run because of that.
After the 6z run came out MUCH cooler, more inline with the 0z EE, that's was the market make its huge spike lower.
I am not just reviewing what happened overnight while I was sleeping and commenting right now.
The last 2 weeks, I stay up all night for each models complete release, refreshing constantly to get each new map ASAP and tracking it with the price....... and try to take naps in between.
I'm doing it to make money (and try to not lose money) but it is the most fun thing of anything that I can imagine doing.
You can relate to how much fun this is. Over the weekend, I get much more sleep but I'm still doing the same thing for every model but without the need to get every map the 2nd it comes out...........because its so dang fun!!!
However, I hate putting on positions. REALLY hate it (unless it goes quickly in my favor by alot).
Watching and analyzing is always fun with no skin in the game.
Having a position on is extremely stressful, especially since I had gone for several years without much trading. Natural gas is so "jumpy" to use your term. And the gyrations are designed to take out close stops, which mine are right now.
A week ago Sunday Night I had a position on that would have paid off massively, doubling the amount in the account if I stayed in until the day session(using day trading margins).
I actually bought the low of the session and low of the week at 3501, which was the open too. But I was nervous and decided to put in a tight stop and it got hit shortly after getting in on Sunday Evening.
You and tjc know this horrible feeling when you watch it go right back up, then several hours later, if you stayed in you would have hit the jackpot. OUCH!!! NG traded as much as $2,500/contract higher from the open during the day session. I got out with $80/contract profit.
Despite tracking the market constantly, my aversion to having to take on the stress of the trade kept me on the sidelines all night.
1. The 0z GEFS came out pretty hot. I almost bought this but my bias was to the downside because of the pattern that I felt was evolving and the 18z came out hot too. I decided to wait for the EE.
2. Then the end of the 0z EE came out much LESS HOT. I really wanted to sell this but talked myself out of it because the 0z GEFS was hot and the earlier part of the EE was slightly warmer.
3. I actually slept thru the part of the much cooler 6z GEFS when I would have sold at the market and probably gotten stopped out for a loss because the market took about an hour to crash after that.......going back up to the highs FIRST, then crashing.
4. The 12z EE below was the complete opposite of the cooler 0z run at the end. See below. I should have bought this shortly after 1pm Central but was concerned about the close coming up and the models going back and forth and again, my downside bias so I did nothing. We had a $450 bounce after that but late in the afternoon we went back to just below what the entry price would have been. If I had traded with a tight stop, based just on a model change (its possible to make money doing just that) maybe I could have made $200/contract??? 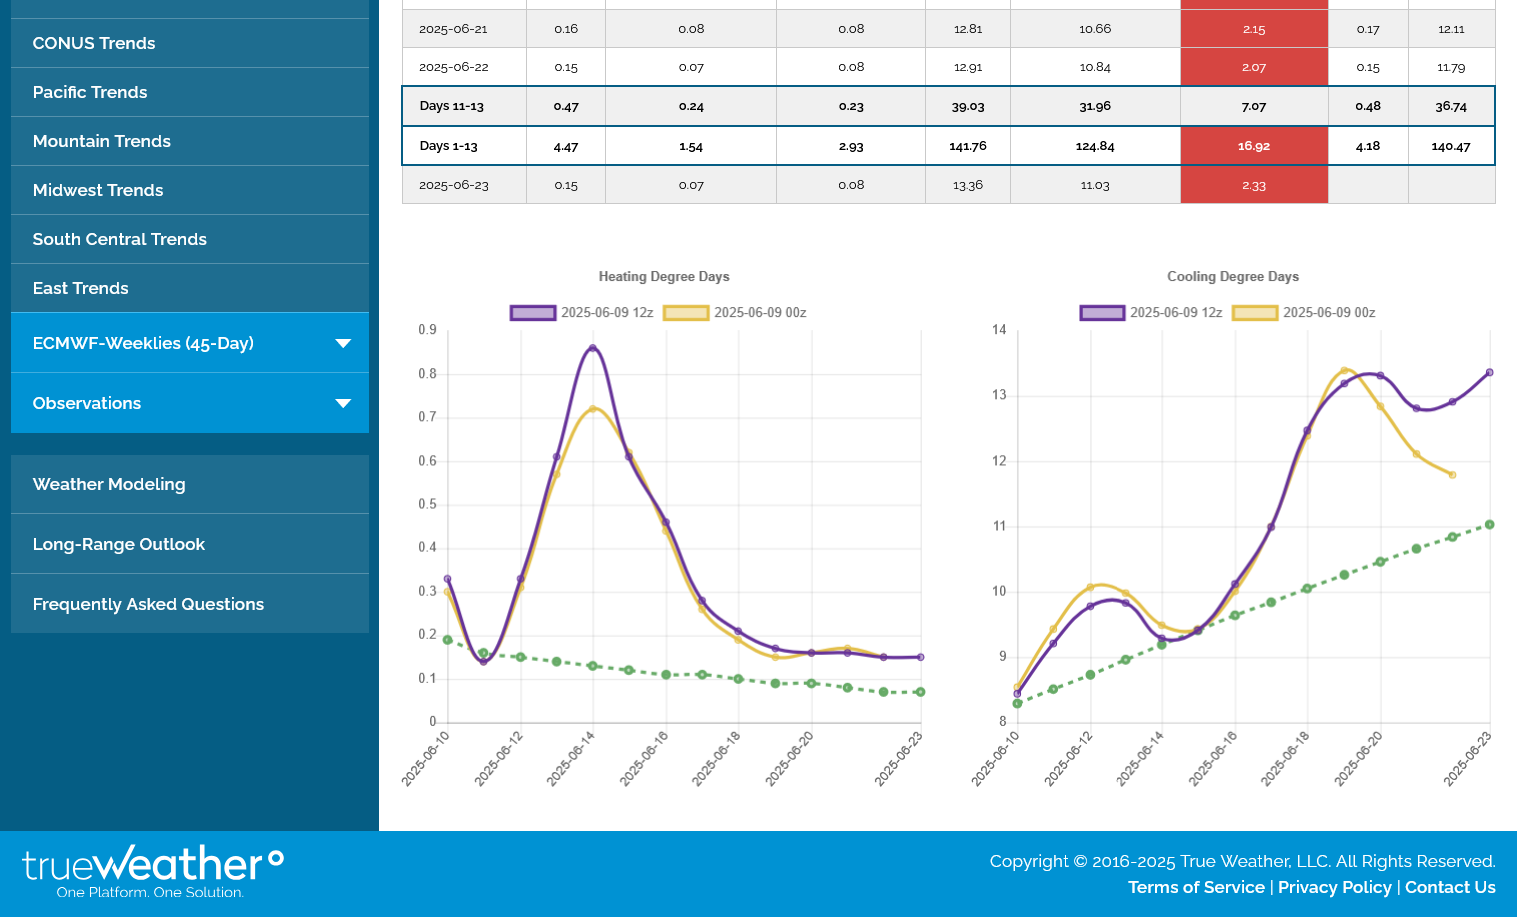
5. Now look at the just out 18z GEFS being hotter again:
Hey Mike, you’re welcome and thanks for the further explanation of your thinking regarding the EE CDDs.
Yes, when you’re winning, it indeed is a great feeling and overall it is a fun way to make a living! But it can also be stressful due to extreme frustration like the ouch you described due to tight stops. Or if you’re in a loss with a large position and you don’t get out in the hopes for a reversal based on wx that doesn’t seem to want to occur and the worry about getting out and just missing a reversal.
Due to the increased unpredictability regarding the reliability of wx changes to dominate direction as well that I noted about LNG along with my lack of desire of staying up all night like I used to when I was active, I’ve yet to resume trading commodities and it’s been almost 3.5 years since the last trade! I overall did well when I traded actively especially due to years like 2000, 2004, 2007-11, 2013-4, 2017, and 2019. The best years were 2019, 2011, and 2013. (2020 was good but only due to softs because COVID screwed up NG for me giving me only a small gain).
But I also had disappointing to downright bad years like 2001, 2014-6, and 2021-early 2022. The worst were 2015 and 2021. The last good NG year was 2019. So, NG didn’t do well 2020-early 2022. That was enough to get me to stop.
IF I were to ever resume, I’d intend to do much smaller volumes keeping stress down and also see if I could do it based on portions of the period between when the 12Z GEFS and the 0Z EE are out on WxBell. That way I would hopefully avoid sleepless nights.
In addition to resuming TrueWx, I’d then be relying on the much cheaper but probably slightly delayed WxBell vs the much more expensive service. So, that would also reduce stress. But would it be as good as the more expensive service?
Also, I’d probably concentrate on trading during mainly late Oct-Feb and perhaps a little in late May-Aug.
Mike, based on 2024-5, have wx model changes returned to being at least semi-tradable like they were before COVID/LNG added their big wrinkles?
Larry,
Ask me again later this Summer and maybe I'll have a better answer.
Looking at just the chart I sent earlier, this is not the market that you and I did well with in the past.
Many of those knee jerk reactions below are based on changes on the GEFS and EE models.
If a trader goes up by, lets say $800/contract, they wouldn't want to end up losing money. But having a stop that's less than that is inviting being stopped out on a spike, then the market going back your way.
Many wild gyrations in both directions that were not there 20 years ago.
Maybe trading grains would make more sense but what if Trump announces a deal with China and you're short beans? Better have a stop in.

The trading game is for sure alot different and I'm giving it a try using more day trades and the lower margins vs what all my great years in the distant past featured.
Mostly position trades with full margins and for 2 decades no stops. Just be extremely patient for an extremely high confidence trade based on weather pattern change in markets that were going strongly in 1 direction from weather and the opposite weather pattern was developing in the week 2 part of the forecast. I stayed in until the weather changed. If I picked the right markets, trading almost all weather, instead of a stop, I got out when the weather changed.
I build the account from 2K to 600K in the 90's/early 2000s thanks to the help from a satellite dish on the roof(with a 10K system) and a service that gave me the weather information faster than the market.
There are people getting the info faster than me/us now.
The only times I lost money was holding a margin-ed out position over weekends. In fact, on almost every trade I margined out to the max. Either it was a very powerful set up or I didn't trade it. My biggest loss was just over 250K, which was just over half the amount in the account at the time. Amazingly, I made it all back that year.
Those markets that were consistently reacting to nothing but weather, mostly grains in May-July.
Lind Waldock was very nervous about me so they assigned 150% of the margin on corn positions over 200 contracts and bean positions of 100+ contracts.
MFG went bankrupt on Oct. 31, 2011. So I borrowed money to open an account at PFG Best and put the returned money from MFG into that account. Then they went bankrupt and most of that money did not come back, that included borrowed money.
One thing that stunk in 2012 is that I had to pay taxes on the profits that I made in 2011.
After that, I actually was able to deduct some of the losses on taxes based on a new IRS rule that was made to compensate the victims of Bernie Maddoff.
I opened another account with more borrowed money and kept having to take too much money out to pay bills for 3 years, then ended up losing it all gambling and not making smart trading set ups. That happened a couple of times with a small account size, doing gambling not trading and i stopped doing much trading for numerous years.
I'm definitely not going to gamble this time and have the right trading mindset. ......I think but the problem so far is that I'm too afraid to take risk now and missing trades and having stops too tight on some trades.
However, a trade late last week with a tight stop caused me to make a small amount instead of losing money.
Mike,
Regarding federal taxes on net capital gains from commodities, do you file form 6781?
https://www.irs.gov/pub/irs-access/f6781_accessible.pdf
If you use this, you’d know that you can carryback any year with a loss to negate any years with gains up to 3 years back and get (partial or full) refunds of taxes paid in that year(s).
Yes indeed, Larry!
You would understand this better than anybody.
I had some losing years in the 2000's(never in the 1990's) and it was sweet getting back money that I paid in taxes in prior years.
I reported all the income on Schedule C and never paid SS taxes after 1993(last year as chief meteorologist for WEHT). That was nice all those years but when I retired and they averaged my income for the top 35 years that I paid SS taxes in, there were a lot of 0's.
So my wife just filed for retirement late last year and 50% of her amount is actually greater than 100% of mine so that I'm getting MORE this year because of that.
Because of the frequency and volume of my trades, I qualified as a professional trader in the eyes of the IRS for over 20 years.
My most active month ever was July 2002. I traded over 10,000 contracts of corn and beans(300 lots for every corn trade and 200 lots for beans-Lind Waldock gave me my own phone number to call in orders. They called it the high rollers hotline). I also made over 150,000 during just that 1 month.
However, I paid $20 per round turn back then. If you multiply $20 X 10,000 contracts, Lind Waldock made $200,000 on me in that same month!!
Now that I think about it. I almost never traded in Mar-Apr-Sep-Oct-Nov.
Mostly ng in the WInter/ D-J-F and grains in May-June-July-Aug but I did cotton a few times. Also coffee and OJ during the WInter on freeze threats, a total of maybe a dozen times.
A big benefit was to file on Schedule C. Also using the 60/40 rule.
60% of it was taxed at the long term capital gains rate, which is 15% right now.
40% of it was taxed at the short term capital gains rate, which is 35% right now. After my bigger years this was a lower rate than if it was W2 income.
I always thought that was odd because the length of time that I held positions for was a matter of an hour for the shortest to less than 2 weeks for the longest, with most being less than a week. But I got taxed at the lower 15% rate for so much of it.
I also got to deduct most of the costs. Like the 10k satellite system. My monthly fees for weather data. 10% of the cost that we spent for the house because I was using that much of the house as my office.
Looking back, I've lived several different wonderful lives.
Chief meteorologist and local celebrity on tv for 11 years. Then professional commodities trader for 2+ decades. Now doing this for the past 6 years.
Along with being a scholastic chess coach for 5,500 students at 5 schools the past 3 decades.
I was also involved with over half a dozen non profit organizations, working with other generous volunteers for great causes.
Not too many people have been so dang blessed with such a rewarding and fun life.
https://rjofutures.rjobrien.com/rjo-university/filing-taxes-on-commodities-trading
Larry,
I can tell by your great analysis here that you have the right mindset and skill-set to be a profitable trader.
However, I have to agree with you on how the markets have changed drastically compared to 2 decades ago and especially 3 decades ago when the information that I was using as a meteorologist trading the weather was a massive edge over almost everybody else.
After 2 years of making money on almost every trade, I remember telling my wife, "this can't keep going like this, I've read alot of books on trading and nobody keeps making money on every trade like this"
Well, it did go on like that for the most part for over a decade, then things started getting tougher. If not for that initial, very successful period, with me learning things all the time and understand it so well, I would not even be still trying to do this now in this much tougher environment.
I wish that I had paid off the house when I had so much money in the account.
We had to refinance the house in 2017 because of not having enough money and have been struggling since then.
25 years ago I thought that could never happen.
"Ask me again later this Summer and maybe I'll have a better answer.
Looking at just the chart I sent earlier, this is not the market that you and I did well with in the past.
Many of those knee jerk reactions below are based on changes on the GEFS and EE models."
Larry,
Its just 1 day later in the Summer and I can already elaborate more on that answer.
Last week, I told my wife that staying up much of the night and closely following how ng trades/reacts to every map of every model was training............while I got paid a little money for it.
To be honest, I knew this was happening already from doing observations previously but I didn't have the much faster weather service that you tipped me off about to track it closer or even consider doing this. It's actually thanks to you, Larry!
Anyway, we had a reaction to the last 6z GEFS that serves as an example for why ng is pretty untradeable at times.
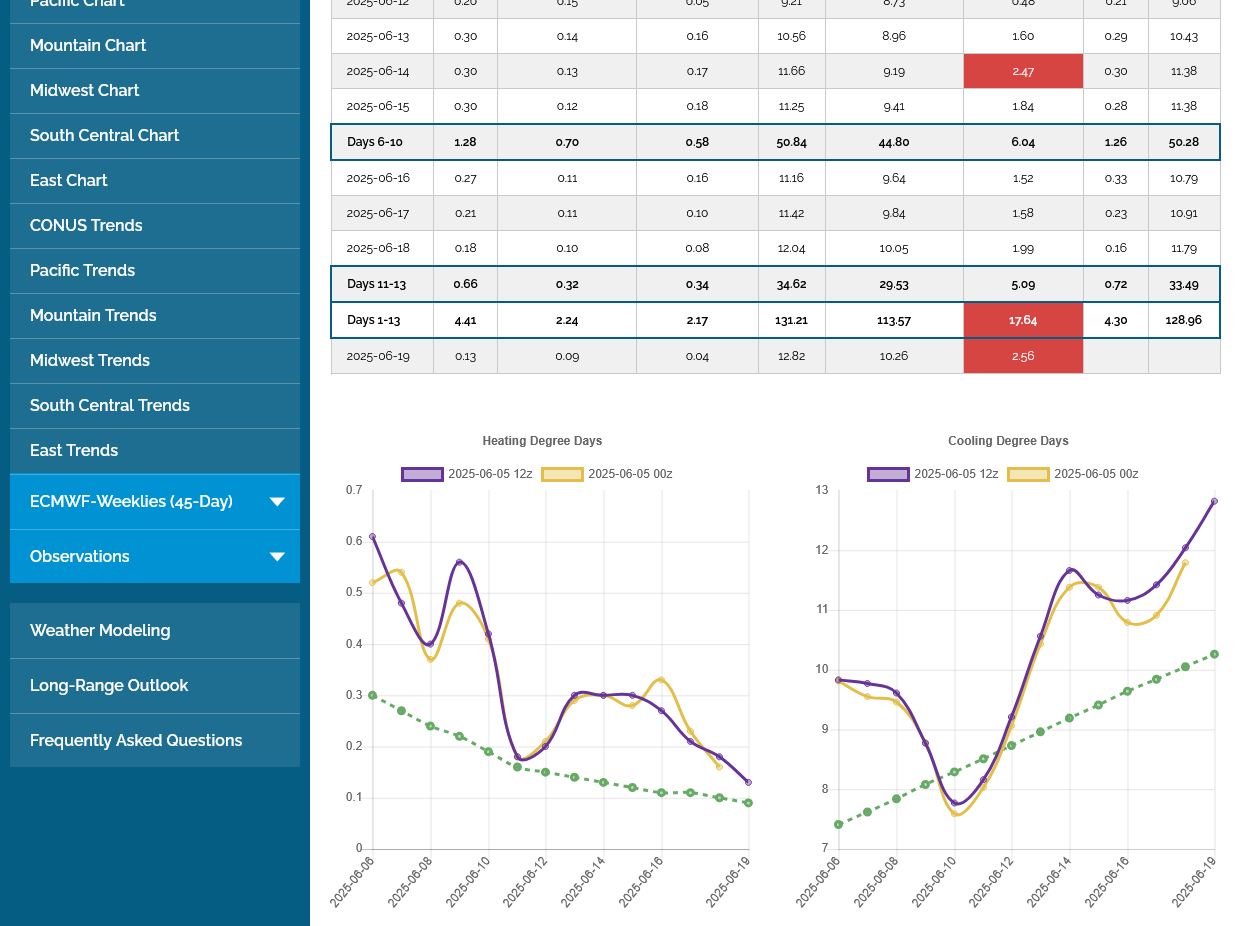
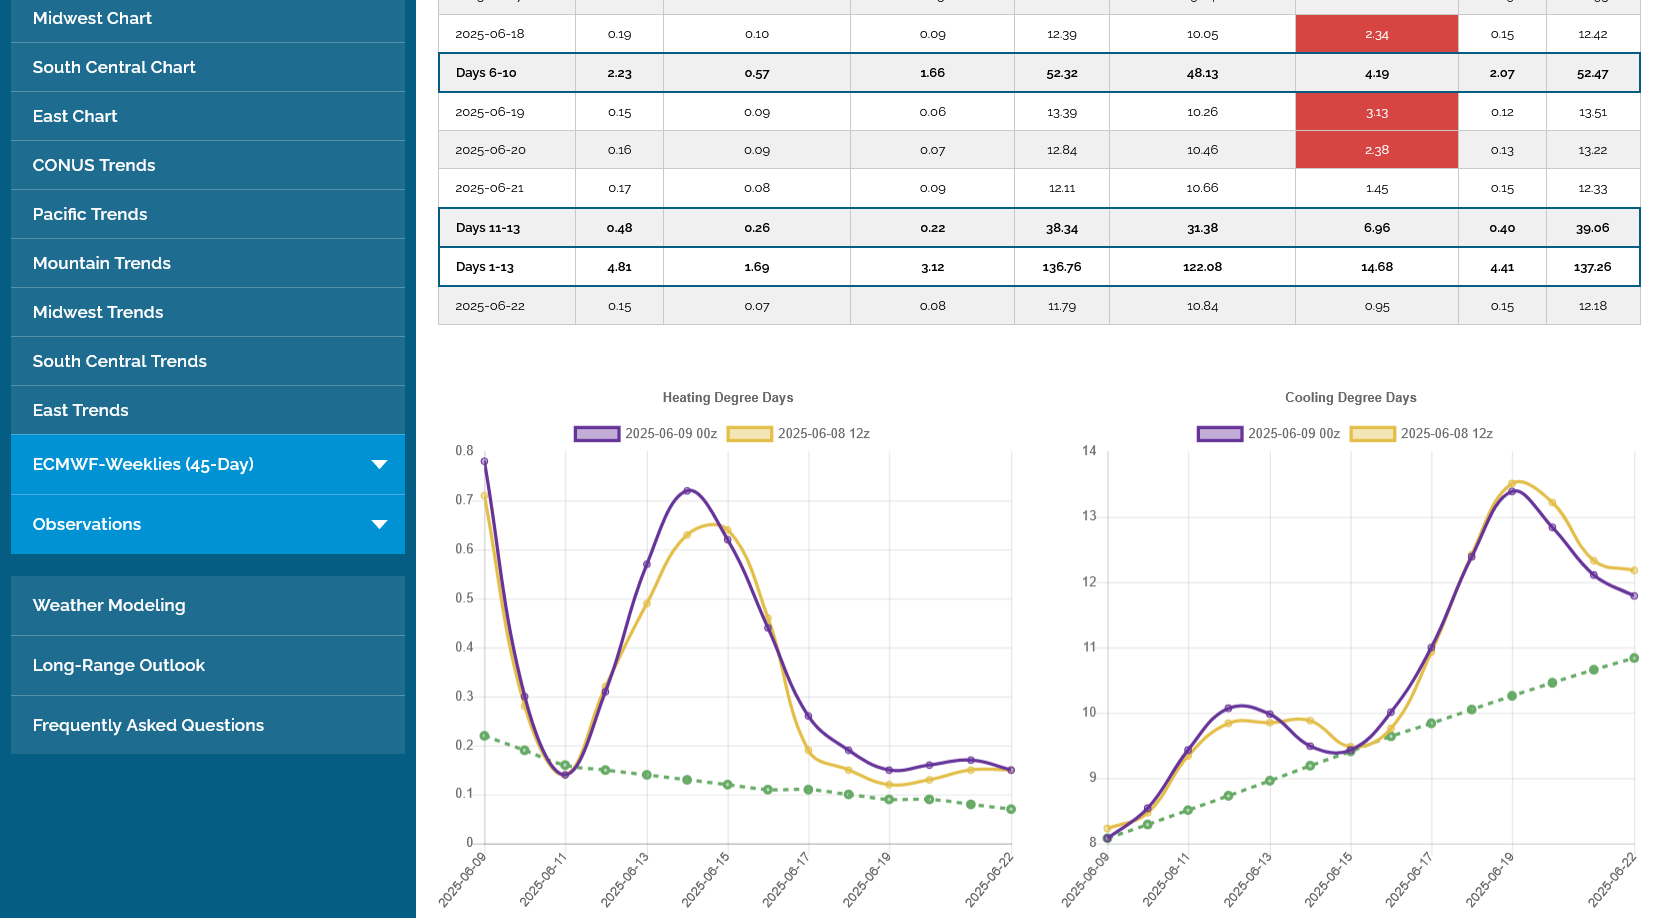
Here was the CDD chart to show you what caused it:
The purple line on the right was the last 6z run that came out around 3 hours ago. The forecast maps slowly come out for 6-12 hour periods over the course of an hour or so until the entire 2+ week solution is done.
Note that early in the run, the CDDs were close to the previous runs. During the 6-10 day period, the CDDs were actually a bit less than previous runs and the ng price was selling off to near the lows. Then, when day 11 came out, you can see the big jump, MUCH higher than the previous 3 runs. This added +4 CDDs vs the previous run in just those 4 days and +8 CDDs vs the 12z run from Monday midday.
The market acted in predictable fashion based on my previous assessment on Monday for the overnight Sunday session but makes it almost untradeable at times. More below.
+++++++++++
https://tradingeconomics.com/commodity/natural-gas
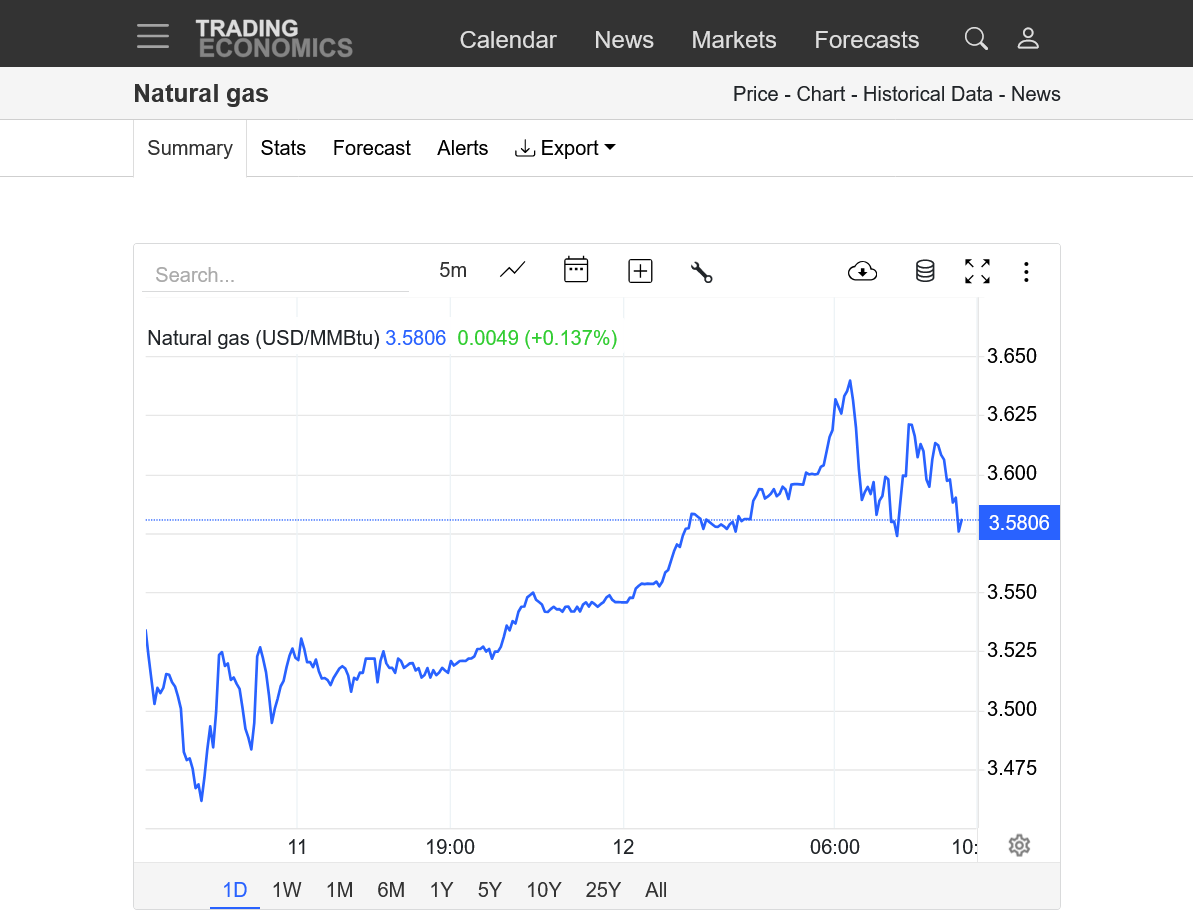
1. At ~6:40 am, ng was trading around 3.60, near the lows because the first 10 days of the GEFS were a bit cooler and the end of the EE was also significantly cooler
2. Then when the first warmer day above came out, day 11 we immediately spiked to near 3.65. An increase of over $400/contract in a few seconds. From near the lows to the highs in just a few seconds. While those HOTTER days came out at the end of the 6z GEFS forecast, we traded up there for ~30 minutes.
3. Then at ~7:10 am, ng had an even bigger spike downward, over -$600/contract in less than 15 minutes that took out the previous lows. Anybody that bought the much warmer end of the 6z GEFS was well under water or stopped out.
4. Then we bounced back to almost the mid point of the new trading range, then back to barely new lows, then back to the mid range.
5. Then we had a huge new selling surge at ~8: 25 am that dropped prices by around -$600 over the next 30 minutes. We've been hanging out in that area since then.
6. The end of the last EE was LESS HOT, SEEN BELOW. This is important context because of the COOLING at the end of the period. The market is throwing the 6z GEFS out the window and believing the 0z EE and also:
a. Storage has made massive (bearish) gains the past 2 months.
b. Seasonals turn sharply lower here.
c. These HOTTER forecasts hit the market last week and caused a huge, $3,500+ move higher. The BEST time to be long is when the market is initially dialing that NEW weather information in NOT when the market already knows about it.
d. 4 days at the end of the forecast is obviously important regarding where we are headed in week 3 but they will always have the least amount of skill and when an outlier solution like the 6z GEFS comes out this hot, its easier for the market to discard it after the initial reaction.. 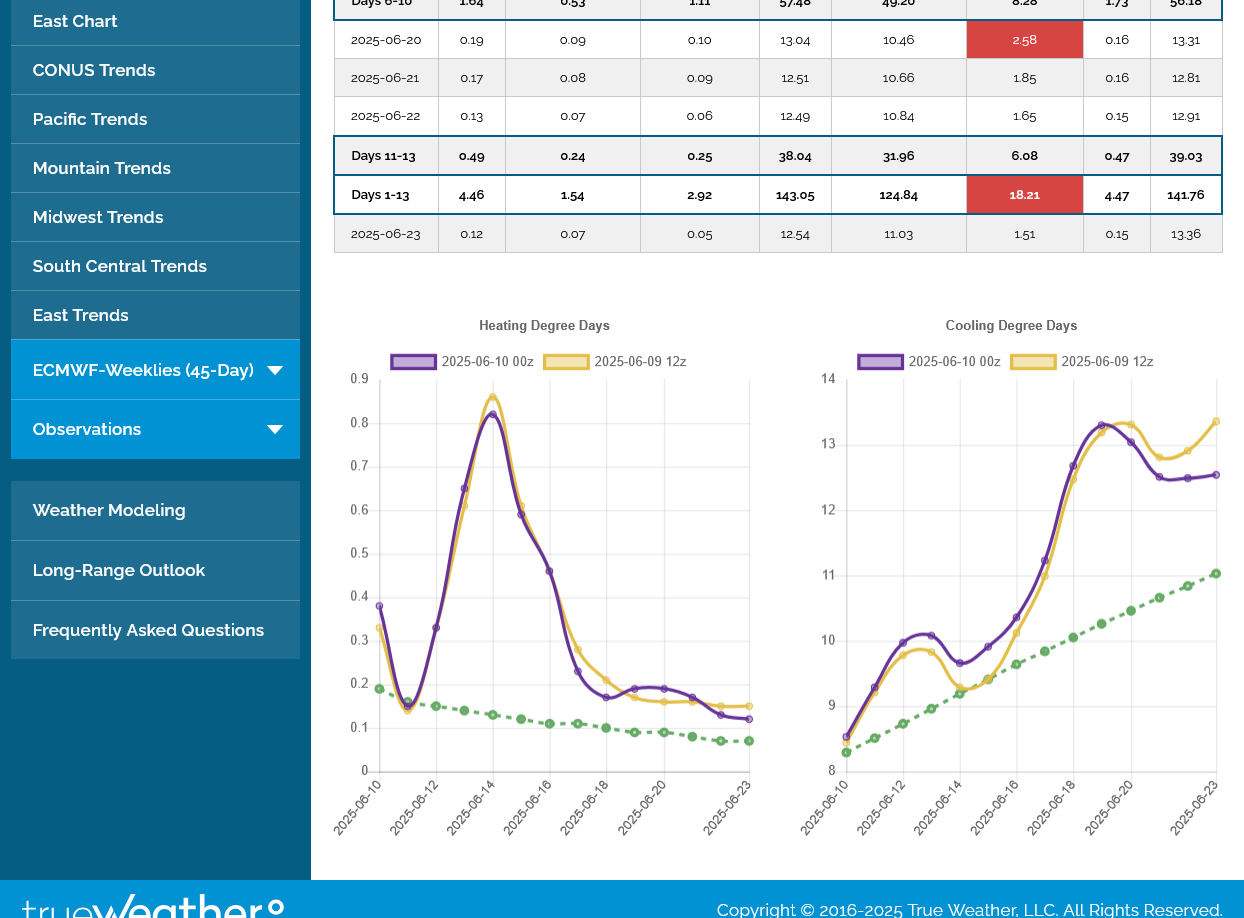
+++++++++++++++++
So the average trader is not going to be able to trade this without taking on tremendous risk and if you put in a tight, trailing stop it WILL BE HIT.
I actually have a good idea of how I, personally can trade this type of market overnight, similar to how I did it last week but using only trades that follow a well defined set up and only if I'm on my computer and able to quickly put in tight stops when needed. There will be some trade set ups, like a week ago Sunday Night that warrant a wider stop or even no stop if they position is small.
Having the updated maps refreshed constantly is a key part of this strategy and it requires losing alot of sleep, having alot of stress and sometimes losing money. ..............which is actually why, just like you I stopped trading ng actively several years ago.
The grains on the other hand, might be slightly more tradeable for a position type trade or even a day trade with much fewer of the wild gyrations.
However when the grains open at 8:30 am and the big funds take over, there is EXTREME volatility that can take the price from new highs to new lows in just a few minutes.
The markets are NOT like they were 2+ decades ago
The key short ter support area for NGN right now is 3.501, which was last weeks open and low based on the forecasts all turning hotter over that weekend. Then, around the 3.46 area from the end of the previous week.
The models actually got cooler overall this week, if that continues, considering all the negatives with this market stated above, we could go all the way down to support levels much lower. 3.24 or even 3.1 if we lose much of the heat.
However, the heat can increase too which could provide good support.
https://tradingeconomics.com/commodity/natural-gas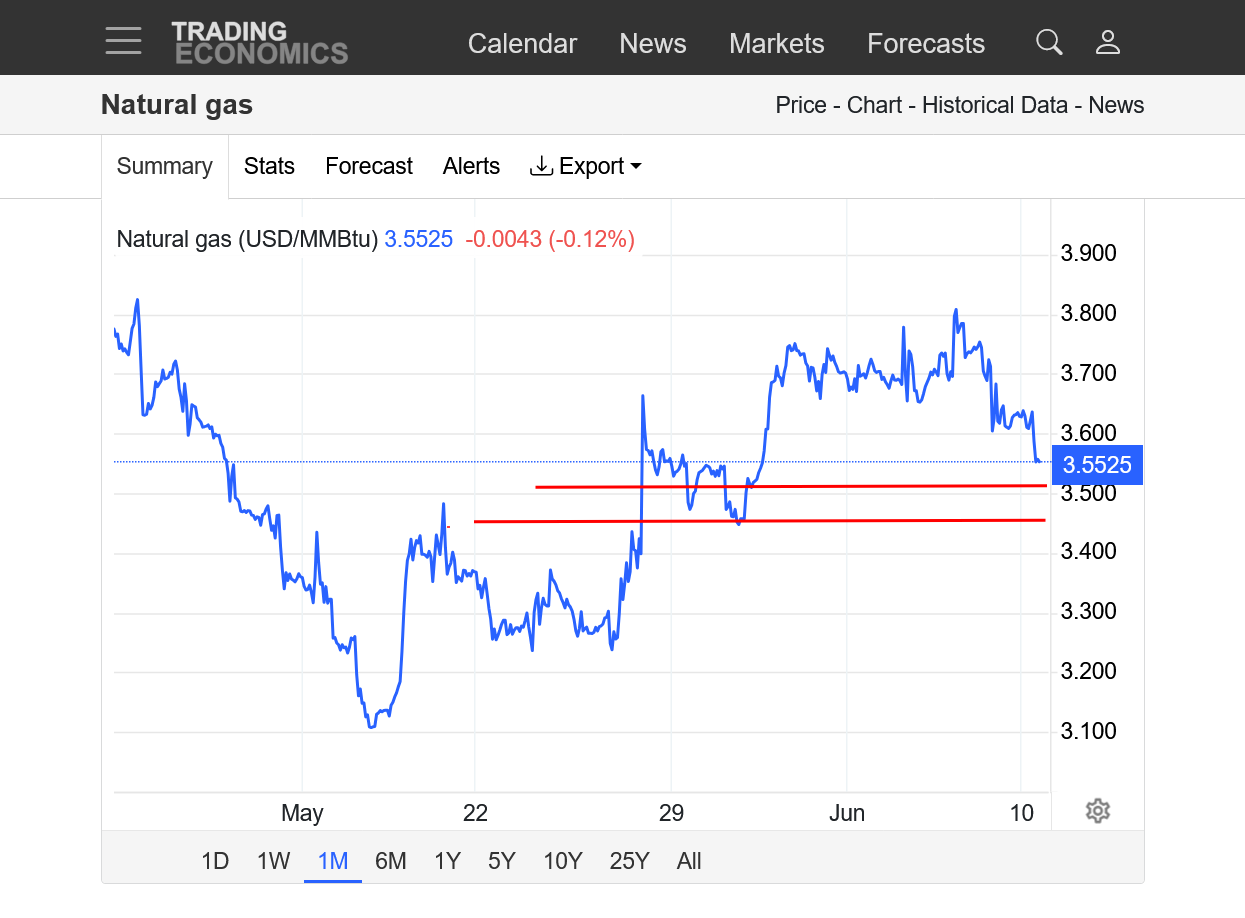
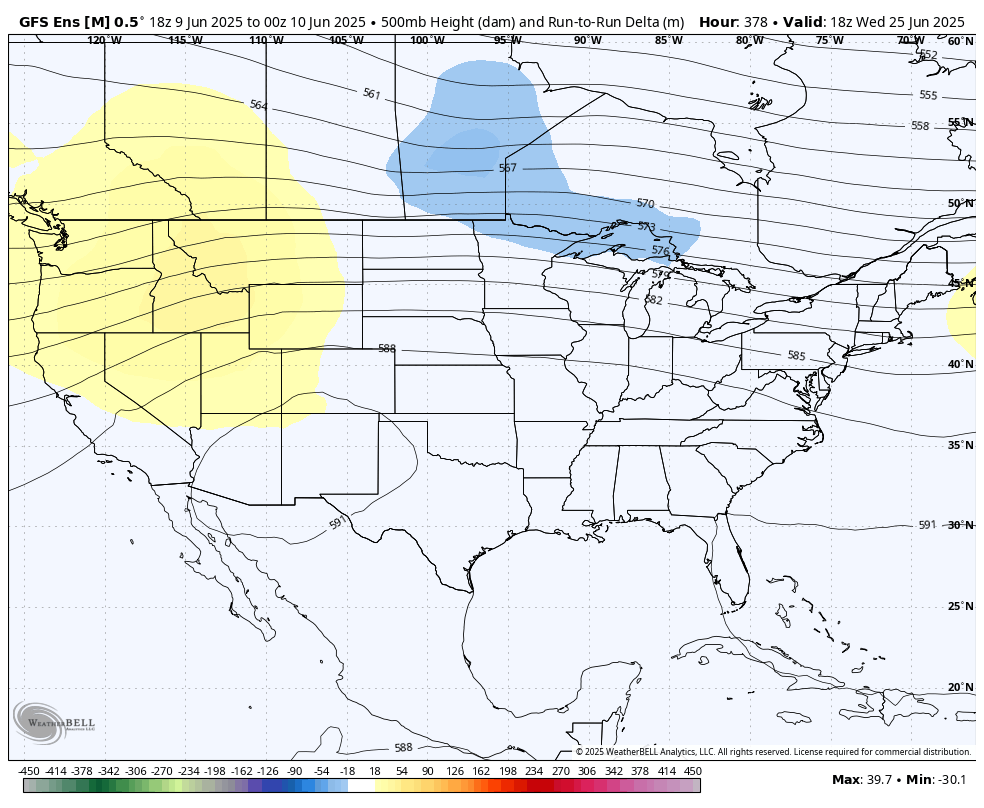
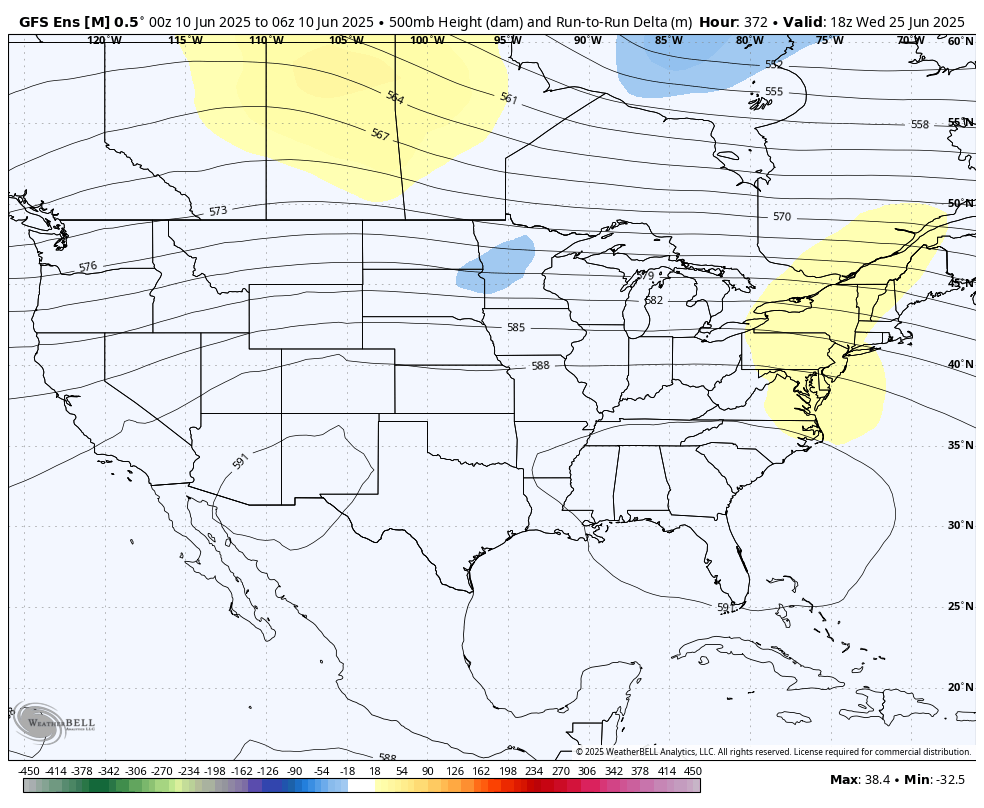
This is what made the last 6z GEFS so POTENTIALLY bullish. This is the June 25 solution.
The NEW upper level heat ridge in the Southeast:
1. Previous 0z solution: 591 dm contour in FL. Fast flow along the Canadian border with slight nw to se movement and some cooler air working in from Canada.
2. 6z solution. Big, 591 dm heat ridge, centered in the Southeast with ridging to the north and heat there.
3. Temperature disparity/change as a result of this change(6z temps - 0z temps). Lots of extra heat where lots of people live!
NG spiked higher overnight from some hotter days on both the GEFS and EE models.
BUT CAN"T HOLD MUCH OF THE GAINS. This is a bad sign for the bulls and suggests the highs might be in for the short term/June. We can still make new high later this Summer if persistent, intense heat erodes storage vs previous years .
9:45 am: Now we've reversed lower after the time of the post above! See charts below. Poised for a downside break out, even with intense heat in the forecast that is more than yesterday! This is why I've had a strong downside bias all this week. The market dialed in ALL the heat last week and we had a buying exhaustion at the top. We are unable to generate enough fresh buying on more heat this week because everybody buying on added heat already bought last week and many of them are underwater.
Much of last week was also short covering of large positions that were put on while we added huge amounts to the storage vs previous years, when the forecasts turned much hotter early last week( after a very cool/bearish May/early June).
This was the last 0z European Ensemble model:
+++++++++++++++==
1. 1 day
2. 1 month
3. 1 year
https://tradingeconomics.com/commodity/natural-gas
Larry,
With regards to trading this using weather. Not a good idea based on the explanation on the previous page and ng having a buying exhaustion from the added heat in the forecast last week.
The best trade would have been using the models turning sharply cooler so that the weather lined up with the other NEGATIVE fundamentals(storage increasing), chart formation, seasonality and market psychology.
However, what i did overnight was take advantage of the spike higher from the guidance turning hotter with a very tight, trailing stop........that got hit quickly with a dinky profit.
There is almost no way that I would have sold overnight with a forecast this hot. Momentum and technical indicators are screaming sell right now too and it will take a huge dome of death to rescue this market. .........but that's not likely.
Sometimes, the smartest thing to do is wait for a better set up and there will be dozens more this Summer. If the forecast turns much cooler, this is still a good place to sell.
++++++++++++++++++++++++++++
As shown on Monday, this source is DEAD WRONG again about why natural gas was higher overnight. Both of the main models were HOTTER. I watched the market's bullish reaction in real time as each map of each run came out(also some brief drops on cooler days coming out).
We've reversed lower and are clinging to support here but this is $3,000/contract LOWER than the close last Friday.
Here's the last storage report. The blue line of current storage has made some amazing(bearish) gains after last Winters cold cause a huge drawdown to the bottom of the 5 year range. The current price of ng is not exactly cheap, especially considering storage is now well ABOVE the 5 year average. If we want to see the $4 handle in ng, the storage needs to start plunging vs the average, with widespread, long lasting intense heat.
Look for another robust injection vs the average tomorrow at 9:30 am, thanks to our cool start to June:
https://www.cpc.ncep.noaa.gov/products/tanal/temp_analyses.php
This is what the updated charts look like after today.
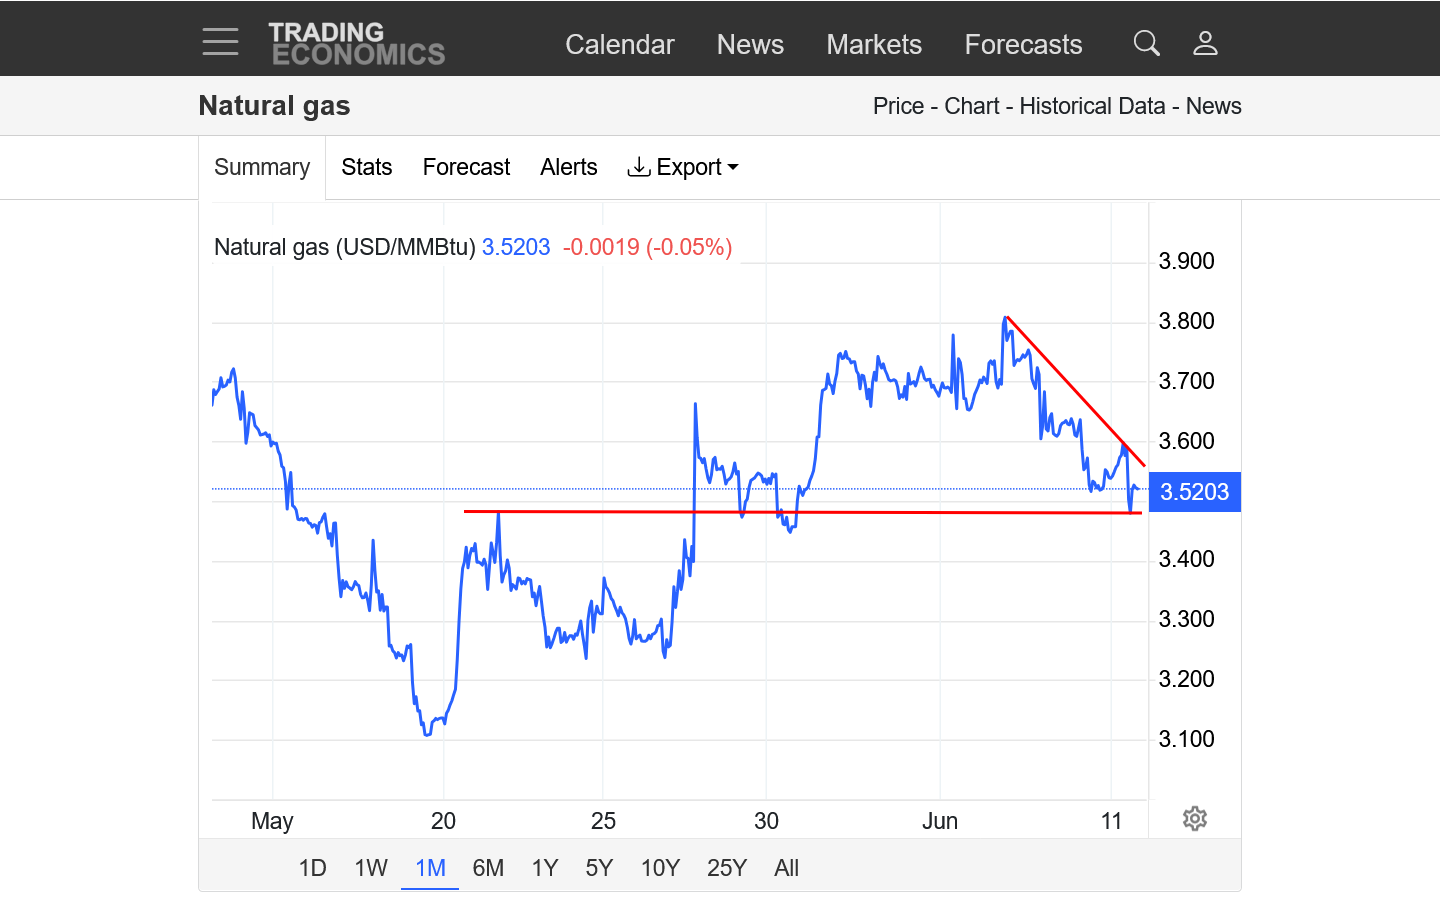
https://tradingeconomics.com/commodity/natural-gas
1. 1 week-major short term top last week/Friday, just above 3.8
2. 1 month-major short term top last week just above 3.8!
3. 1 year-symmetrical triangle-MAJOR high at the end of a cold Winter-current formation at this time frame looks like a potential BEARISH PENNANT/FLAG TOO. The weather will determine which way we break out.
4. 10 years-symmetrical triangle
Just out 12z European Ensemble CDDs.
+1.27 CDDs(minor) but they are falling at the end which negates the bullishness. This helped NG to bounce a bit off the lows but this is NOT a good reaction for the bulls to the upcoming heat.
Hey Mike,
I don’t have the CDD comparisons. But with the big injection in the prior week and with Memorial Day week often having the highest injection of the year, it’s very likely tomorrow’s report will show a smaller injection.
We think alike, Larry! I was going to mention the same thing in that post but glad that you said it first!
The last 0z European Ensemble model was +4 CDDs hotter (after the 18z GEFS was +6 CDDs hotter-but that was taken away in the 0z/6z runs) and that has brought NG back to life overnight, after holding some key support on Wednesday.
The the last 2 EE runs are on the right. Purple was the 0z run. Tan was the previous 12z run from 12 hours earlier.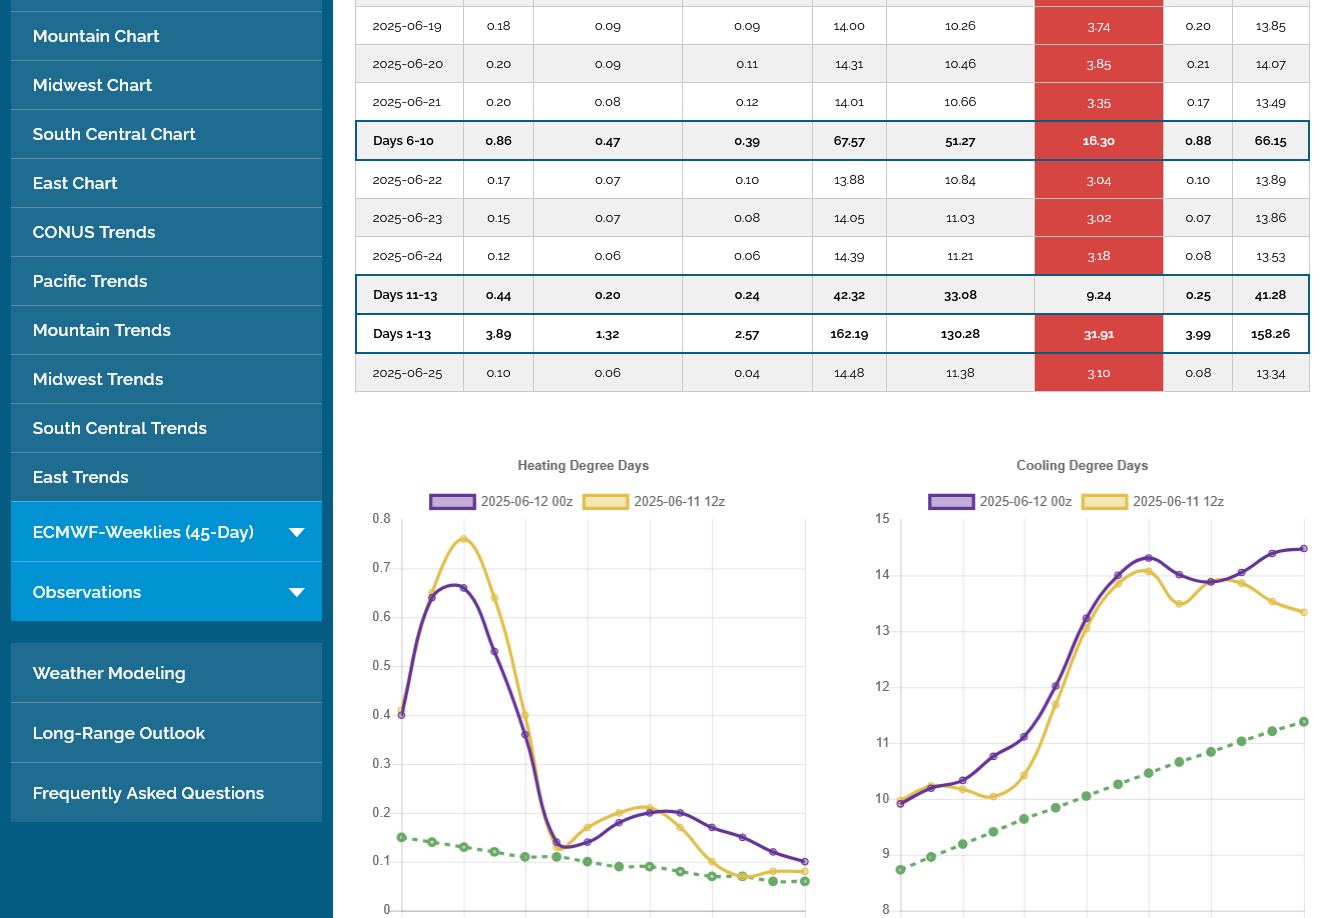
1. 1 day
2. 1 week
The U.S. Energy Information Administration (EIA) was expected to report data at 10:30 a.m. ET showing Lower 48 natural gas stocks grew by more than 100 Bcf for a seventh consecutive week. That would tie the record run of seven weeks set in May to June 2014.
++++++++++==
There is the chance for this report to come in slightly bullish(vs expectations only).
1. Temps last week for this report
2. MUCH more bearish temps the previous week for the massive +122 Bcf injection that included Memorial Day. The cooler it is, the less NG burned to generate electricity for residential AC cooling needs.
https://www.cpc.ncep.noaa.gov/products/tanal/temp_analyses.php

++++++++++++++++++
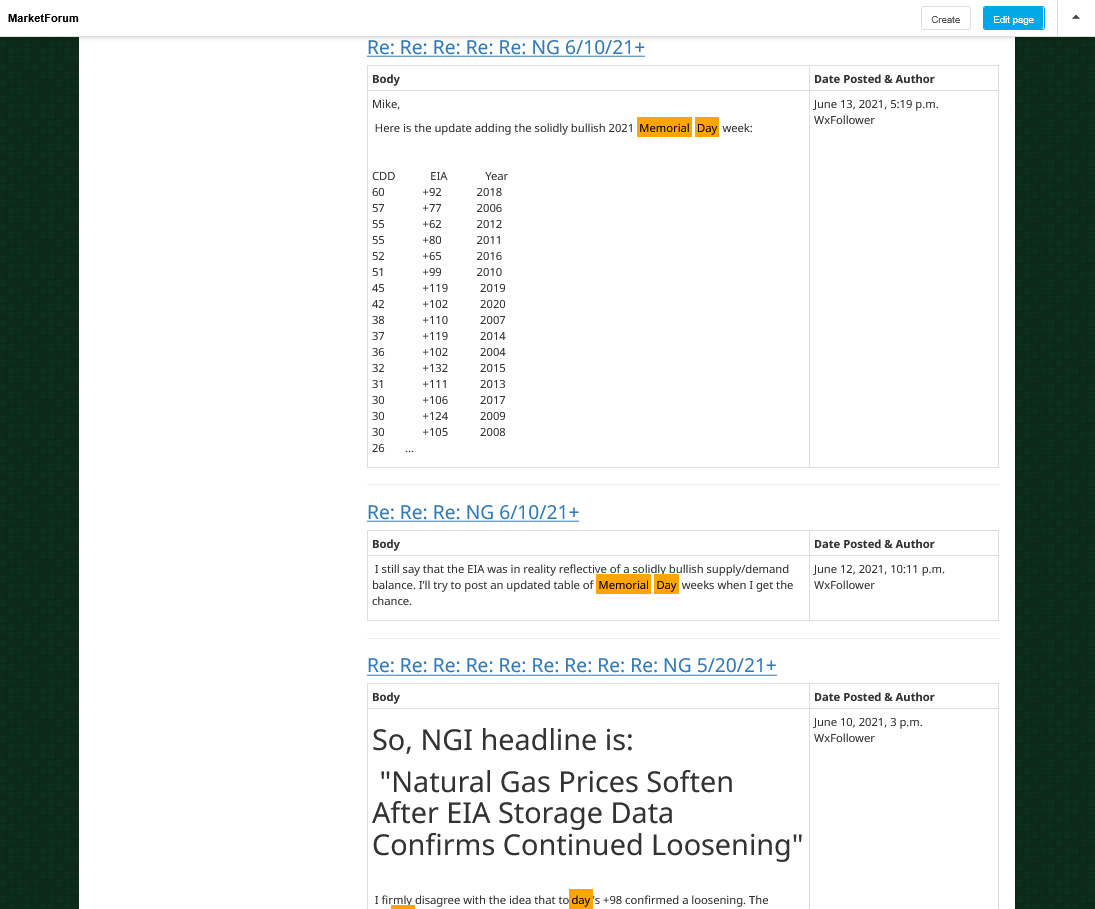
BEARISH!
+107 Bcf. Note the blue line below on the graph continues to rapidly gain on the 5 year average and move up in the 5 year range.
This will go the other way in July, after widespread, long duration heat hits later this month.
![]()
for week ending June 6, 2025 | Released: June 12, 2025 at 10:30 a.m. | Next Release: June 18, 2025
| Working gas in underground storage, Lower 48 states Summary text CSV JSN | |||||||||||||||||||||||||
|---|---|---|---|---|---|---|---|---|---|---|---|---|---|---|---|---|---|---|---|---|---|---|---|---|---|
| Historical Comparisons | |||||||||||||||||||||||||
| Stocks billion cubic feet (Bcf) | Year ago (06/06/24) | 5-year average (2020-24) | |||||||||||||||||||||||
| Region | 06/06/25 | 05/30/25 | net change | implied flow | Bcf | % change | Bcf | % change | |||||||||||||||||
| East | 531 | 498 | 33 | 33 | 599 | -11.4 | 514 | 3.3 | |||||||||||||||||
| Midwest | 608 | 579 | 29 | 29 | 709 | -14.2 | 603 | 0.8 | |||||||||||||||||
| Mountain | 210 | 205 | 5 | 5 | 223 | -5.8 | 159 | 32.1 | |||||||||||||||||
| Pacific | 266 | 261 | 5 | 5 | 276 | -3.6 | 242 | 9.9 | |||||||||||||||||
| South Central | 1,091 | 1,055 | 36 | 36 | 1,157 | -5.7 | 1,050 | 3.9 | |||||||||||||||||
| Salt | 351 | 340 | 11 | 11 | 335 | 4.8 | 313 | 12.1 | |||||||||||||||||
| Nonsalt | 740 | 715 | 25 | 25 | 822 | -10.0 | 737 | 0.4 | |||||||||||||||||
| Total | 2,707 | 2,598 | 109 | 109 | 2,963 | -8.6 | 2,568 | 5.4 | |||||||||||||||||
| Totals may not equal sum of components because of independent rounding. | |||||||||||||||||||||||||
Working gas in storage was 2,707 Bcf as of Friday, June 6, 2025, according to EIA estimates. This represents a net increase of 109 Bcf from the previous week. Stocks were 256 Bcf less than last year at this time and 139 Bcf above the five-year average of 2,568 Bcf. At 2,707 Bcf, total working gas is within the five-year historical range.
For information on sampling error in this report, see Estimated Measures of Sampling Variability table below.
Note: The shaded area indicates the range between the historical minimum and maximum values for the weekly series from 2020 through 2024. The dashed vertical lines indicate current and year-ago weekly periods.
+++++++++++
That took some of the steam from the surge higher after the latest models turned hotter compared to yesterday. We dropped close to mid range. If the 12z model updates keep the extra heat in the forecast and especially if they add more, we should go higher. If they get cooler, we should see increased selling pressure.
I really have no idea on what the next model runs will show other than widespread heat for sure, along with them being either hotter or less hot by X amount.
++++++++++++
After spiking to a low at 1pm CDT, ng had a sustained recovery to close a bit higher.
Story of the Day
Global natural gas prices surged on Friday after Israel launched an attack against Iran, threatening a broader conflict in the Middle East that could disrupt energy flows in the region.
++++++++++++++++++
The 0z EE had 5 much cooler days and NG was under pressure for several hours after that but recovered and in fact soared higher during the day session because those 5 days are just individual days in THE SAME HOT PATTERN.
Thinking that NG opens HIGHER tonight from an increase in heat compared to the same days on Friday and also, 2 more hot days added at the end of the forecast that were unknown on Friday.
Update 4:20pm : Since we closed near the highs on Friday, this will be A BIG GAP HIGHER OPEN which is usually a very bullish chart formation.
NG rarely opens on Sunday at around to the same price that it closed at on Friday during weather markets.
I attribute some of this to traders who positioned for X amount of heat/cold on Friday that react to it being either more/less on the open Sunday. This greatly amplifies the reaction with so many traders, all at once reacting at the open .
Also, 2 days have passed without the market having a chance to dial in changes which may have accumulated vs the 1 hour time frame of ng being closed during the week(when nothing happens). 4pm to 5pm Mon-Thu.
During those 2 days with the market being closed, there are dozens of model runs from the major models..........which can often feature incremental changes in a similar direction per run that add up after 2 days.
+++++++++
The last run of the 12z European Ensemble is below in purple. CDDs on the right were +3.4 vs the previous 0z run 12 hours earlier. This is pretty bullish for tonight's open.
++++++++++++++++++++
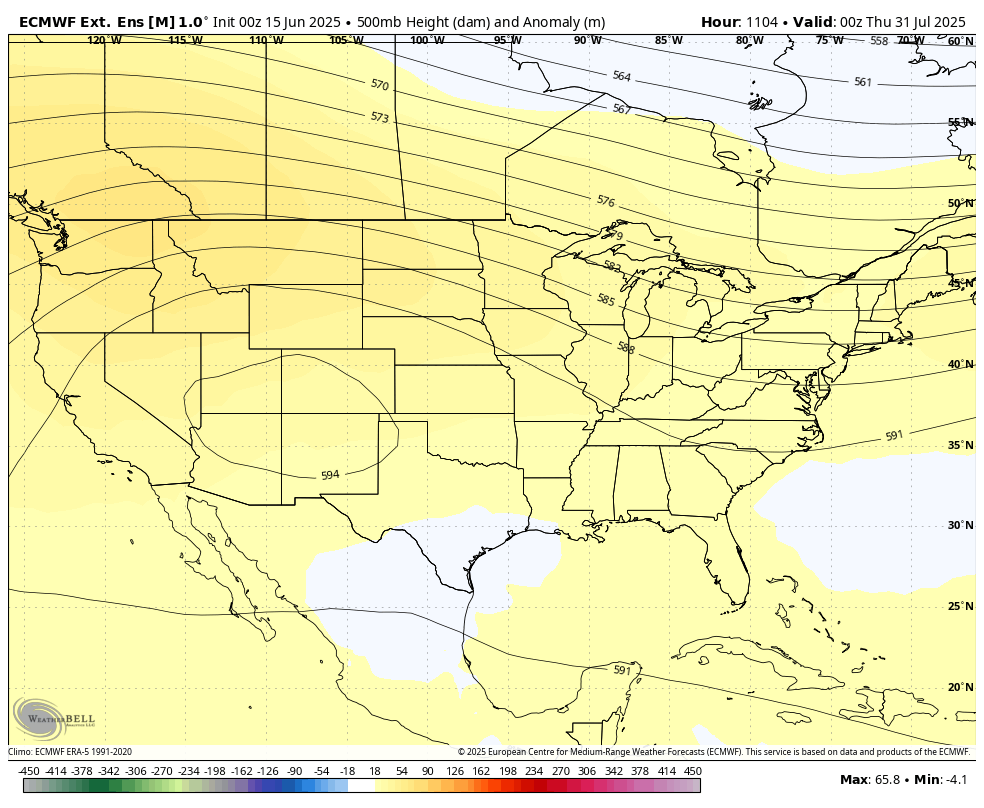
July weather update from the just out European model:
1. 500 mb map to start July with anomalies. Huge upper level ridge and positive anomalies. Widespread intense heat. How far north will the warm air aloft cap the air and defeat rain making??
2. 500 mb map to end July-upper level ridge backing up westward. Western half of the US will have the greatest heat. Troughing in the East. Temperatures may be closer to average along the East Coast.
We got the big gap higher, around $1,000/contract higher than the close on Friday.
I wouldn't want to see this gap filled if I was a bull. But until that happens, it's an upside breakaway gap higher!
+++++++++++++++=
We spiked higher during the first minute and have dropped to below the open, showing that the open was overdone as it often is without much immediate follow thru but there's an entire week of trading ahead of us and this is only 5 minutes. Most of the gap is still open.
The crude spike to $4+ higher during the first minute, now down to $2 higher played a role too.
Extremely volatile and dangerous time to trade.
The source for this chart often has flaws.........but its free and easy and comes with news too.
In this case, it completely missed the open and spike higher to 3.760 in the first minute of trading on Sunday evening.
However, it does demonstrate the point that i want to make. Look at the gyrations in price up and down and up and down since the open last evening. Lot's of uncertainty. Not in the heat coming up. It's going to be the dominant weather feature and pretty intense but late June, historically features LOWER natural gas prices and storage has increased vs average every week for 2 months.
So its the heat vs other fundamentals battling it out at, what is not exactly a cheap price.
https://tradingeconomics.com/commodity/natural-gas
1. The last 0z EE was -2.2 CDDs(bearish) but the market actually went up after that.
2. The last 6z GEFS(tan line) was the MOST bullish of all, +4.4 CDDS vs the previous 0z run and +CDDs vs the 12z run
before that but ng initially went down, then up, then down to new lows at 9:30am at 3634 and now back closer to the highs of the session, +1,500/contract from Fridays day session close.
3. This is not a good weather market to trade at the moment because of all the gyrations from the lows to the highs in the same trading session. Ideally, the move goes in 1 direction and doesn't have reversals in the same trading session that are followed by reversals of the reversals.
One of the biggest problems with this is giving up a ton of profits after a reversal and if the weather changes at that time, you end of losing money on a trade that you might have been ahead on by 1,000/contract.
These gyrations are likely from large traders using algorithms to trade that often spike to a new low or high and hit all the tight/close stops of weak hands that are afraid to risk money.
I will speculate that what they do is, based on resting orders and likely stops, they will put in an order large enough to push the price thru the support/resistance when they know there are even larger STOP orders to do the opposite which are market orders when they get hit.
For instance, if NGN is trading 3655 and the low has been 3650, they can see the resting buy orders 10 deep and speculate about the stops(automatic sell at the market orders) below that levels.
In some situations where the market is most vulnerable, this is what they do. They satiate the buy orders with selling that knocks the price down BELOW 3650 and where the SELL stops get hit(selling at the market) which is when/where they buy back the ng they sold above 3650 and in some cases where they actually go long if there are enough sell stops being hit to offer that opportunity.
For sure they will use a form of AI that has been around for a while. Their computer identifies the different resting orders and prices that make this short term trading strategy profitable.
One way to not let this mess you up is to not put in tight stops but that leaves you vulnerable to large losses. Sometimes, when resistance or support is violated like that, it will attract NEW buying and selling that causes the price to keep going in the same direction. Their computer program can quickly re calibrate to adjust for this at times and instead of buying to get the price back about resistance, they will sell even more to overwhelm any buying which often hits a new layer of sell stops and unless there is a more powerful force at play (really bullish weather which rallies the bulls that jump in with gusto to buy) this can set of selling signals and positive feedback the reinforces the spike below resistance.
Let me demonstrate the point on the previous page now that ng has closed for the day session.
At 9:30 am, 4 hours earlier natural gas spiked to new lows for the session, below 3.650.
Considering that we are closing on the highs, more than $1,000/contract above that seemingly random spike lower, we have to ask:
Why did natural gas drop to new lows at 9:30 am, after the most bullish 6z GEFS and when there was no apparent news to cause it?
I speculated on why earlier. A small day trader that bought the open last night above 3.700 would be under water by $500/contract and maybe throwing in the towel with a tight stop below the previous lows. ........then getting stopped out for a loss at the new lows and missing out on nice profits at the end of the day.
Yes, this really is how it often works trading, especially with natural gas. I've let this happen to me more times than I can count and should know better but in recent times, with a small account don't have the right mentality and instead focus too much on not losing money (by using tight stops) vs letting my work/analysis determine the strategy.
The problem for the average trader is they don't have all that analysis to justify holding on to a position when the market is sending out FAKE sell signals from algorithms.
https://tradingeconomics.com/commodity/natural-gas
The gap higher open on Sunday Evening because of the additional heat in the forecast over the weekend vs the Friday Afternoon close remains open so it's still an upside breakaway gap until it gets filled.
The market was unable to take out the highs from the first minute of trading because there are some bearish factors, resistance and selling when we get to higher prices.
 +++++++++++++++
The EIA injection this Thursday will not be nearly as robust as the last 10 injections!
We had major heat out West, along with it being very warm along the East Coast and deep South. This increased residential cooling needs which comes mostly from electricity that was generated by burning natural gas.
https://www.cpc.ncep.noaa.gov/products/tanal/temp_analyses.php
The market continues up after the bullish gap higher on Sunday evening.
The last 0z EE was another +3 CDDs hotter overnight compared to the previous 12z run from 12 hours earlier.
This is a sample of some of the heat headed towards the highly populated areas of the US which will be burning natural gas to generate electricity for residential air conditioning.
https://www.marketforum.com/forum/topic/83844/#83851
++++++++++++
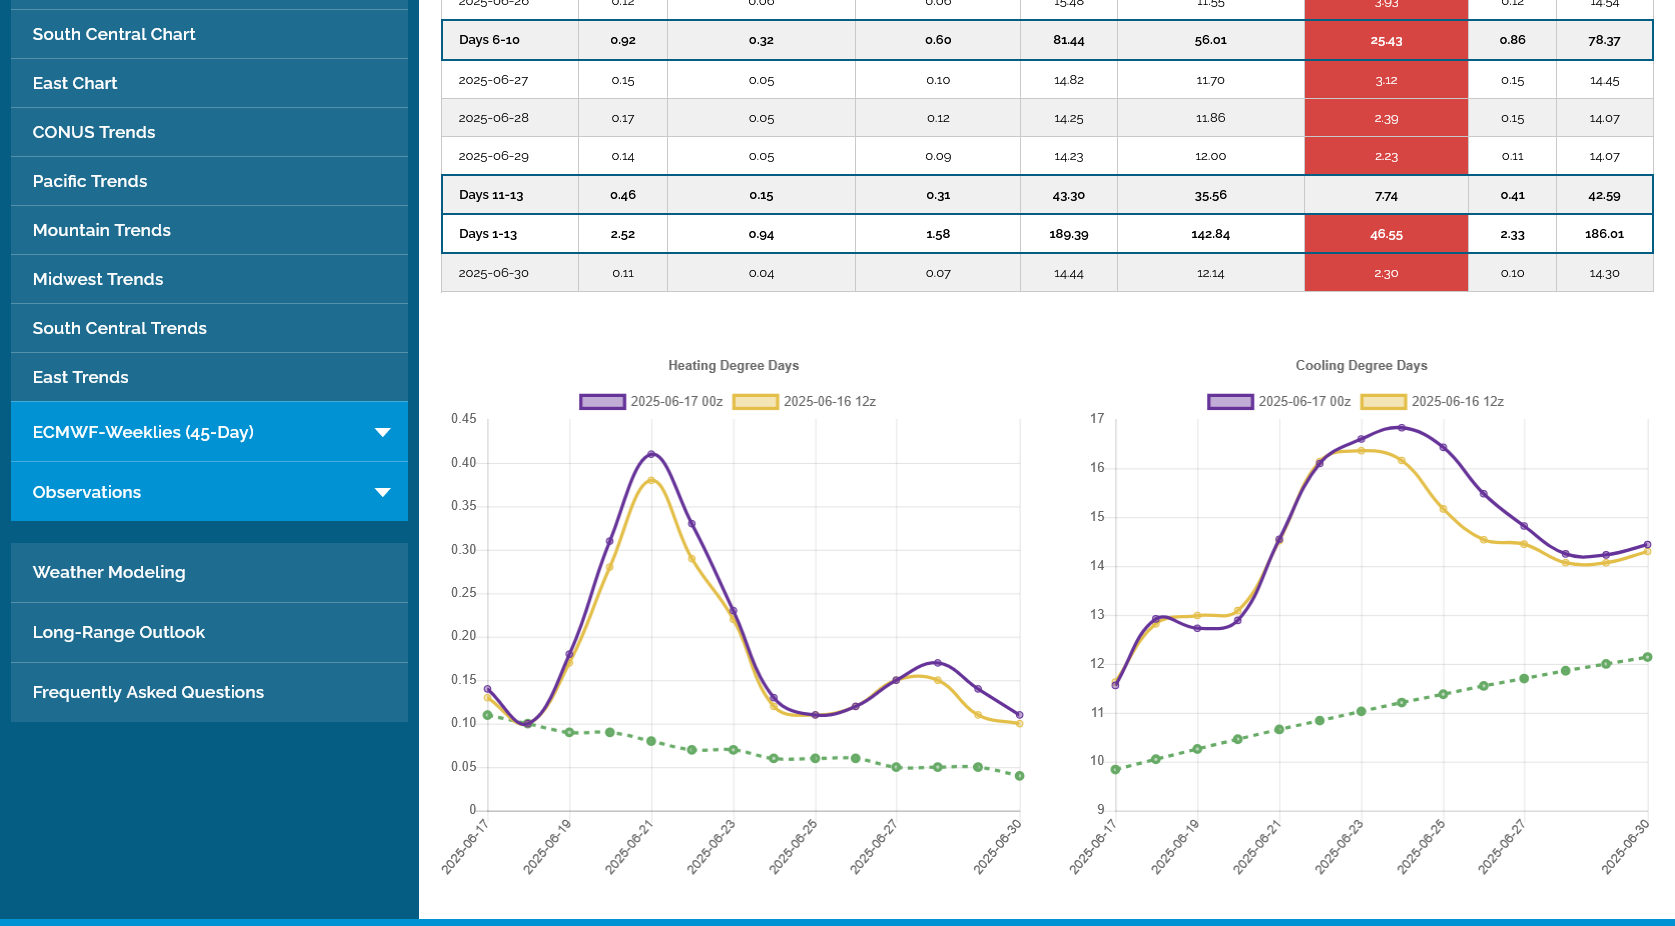
Heat wave coming, June 17+ 2025
The 0z European Ensemble model was a whopping -4 CDDs vs the previous 12z run and we dropped to the lows for several hours before the market discarded that and focused back on this upcoming intense heat wave.
Heat wave coming, June 17+ 2025
Started by metmike - June 17, 2025, 4:02 p.m.
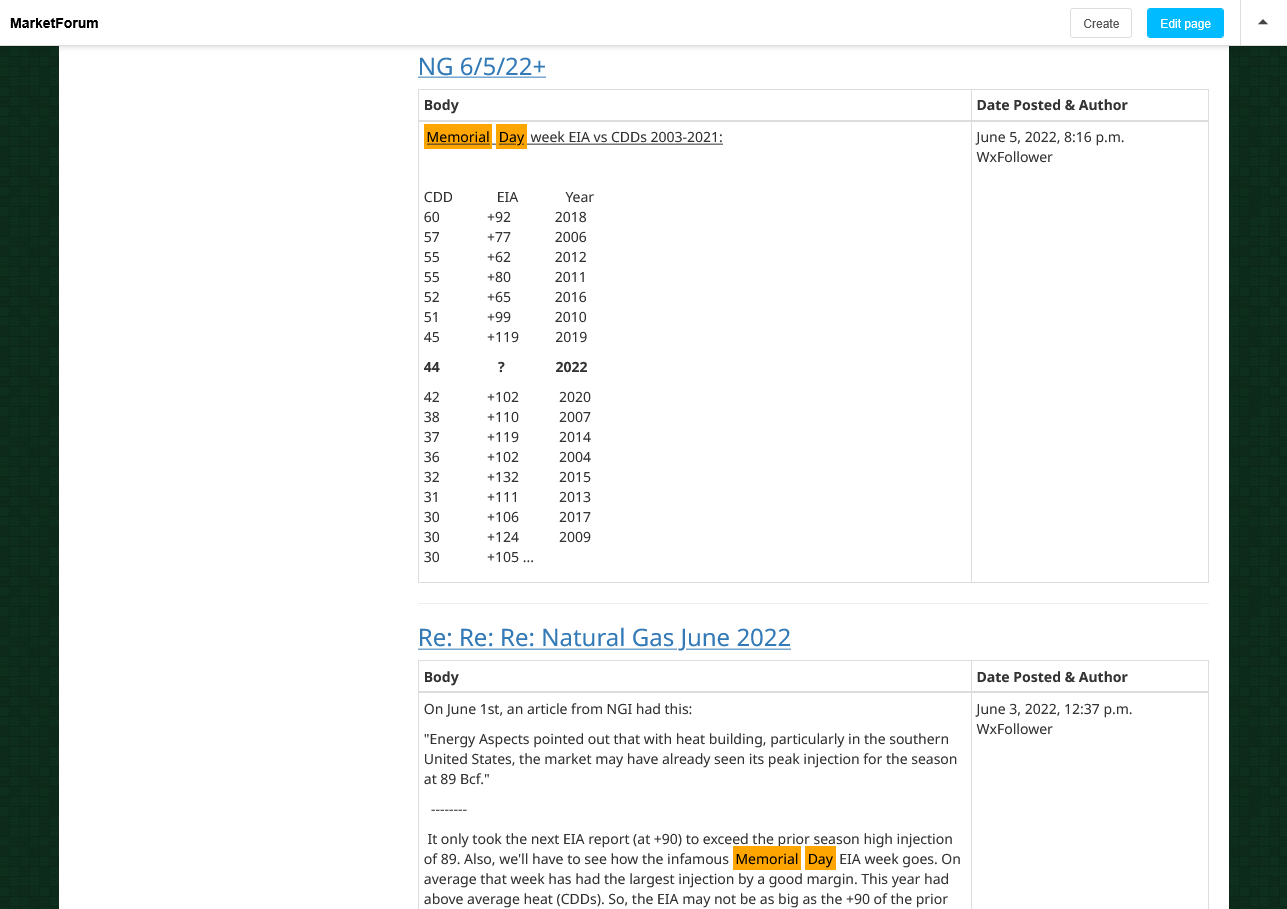
I was caught off guard, not expecting the EIA report a day early because of the Juneteenth holiday tomorrow. Note the blue line on the graph below for current storage continues to gain vs the 5 year average and move upwards in the 5 year range/gray shade. Going from near the bottom of the range after a very cold Winter to the top 1/3rd of the range.
When the widespread, intense heat hits it will massively increase demand for ng for burning to generate electricity for AC use.
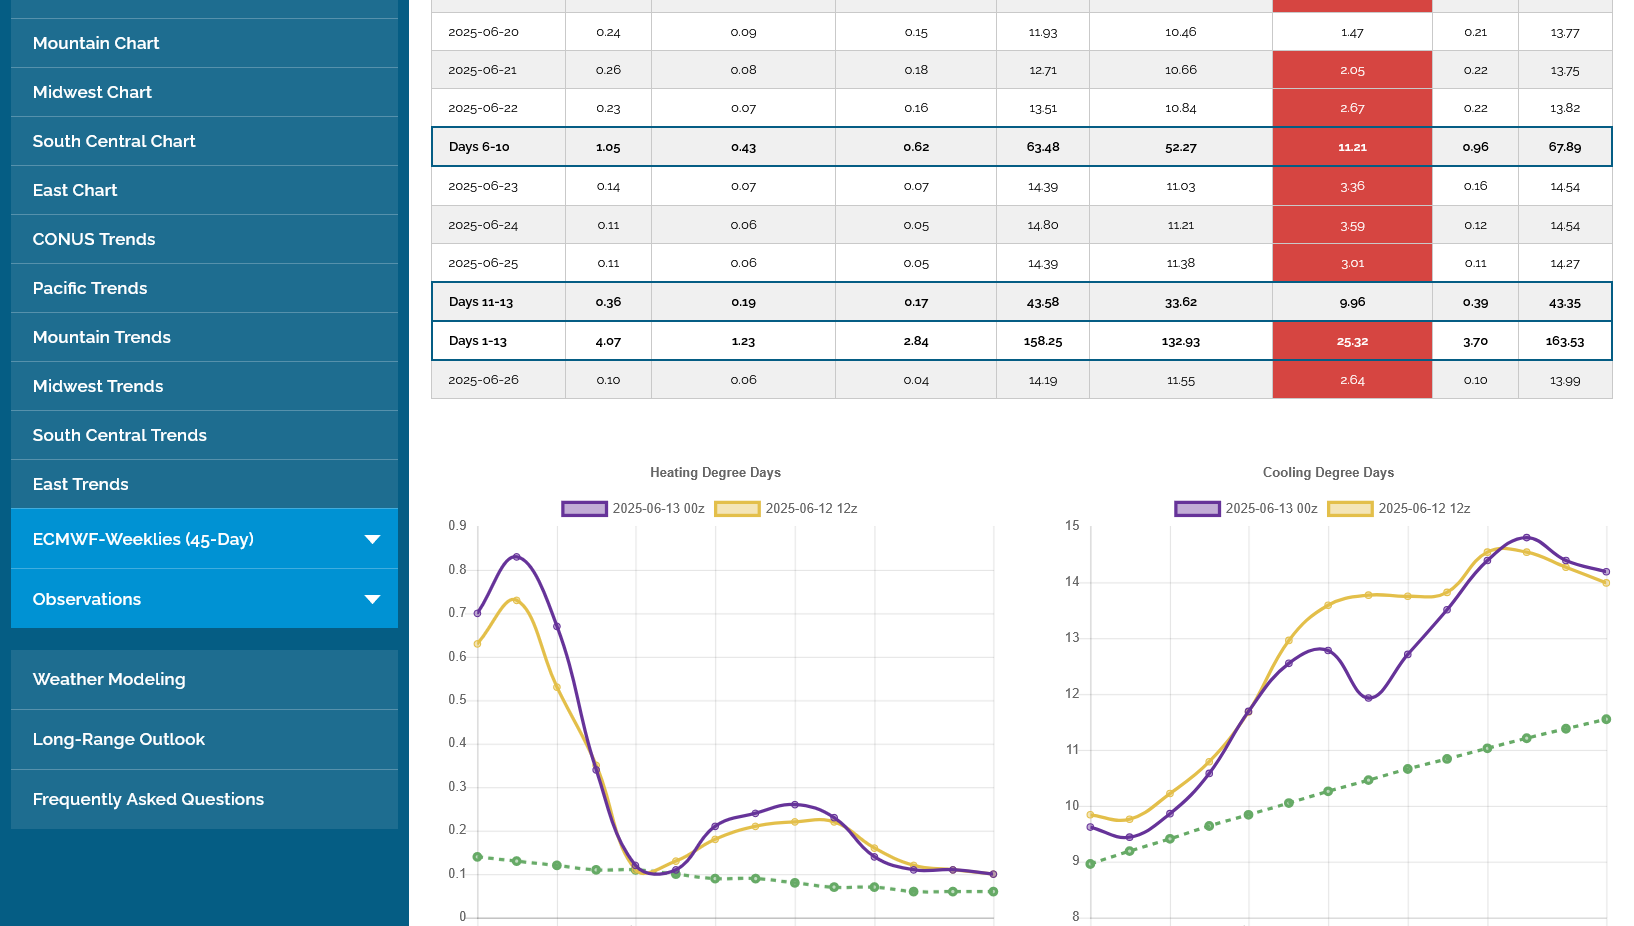
This will not be shown much yet in next Thursday's EIA(CDDS thru tomorrow). However the one 2 weeks from tomorrow will be VERY BULLISH. This is what the market has been trading the last 10 days!
![]()
for week ending June 13, 2025 | Released: June 18, 2025 at 12:00 p.m. | Next Release: June 26, 2025
| Working gas in underground storage, Lower 48 states Summary text CSV JSN | |||||||||||||||||||||||||
|---|---|---|---|---|---|---|---|---|---|---|---|---|---|---|---|---|---|---|---|---|---|---|---|---|---|
| Historical Comparisons | |||||||||||||||||||||||||
| Stocks billion cubic feet (Bcf) | Year ago (06/13/24) | 5-year average (2020-24) | |||||||||||||||||||||||
| Region | 06/13/25 | 06/06/25 | net change | implied flow | Bcf | % change | Bcf | % change | |||||||||||||||||
| East | 563 | 531 | 32 | 32 | 627 | -10.2 | 538 | 4.6 | |||||||||||||||||
| Midwest | 638 | 608 | 30 | 30 | 733 | -13.0 | 628 | 1.6 | |||||||||||||||||
| Mountain | 216 | 210 | 6 | 6 | 229 | -5.7 | 166 | 30.1 | |||||||||||||||||
| Pacific | 274 | 266 | 8 | 8 | 279 | -1.8 | 243 | 12.8 | |||||||||||||||||
| South Central | 1,111 | 1,091 | 20 | 20 | 1,167 | -4.8 | 1,065 | 4.3 | |||||||||||||||||
| Salt | 350 | 351 | -1 | -1 | 337 | 3.9 | 314 | 11.5 | |||||||||||||||||
| Nonsalt | 761 | 740 | 21 | 21 | 830 | -8.3 | 750 | 1.5 | |||||||||||||||||
| Total | 2,802 | 2,707 | 95 | 95 | 3,035 | -7.7 | 2,640 | 6.1 | |||||||||||||||||
| Totals may not equal sum of components because of independent rounding. | |||||||||||||||||||||||||
Working gas in storage was 2,802 Bcf as of Friday, June 13, 2025, according to EIA estimates. This represents a net increase of 95 Bcf from the previous week. Stocks were 233 Bcf less than last year at this time and 162 Bcf above the five-year average of 2,640 Bcf. At 2,802 Bcf, total working gas is within the five-year historical range.
For information on sampling error in this report, see Estimated Measures of Sampling Variability table below.
Note: The shaded area indicates the range between the historical minimum and maximum values for the weekly series from 2020 through 2024. The dashed vertical lines indicate current and year-ago weekly periods.
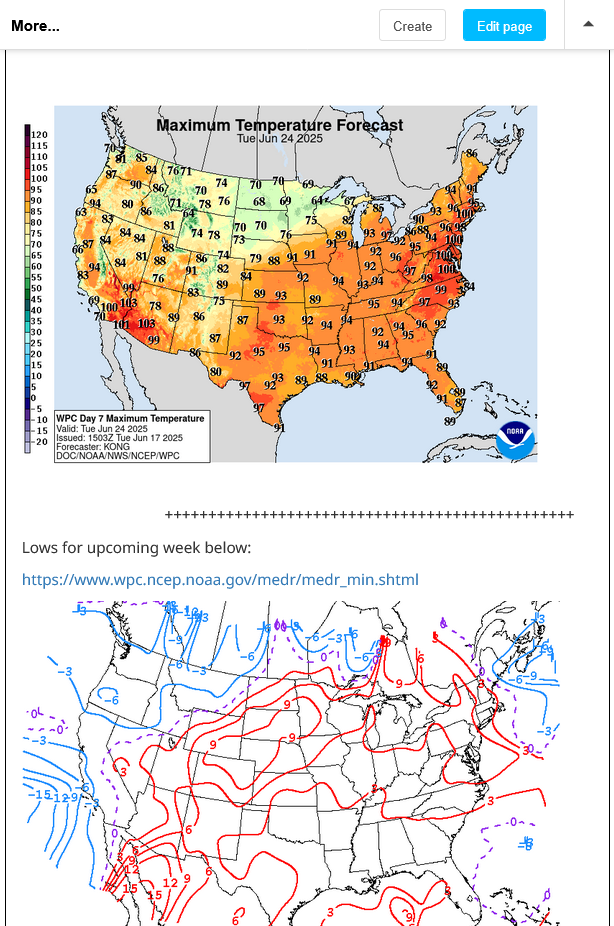
The 6z GEFS was just a bit warmer(purple on the right) but its release coincided exactly with ng finally breaking out above 4.0 after banging up against this MAJOR resistance numerous times the previous 24 hours.
Then, we went straight up to 4.1, probably some from traders covering shorts and crying uncle(buy stops included), some from traders seeing the upside break out formation.
The bottom line is that the intense heat wave is still coming, getting closer and not completely dialed in and we are still adding an additional day of heat at the end of the updated forecast every new day.
https://tradingeconomics.com/commodity/natural-gas
1. 1 day-huge break out above $4 just after the 6z GEFS came out.
2. 1 year-4.5-mega resistance was the March high after the cold Winter and huge drawdown in storage. Market has been moving upwards from $3 since this pattern change to MUCH HOTTER started showing up weeks ago.
3. 10 years-uptrend is still valid-will this be a bull flag? Hard to imagine prices getting above $5 with the current fundamentals and storage level but hot weather all Summer could erode storage and become even MORE bullish. My guess is that at some impossible to guess point, the market will have a violent downside correction.
The 12z Euro Ensemble was a whopping +4 CDDs vs the prior 0z run. That’s a lot to add to a heat wave as we approach the hottest time of year(in 1 month)!
The incredible surge higher for natural gas continues. The last 0z EE was a bit hotter.
I will guess that at some point in the next couple of days natural gas will have an enormous downside correction at an impossible to predict time that could come any moment.
However, until the upside break away gap higher from Sunday Night is filled, that strong bullish signal is still in effect.
The week 3 and beyond forecasts remain hot but not AS hot thru the month of July. If this verifies, the storage reports that have added to a surplus vs previous years for 2 months(because of cool weather) will erode significantly.
The first REALLY bullish storage report will be the one in 13 days, which will incorporate the data from this upcoming heat wave.
The market, however has been trading this weather since early June and has come incredibly far from $3 to over $4.` right now. This is +11,000/contract. I would like to say that I was long most of that time but, no that's not been the case.
I will guess that at some point in the next couple of days natural gas will have an enormous downside correction at an impossible to predict time that could come any moment.
Just minutes after stating that in the previous post.................it happened!
https://tradingeconomics.com/commodity/natural-gas
1. 1 day HUGE reversal lower earlier this morning
2. 1 month
3. 1 year
++++++++++++++
MidDay Price Alert Markets Report Natural Gas Prices
A week-long rally for July natural gas futures had reversed course as of midday Friday, as traders took profits amid a volatile session.
++++++++++++++++++++
The highs in natural gas might be in for now. Today's huge reversal down from the spike highs and sharply lower close are a very bearish chart signature.
The upcoming extreme heat was completely dialed in +tons more as ng always OVER reacts. It was impossible to know when the exact day or hour was going to be for the extreme buying to be exhausted (much of it probably from shorts covering/crying uncle).
A very hot July can drain storage enough to attract more aggressive buying again at some point. There is major technical damage to the bulls today but the gap higher from Sunday Night is still an upside break out formation that is still valid.
After gaining ground in four previous sessions, July Nymex natural gas futures settled lower on Friday as market participants took profits and looked to somewhat milder weather beyond an imminent heat wave in the first week of summer.
++++++++++++++=
The highs are likely in without the forecasts getting even hotter moving forward. It was impossible for me to know the timing of the exact high for this incredible move higher would be. I was tempted to short at $4 last week but that proved only to be temporary resistance. Then $4.1 but we bested that with no signs of dropping. Then early on Friday morning the buying had been completely exhausted and there were no more aggressive buyers left in the market to buy at these extremely elevated prices.
So the market had to drop to attract additional buying to match the sellers. Then, unlike the last several weeks, fresh buying DID NOT emerge at lower prices from traders buying from the approach of the heat wave, which had already begun and the market turned into a BUY THE RUMOR, SELL THE FACT MARKET!!!!
NG, all day long was unable to find new buyers (buying had been exhausted from long known heat wave) unless the price dropped lower. Over and over the price had to drop lower and lower to find enough buyers to match up with the selling which was increased because of the reversal down at a major top technical formation.
The longevity of the straight up move(+$11,000) without a correction meant the reversal down was going to be an extreme one.
Now we see if the gap higher last Sunday evening(6 days ago) can be filled.
If we have a gap lower on the open tomorrow evening(Sunday) this will serve as a very powerful downside breakaway gap because it's at the top of a long lived move up.
The bulls will be hoping for much more heat to be added to the forecast again which is their biggest hope here.
There is the chance that this is just a quick, overdue correction down that holds at some point if the rest of the Summer features storage deficits from low injections vs previous years because of extreme demand for residential cooling that chews up natural gas needed(burned) to generate electricity.
1. Here's the weekly chart to go with the charts above
2. Monthly again. It will be very tough to negate this significant top signature.
https://tradingeconomics.com/commodity/natural-gas
I WOULD HAVE guessed a gap lower on the open for ng tonight but the Iran situation throws a potential bullish wildcard into the equation.
Trading right now carries unusually elevated risk because of the potential for surprise news related to the Iran bombings to impact prices.
This was the last 12z EE in purple on the right. -4 CDDs vs the previous 0z run from 12 hours earlier.
NG opened around $1,000/contract but sold off half of those gains.
Less heat in the forecast continues to pressure natural gas since the open last night.
Natural gas futures treaded lightly early Monday, trading in a narrow range in the wake of U.S. attacks on Iran’s nuclear facilities and amid a surge in Lower 48 cooling demand.
+++++++++++++=
NO! It's less heat in the forecast that caused ng to go from an open of +1,000 to currently -1,222!
The slightly hotter 0z EE in purple on the right caused a tiny bounce very early this morning but we should note the TREND of every line on this and other CDD graphs...........DOWNWARD! At a time when the green line(climatological average) is going up. As a result, the differential (amount above average) is SHRINKING .
There were the last 4 GEFS runs. Note the red, last nights 18z run was much hotter than the rest and helped keep natural gas supported on Sunday Evening. Purple was the last one.
Note that like the CDD lines above, they are CONVERGING with the average. Getting closer to it. Even when they are flat/steady, the green/average line is coming up to meet the CDD lines.
By far, this week has the greatest/most extreme positive CDD/heat anomalies. This has been known and traded all month. On Friday, this became a "buy the rumor-sell the fact" market.
In its penultimate session as the lead contract, July natural gas futures spent a third day in retreat despite blazing heat and ongoing Middle East tensions, as a ceasefire between Israel and Iran was on shaky ground.
++++++++++++
The main reason was LESS heat in the forecast and HOT near term days being replaced by LESS hot days at the end of the forecast.
These were the last CDDs on the right from the GEFS model. The purple on was the last 12z model and the coolest by far in week 2. The gap between the increasing climatological average and the forecast continues to shrink with time, even when the absolute value of the CDDs is steady.
A fourth day of double-digit losses Wednesday continued reversing previous heat wave-driven gains in July Nymex natural gas futures. Light volumes traded as market participants took a breath ahead of Thursday’s expiration and August’s move into the lead position Friday.
+++++++++++
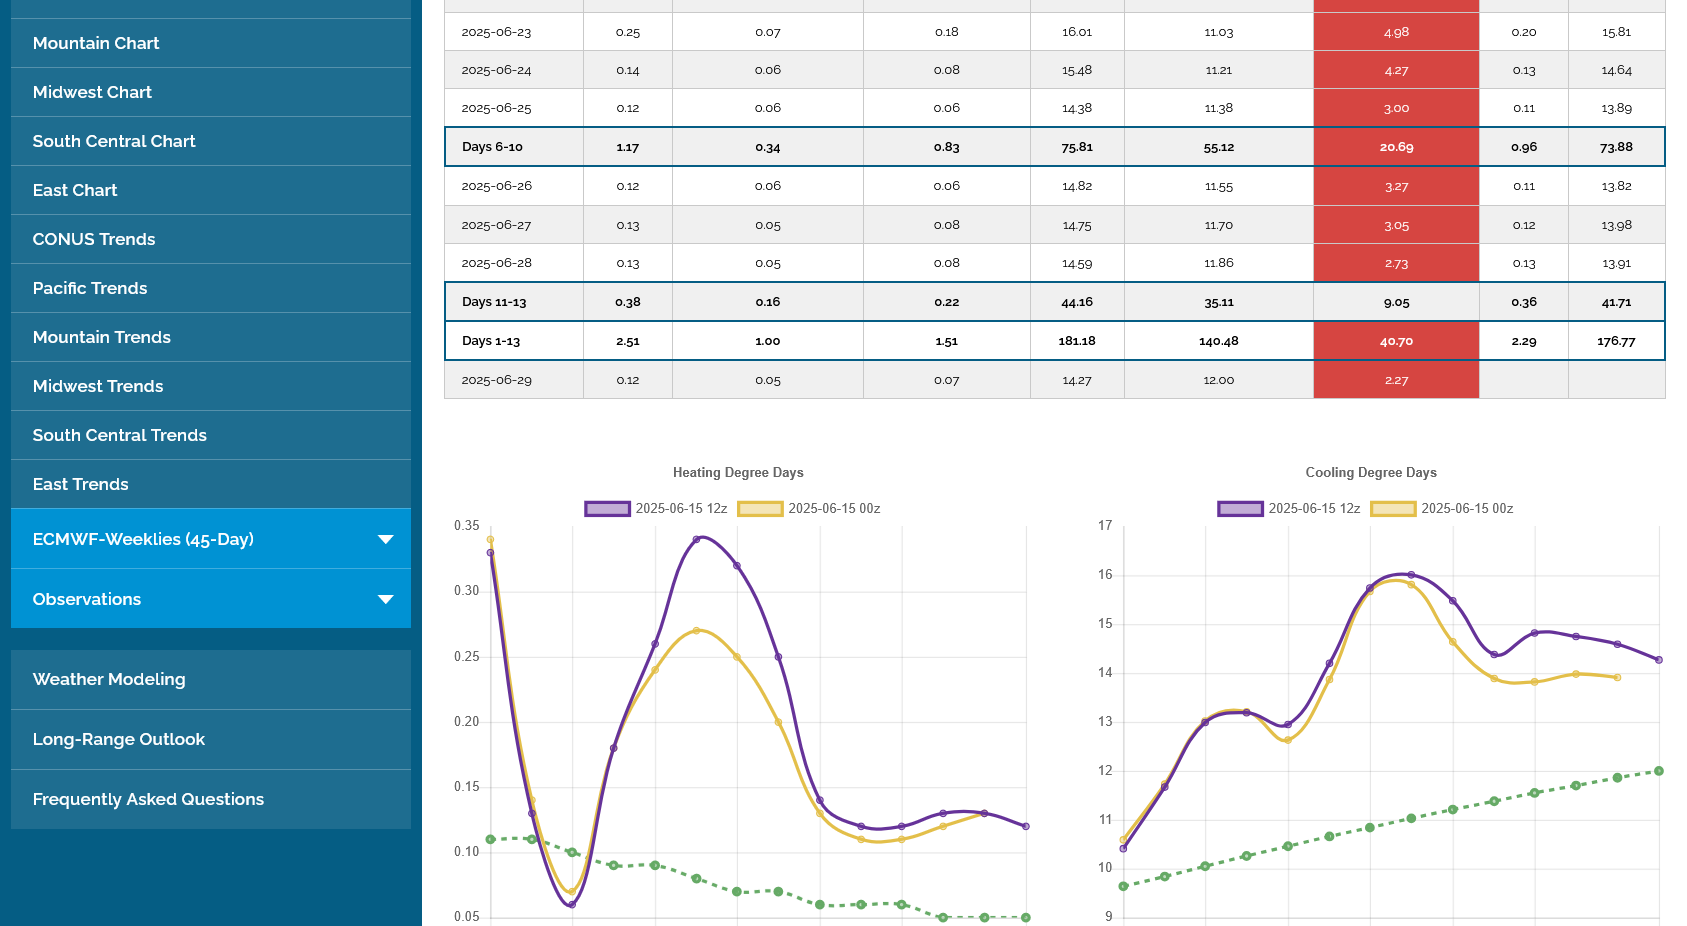
Last 2 runs of the European Ensemble model. A dip in CDDs next week, almost getting down to average, followed by temps heating back up in week 2.
Seasonals turn up again by the 2nd week in July. If the heat starts increasing again, the price of ng could start going back up soon!
https://charts.equityclock.com/natural-gas-futures-ng-seasonal-chart
The 2 months of extremely bearish EIA storage reports are OVER!
The one tomorrow may be a bit bullish vs the estimates below.
However next week's injection will be extremely bullish(but it was dialed in with the spike higher earlier this month).
https://www.cpc.ncep.noaa.gov/products/tanal/temp_analyses.php
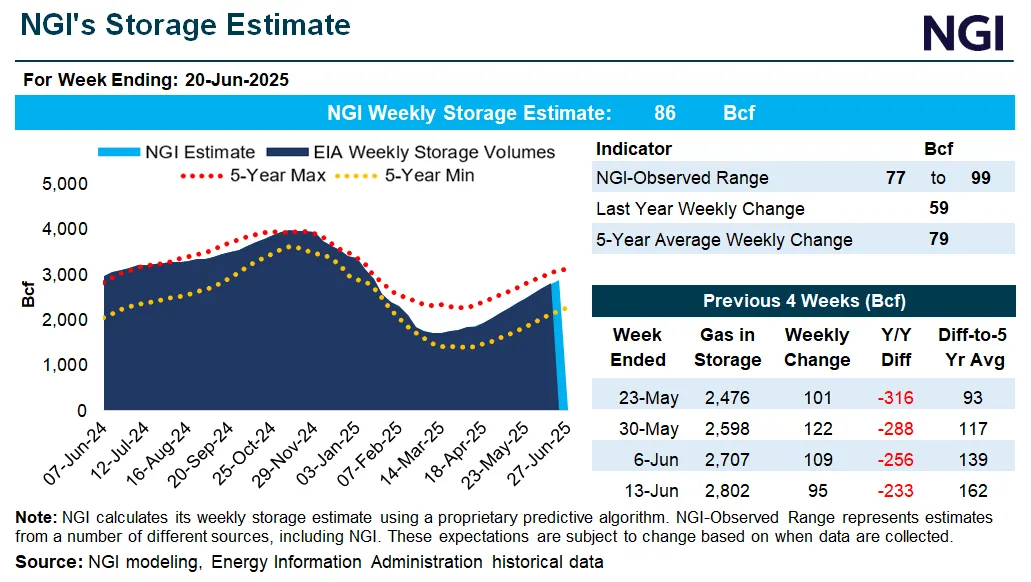
This was BEARISH!!!!!
https://ir.eia.gov/ngs/ngs.html
for week ending June 20, 2025 | Released: June 26, 2025 at 10:30 a.m. | Next Release: July 3, 2025
| Working gas in underground storage, Lower 48 states Summary text CSV JSN | |||||||||||||||||||||||||
|---|---|---|---|---|---|---|---|---|---|---|---|---|---|---|---|---|---|---|---|---|---|---|---|---|---|
| Historical Comparisons | |||||||||||||||||||||||||
| Stocks billion cubic feet (Bcf) | Year ago (06/20/24) | 5-year average (2020-24) | |||||||||||||||||||||||
| Region | 06/20/25 | 06/13/25 | net change | implied flow | Bcf | % change | Bcf | % change | |||||||||||||||||
| East | 589 | 563 | 26 | 26 | 644 | -8.5 | 563 | 4.6 | |||||||||||||||||
| Midwest | 665 | 638 | 27 | 27 | 755 | -11.9 | 654 | 1.7 | |||||||||||||||||
| Mountain | 223 | 216 | 7 | 7 | 235 | -5.1 | 173 | 28.9 | |||||||||||||||||
| Pacific | 281 | 274 | 7 | 7 | 282 | -0.4 | 251 | 12.0 | |||||||||||||||||
| South Central | 1,140 | 1,111 | 29 | 29 | 1,177 | -3.1 | 1,078 | 5.8 | |||||||||||||||||
| Salt | 352 | 350 | 2 | 2 | 334 | 5.4 | 315 | 11.7 | |||||||||||||||||
| Nonsalt | 788 | 761 | 27 | 27 | 843 | -6.5 | 763 | 3.3 | |||||||||||||||||
| Total | 2,898 | 2,802 | 96 | 96 | 3,094 | -6.3 | 2,719 | 6.6 | |||||||||||||||||
| Totals may not equal sum of components because of independent rounding. | |||||||||||||||||||||||||
Working gas in storage was 2,898 Bcf as of Friday, June 20, 2025, according to EIA estimates. This represents a net increase of 96 Bcf from the previous week. Stocks were 196 Bcf less than last year at this time and 179 Bcf above the five-year average of 2,719 Bcf. At 2,898 Bcf, total working gas is within the five-year historical range.
For information on sampling error in this report, see Estimated Measures of Sampling Variability table below.
Note: The shaded area indicates the range between the historical minimum and maximum values for the weekly series from 2020 through 2024. The dashed vertical lines indicate current and year-ago weekly periods.
++++++++++++++
The last 0z European model in blue on the right was -3 CDDs vs the previous 12z run and bearish too.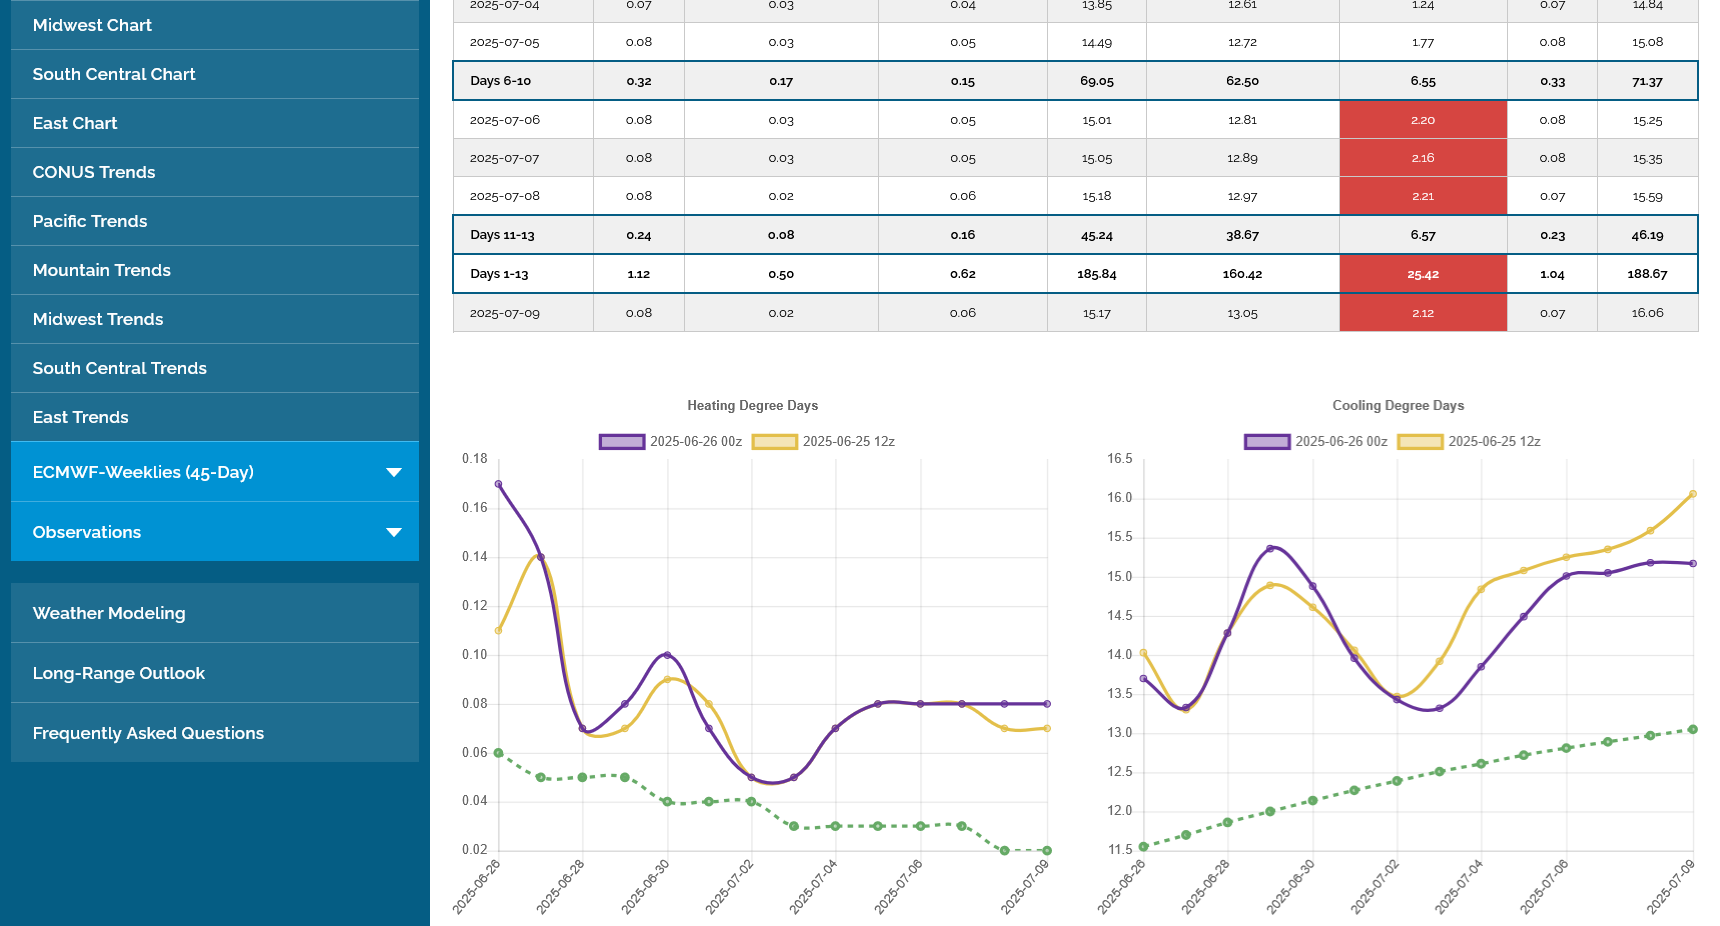
+++++++++++++++++
Natural gas also closed the huge, Sunday, June 1st breakaway gap higher(open 3.501) this week and is sharply lower than the bottom of the gap now.
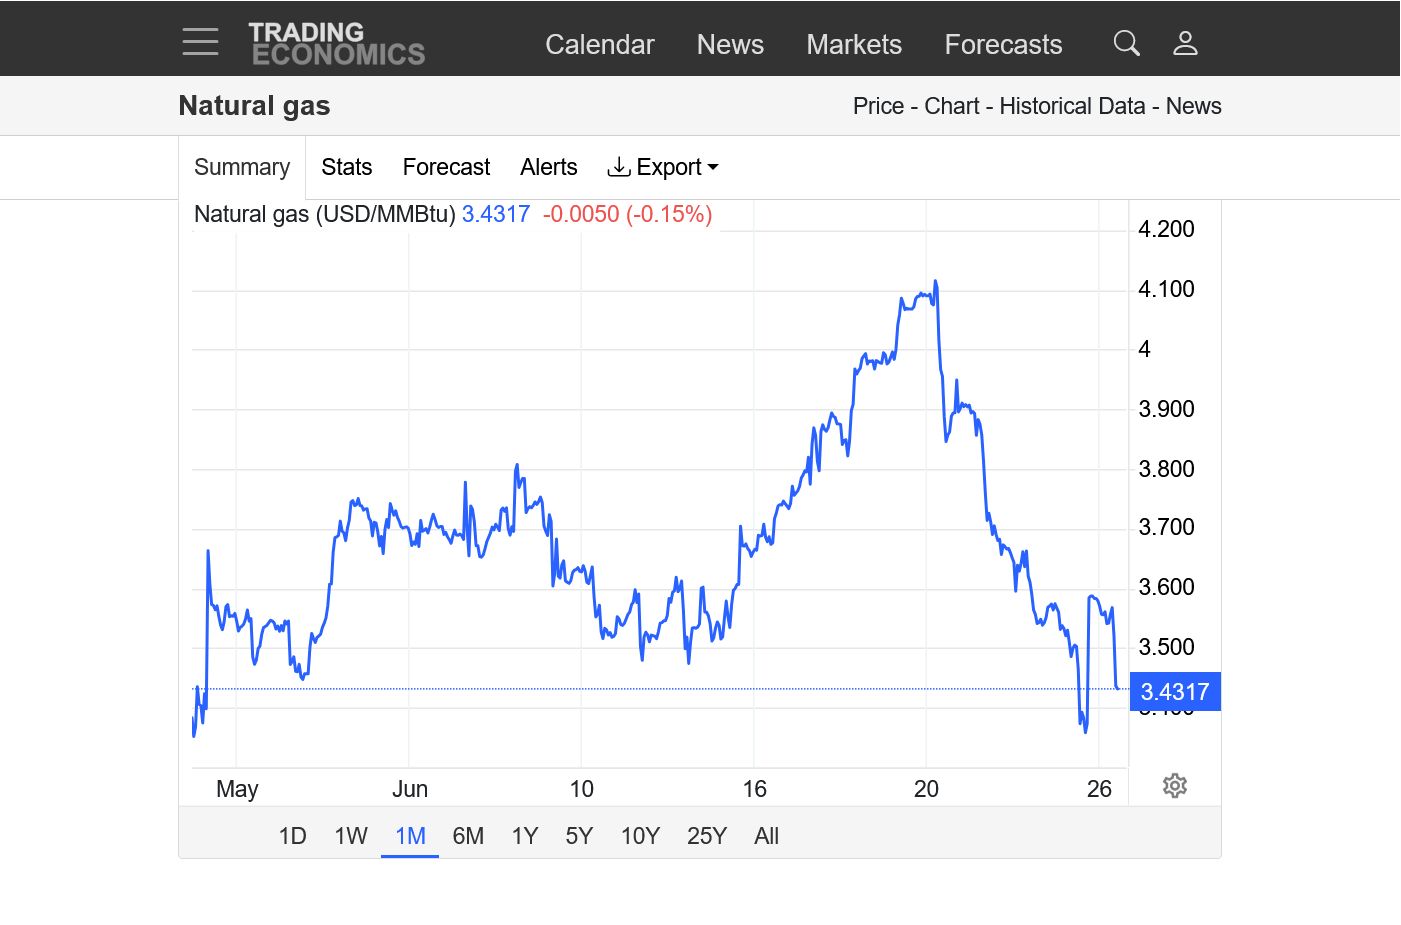
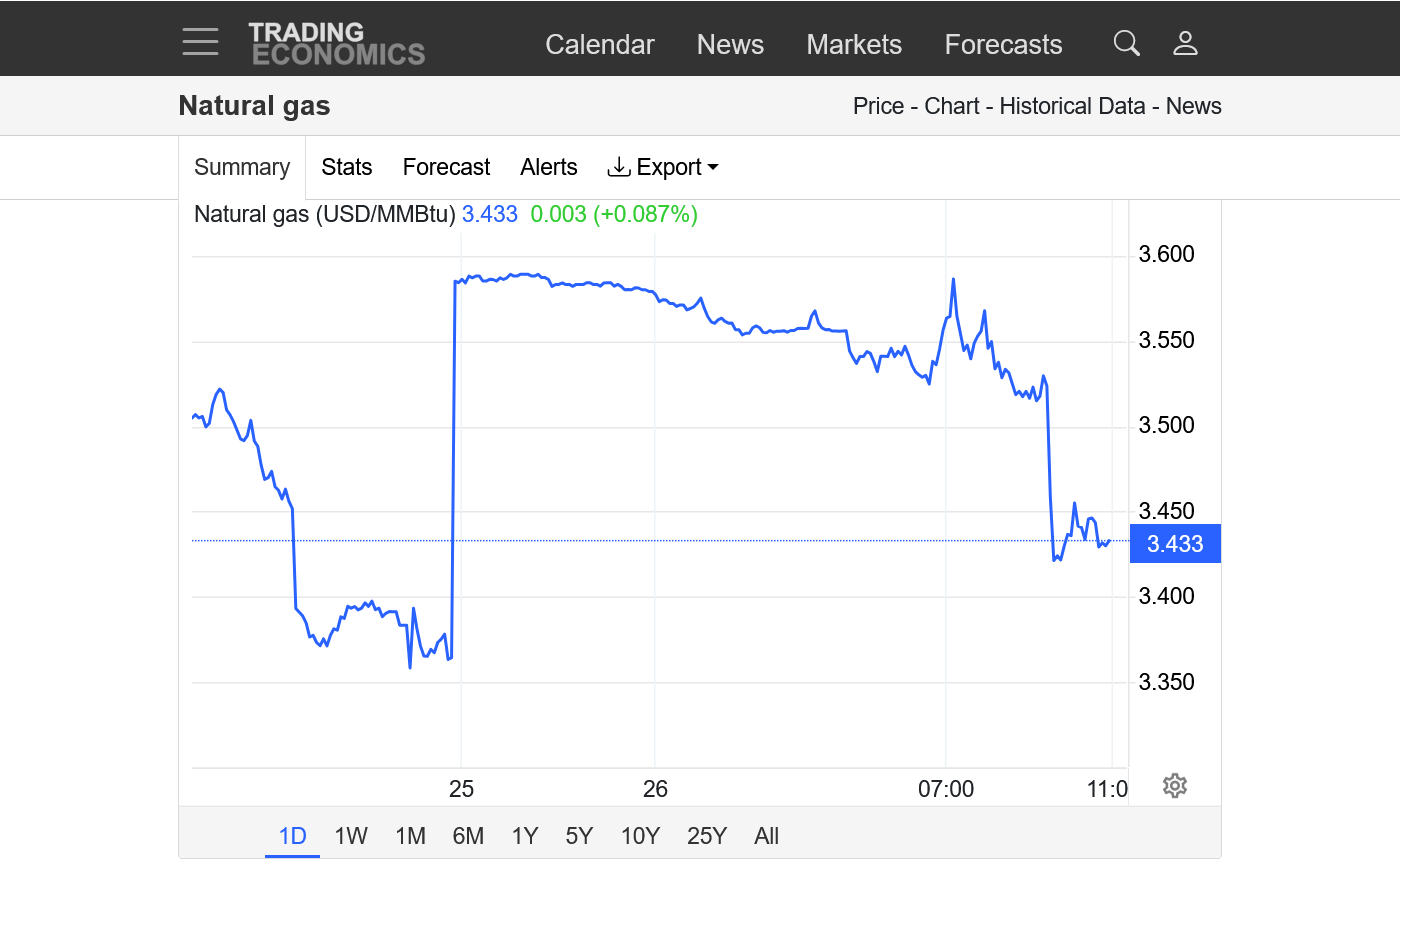
https://tradingeconomics.com/commodity/natural-gas
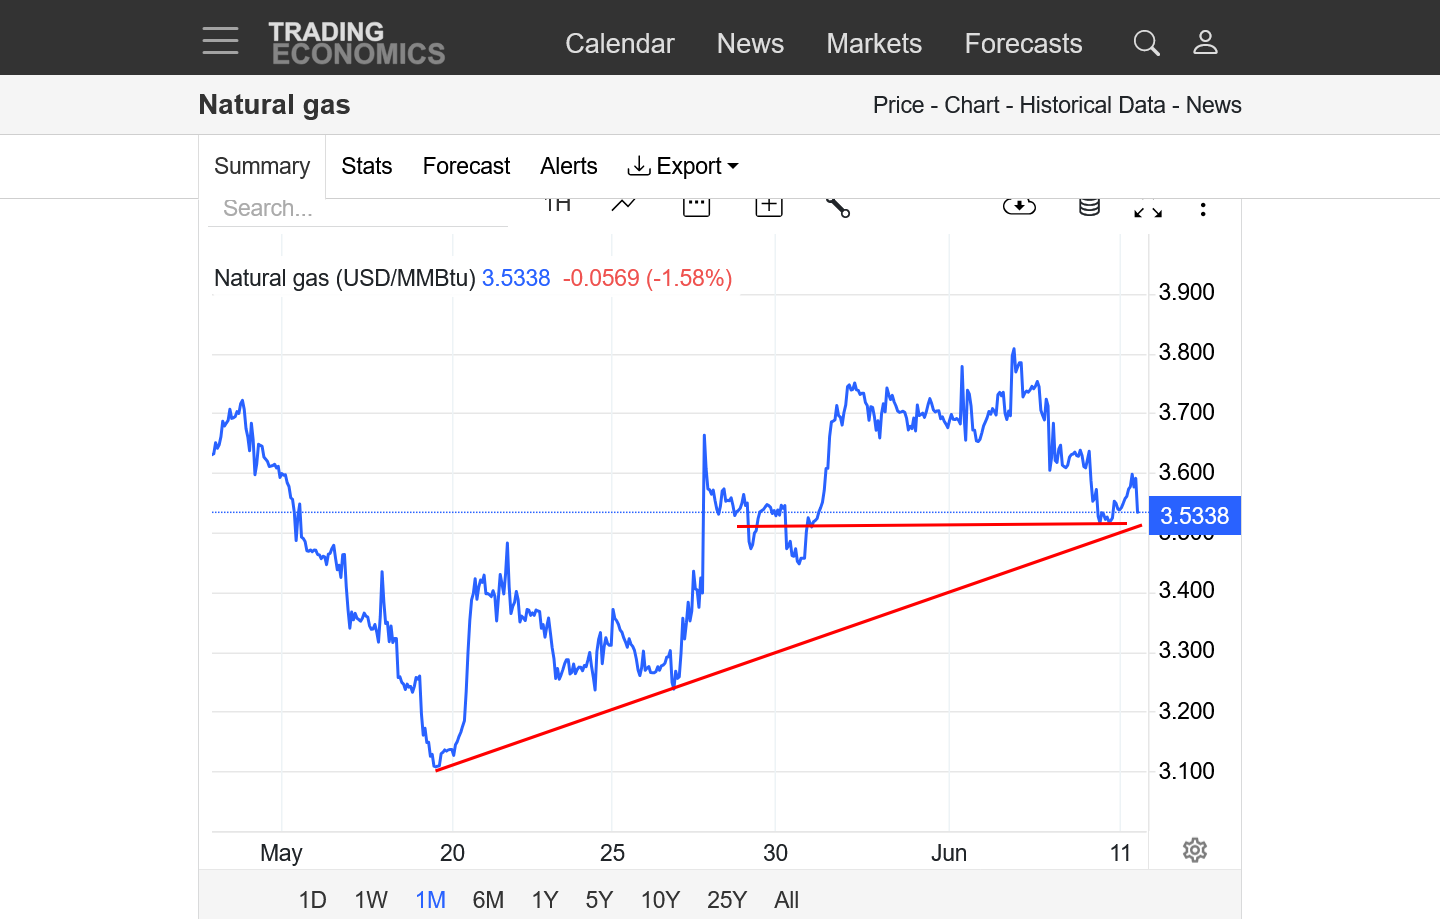
1. 1 month: The blip higher this week was from the July contract(which is currently at 3.24 and $2,000/contract LOWER than the next month, August was replaced by August(trading almost $2,000/contract higher)
So we are actually at close to 3.24 on the July NOT 3.43 for the new month, August below which took over on the graph below when it shows the spike up(that never happened in real price).
Again, the REAL price that goes with this price chart is 3.24 basis July since the entire chart is July contract prices until the very end, after the spike up to August starting with last nights open.
2. 1 day: This shows it extremely well. The price didn't actually do this. We just went from graphing the price of the July contract, to suddenly graphing the price of the August contract. So the REAL price of July is closer to 3.24 and NOT the 3.433 shown on the chart. July expires today.
3. Unfortunately, this is something that happens every month for every commodity (with this product we show here) so it can sometimes lead to price distortions that are misleading vs realities. Regardless, this product is free and I am always transparent using analysis that tries to skillfully identify formations, trends and other useful information to understand those markets.
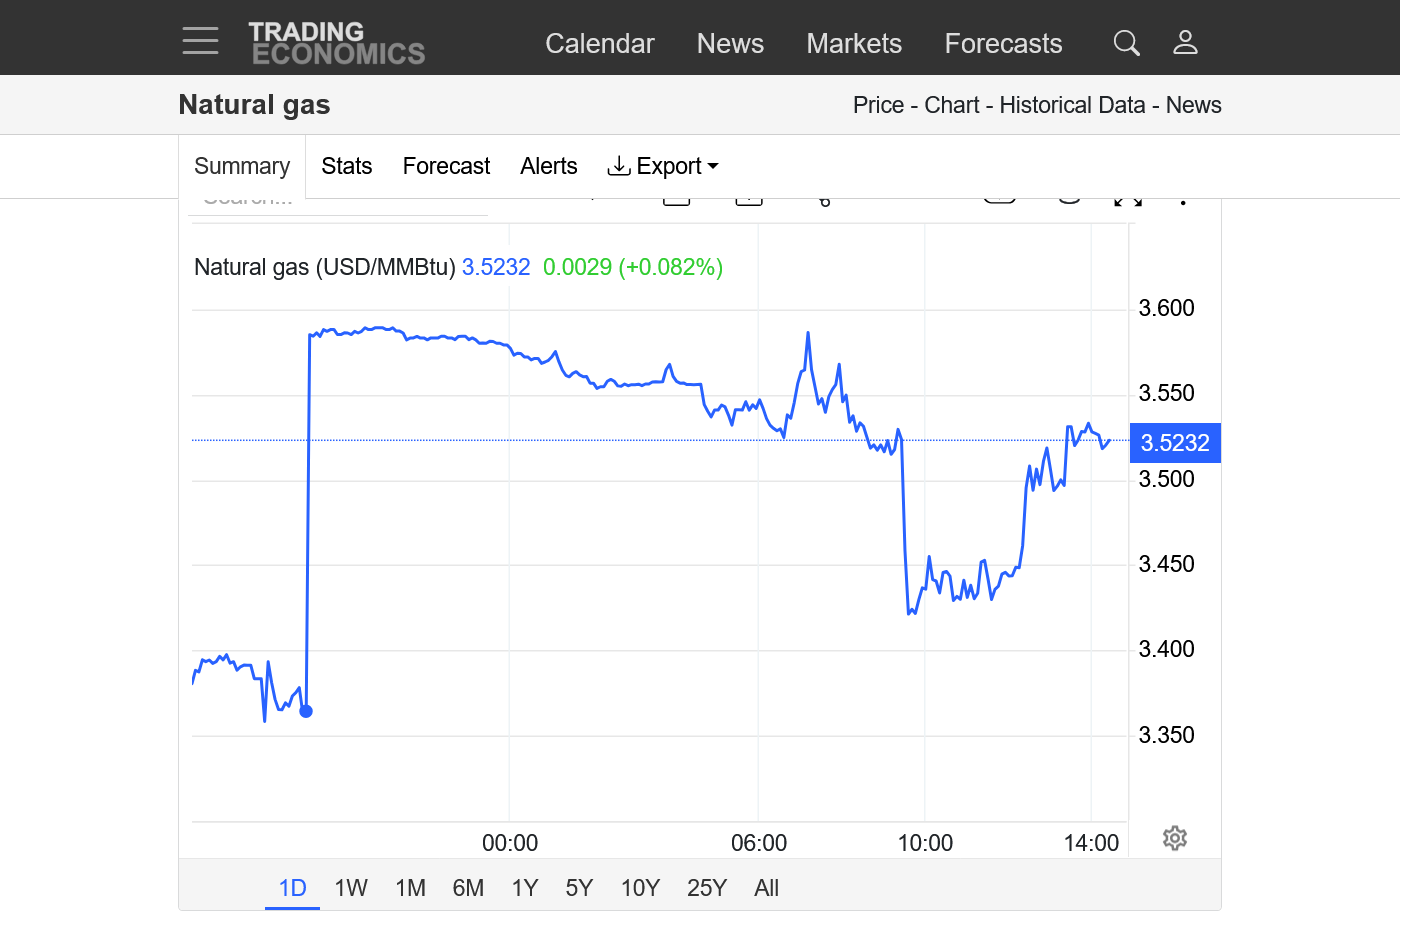
NG bounced back from the BEARISH surprise, larger than expected injection into storage. Now back to the price BEFORE the release.
Next Thursday's report, with 100% certainty will be very BULLISH!. A bullish number that the market started trading on at the start of the month when it gapped higher on June 1st, so its already in the price. But this WILL mark the end of the 10 consecutive weeks of bearish numbers.
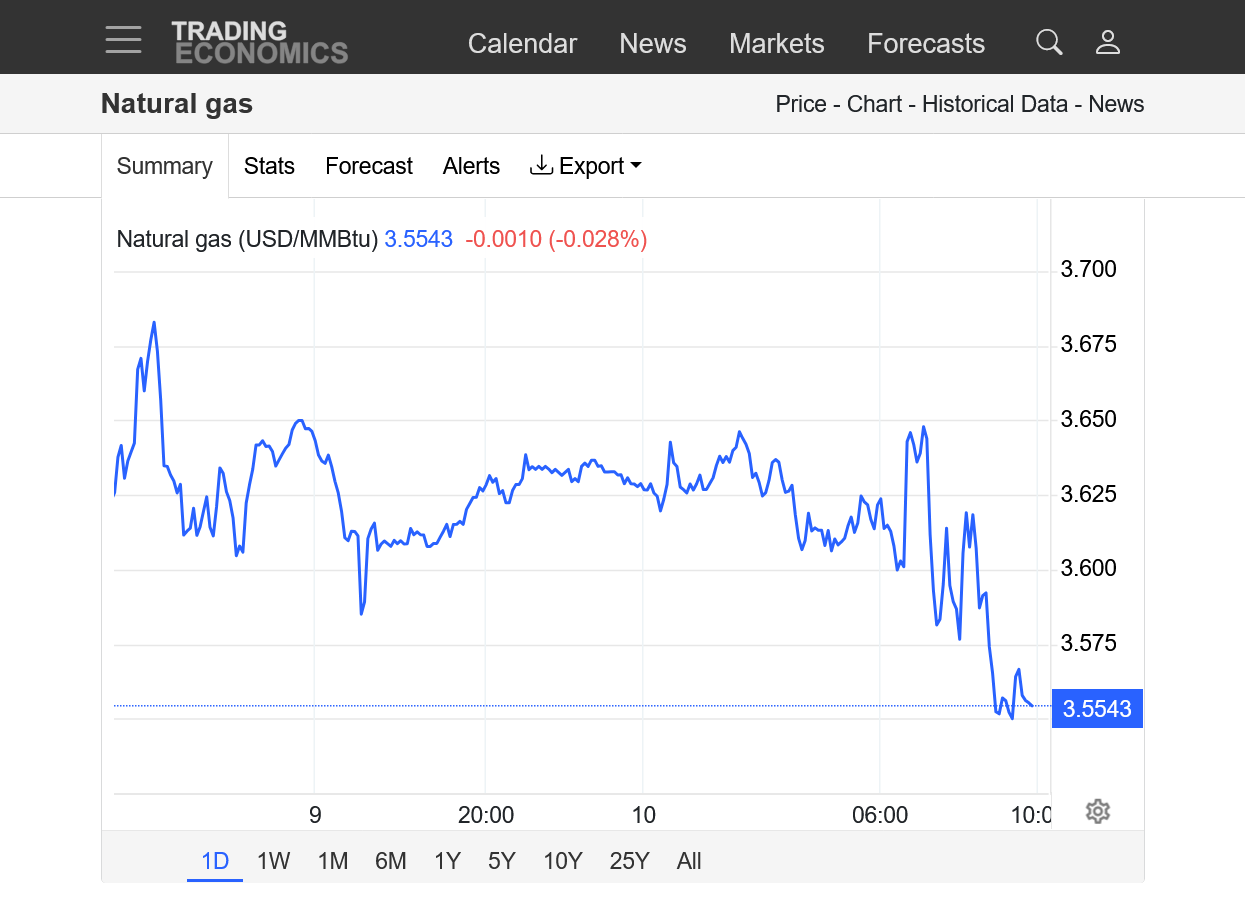
https://tradingeconomics.com/commodity/natural-gas
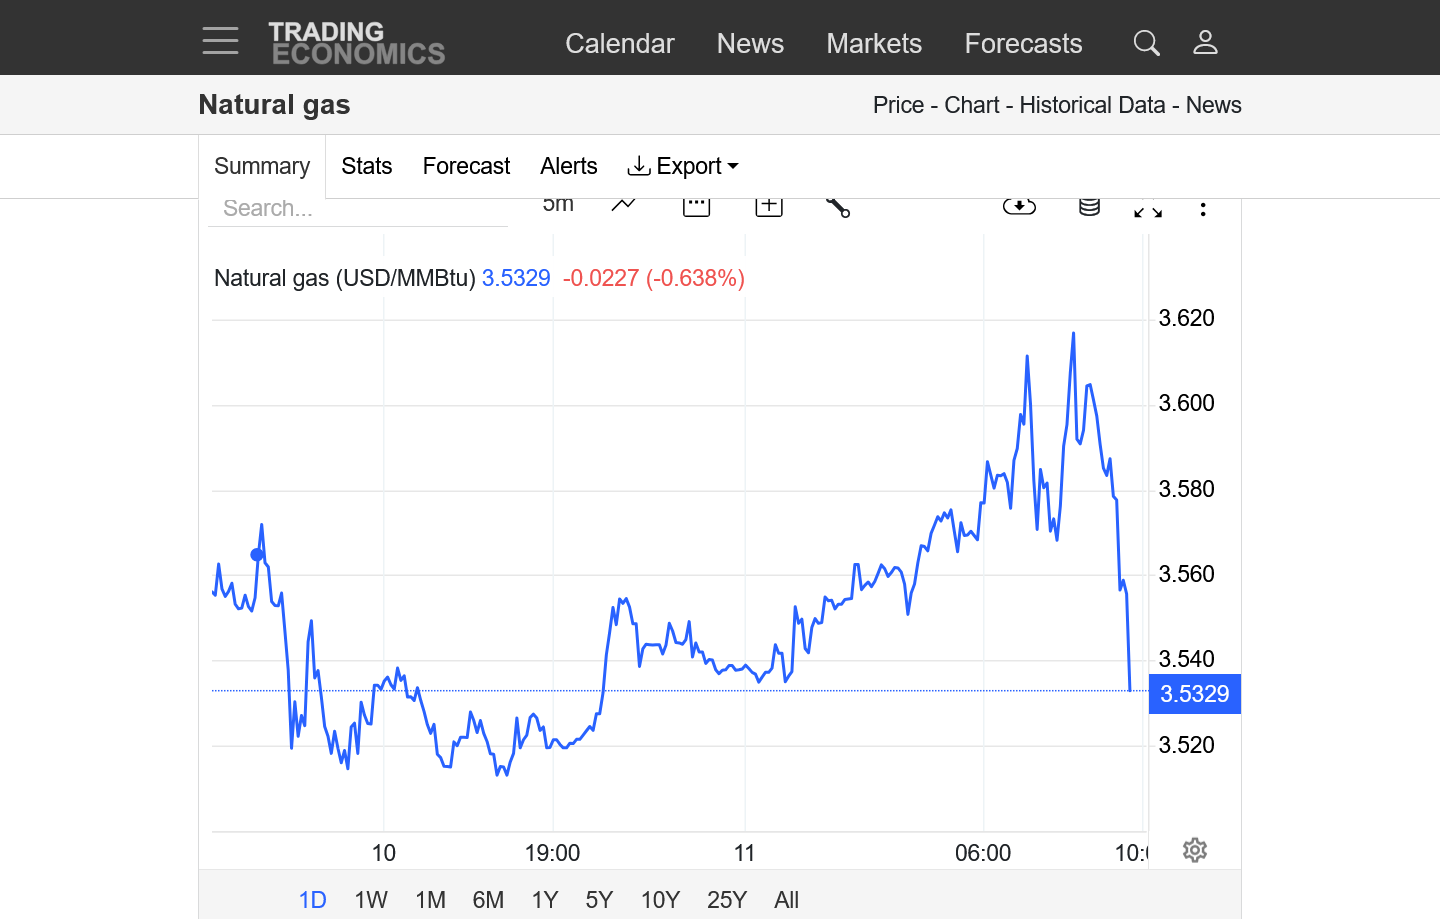
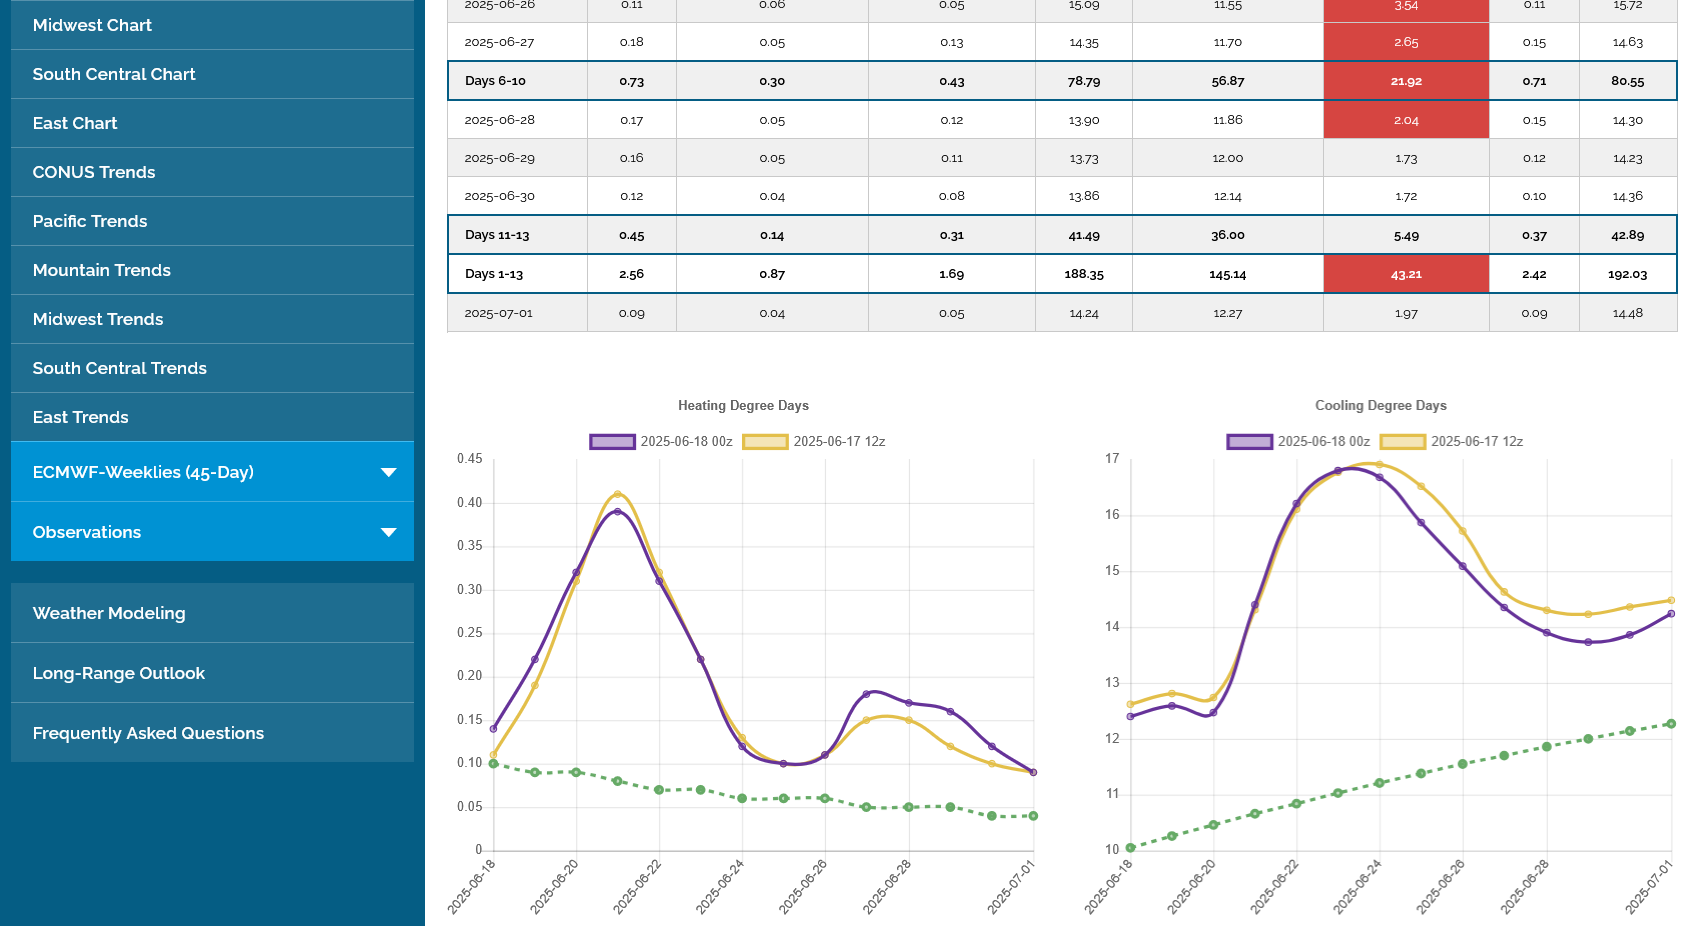
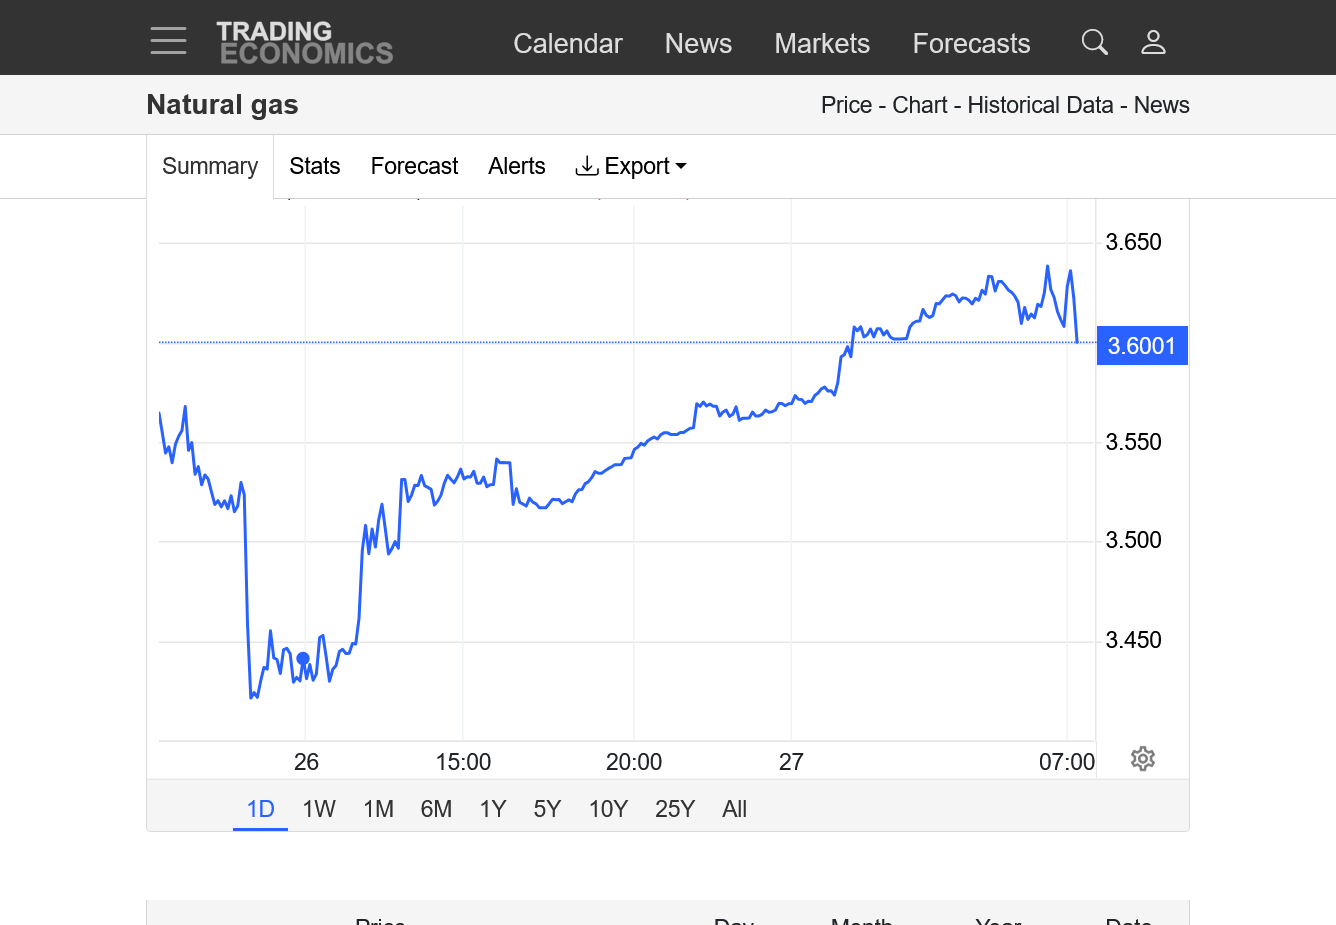
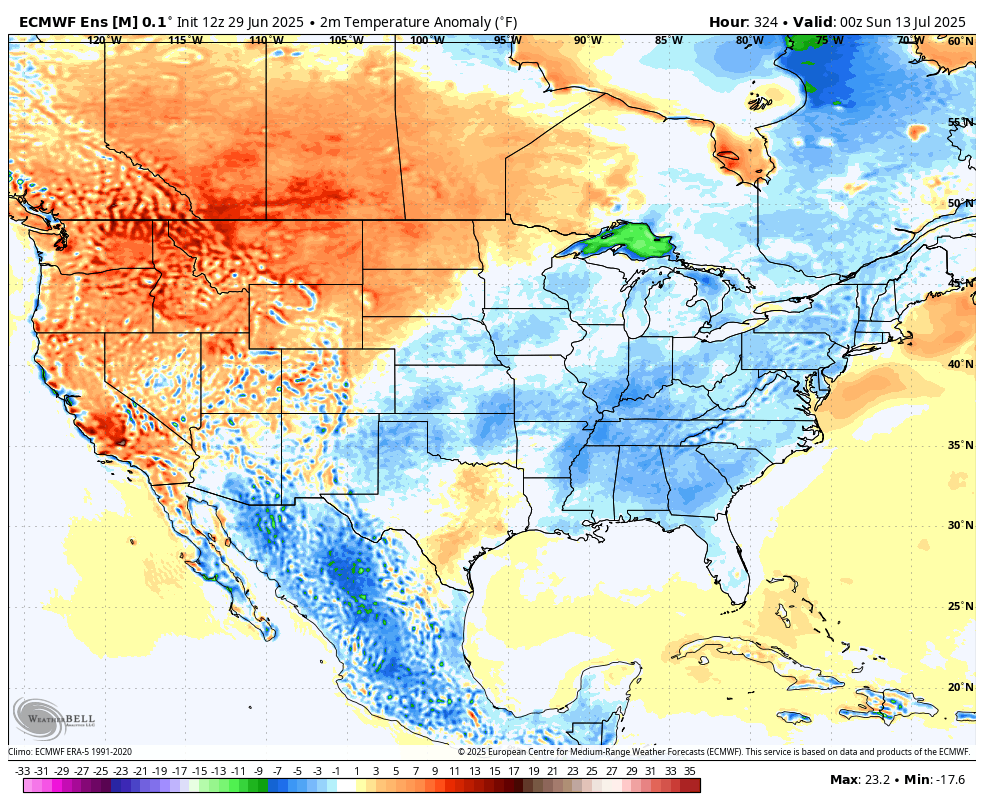
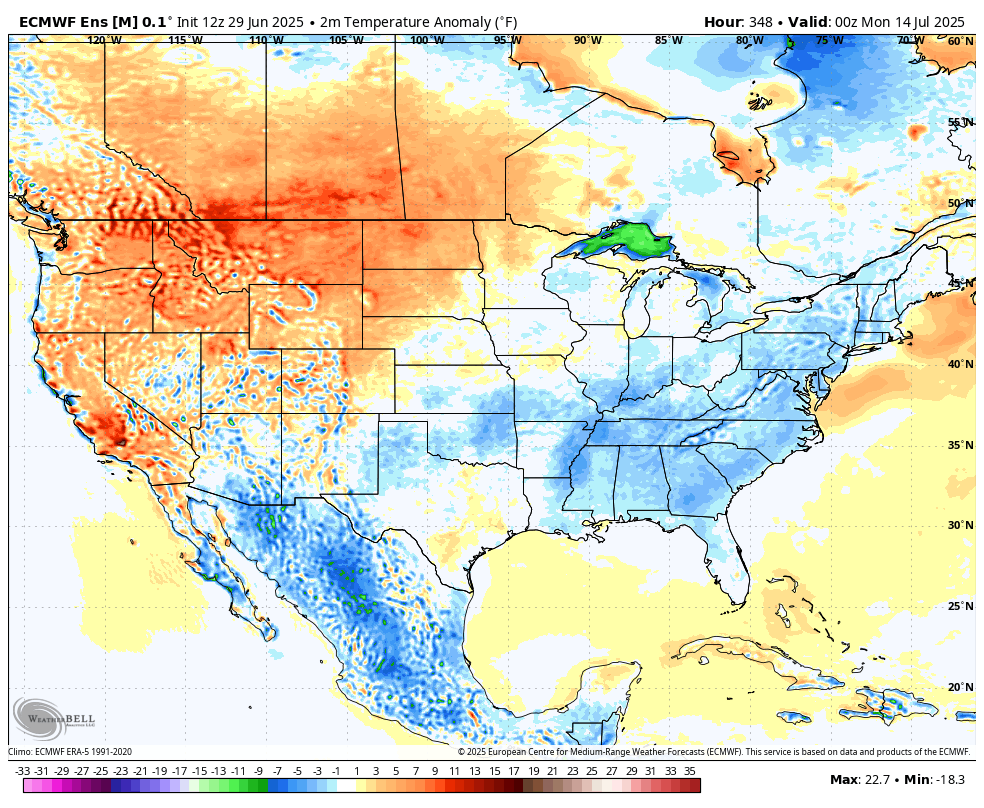
The last 0z European Ensemble model in purple, on the right was a whopping +5.6 CDDs vs the previous 0z run. NG prices have spiked higher overnight.
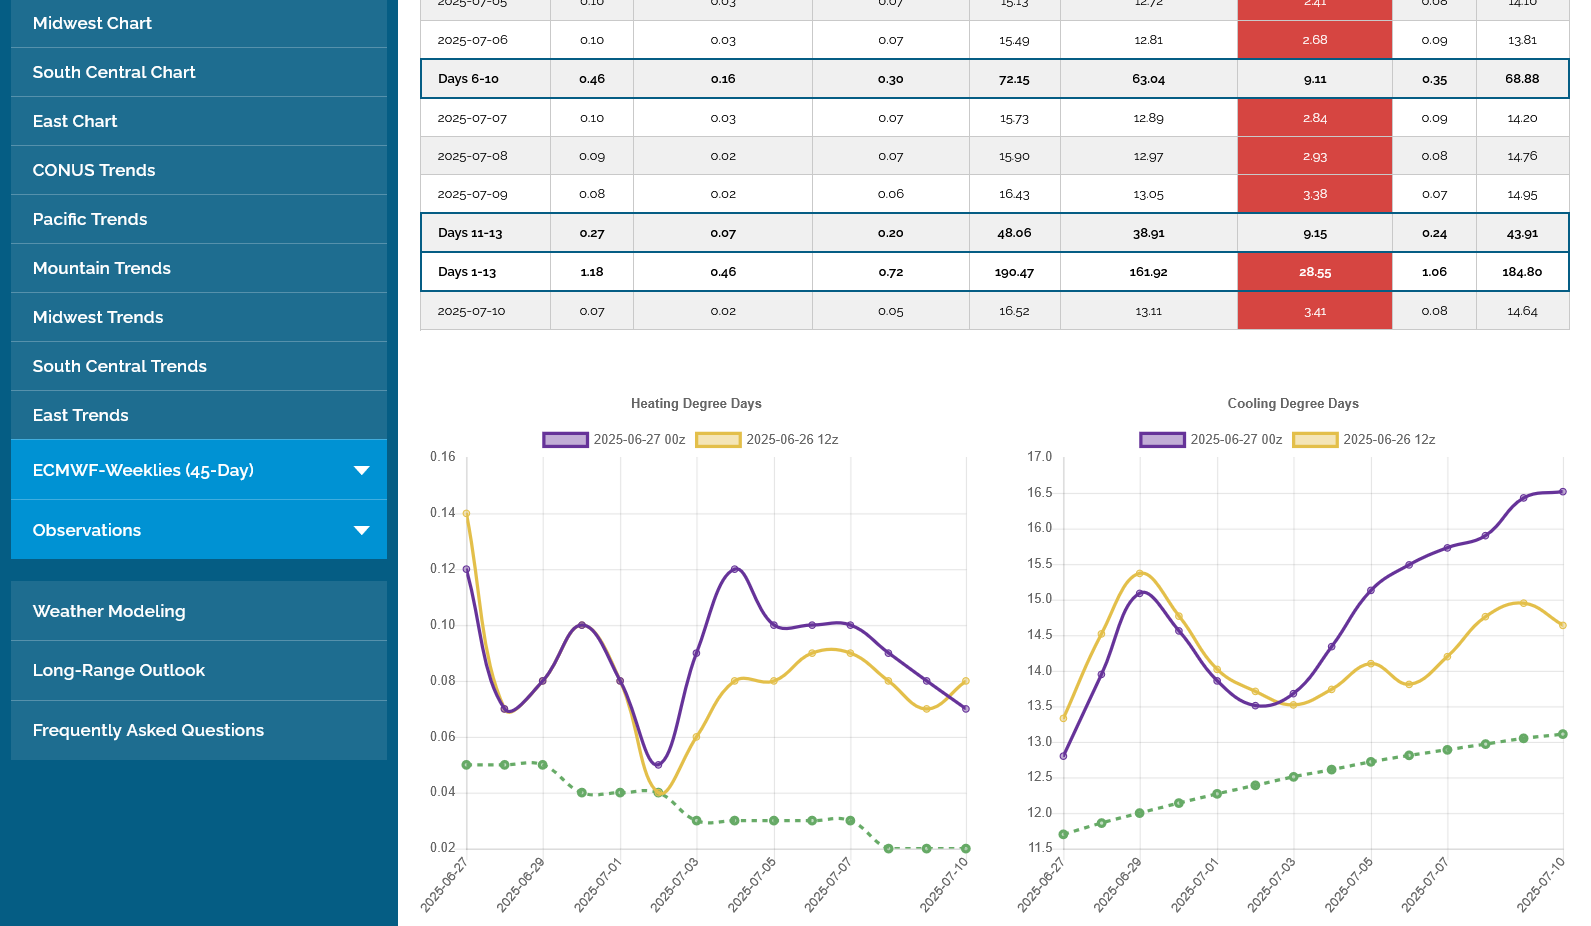
https://tradingeconomics.com/commodity/natural-gas
1. 1 day-note the spike low from the BEARISH EIA number at 9:30am Thursday that put in a selling exhaustion. July natural gas expired yesterday also. The approach of that expiration could have put additional selling pressure on nat gas earlier in the week, along with much LESS HEAT in the forecasts.
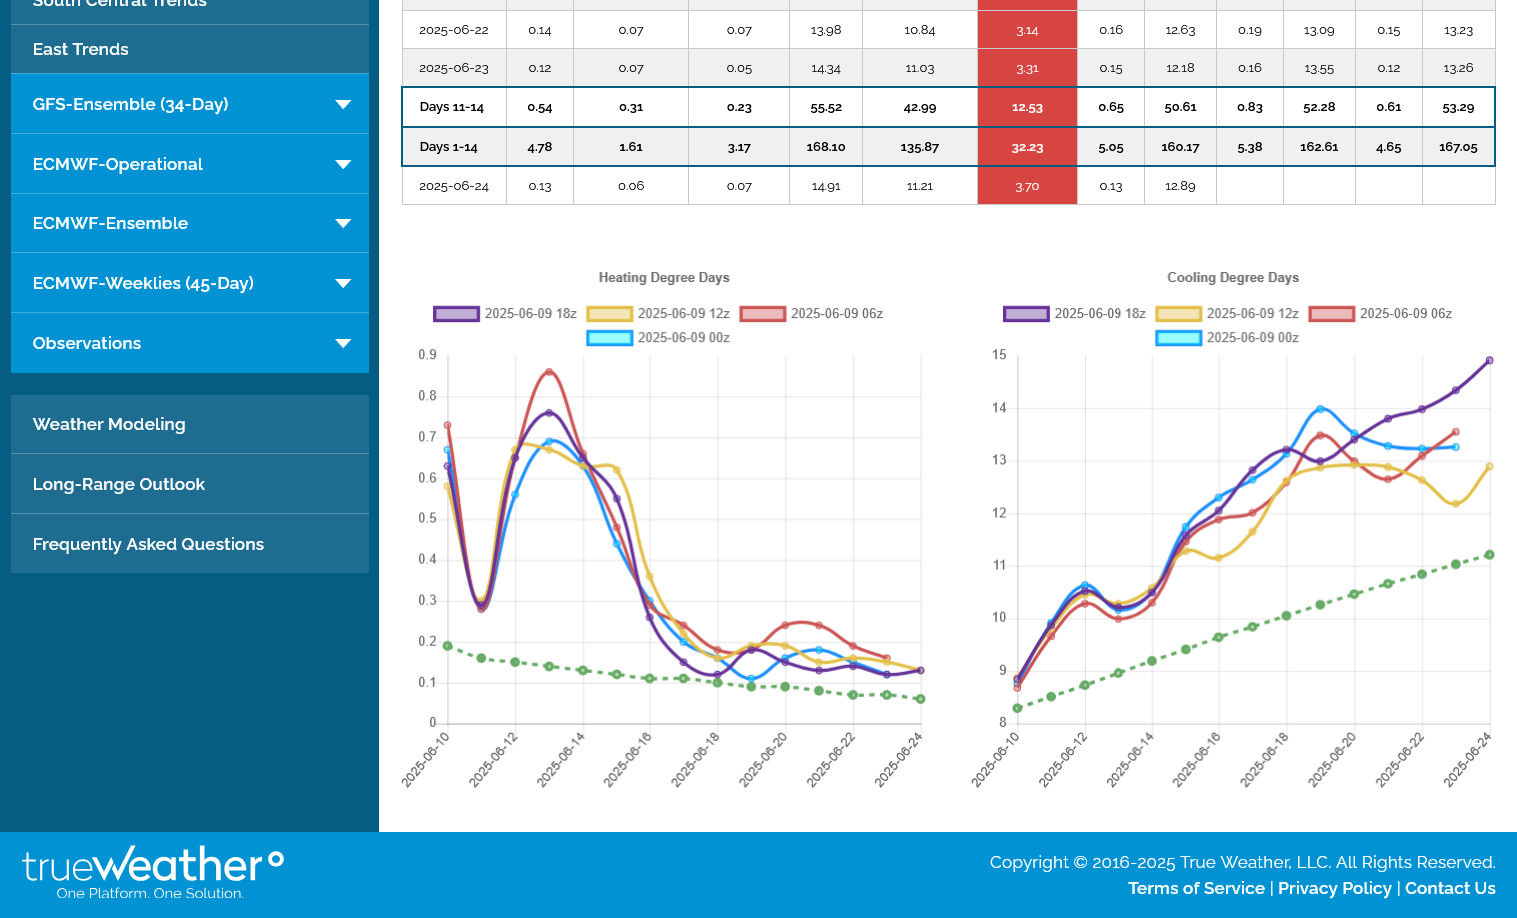
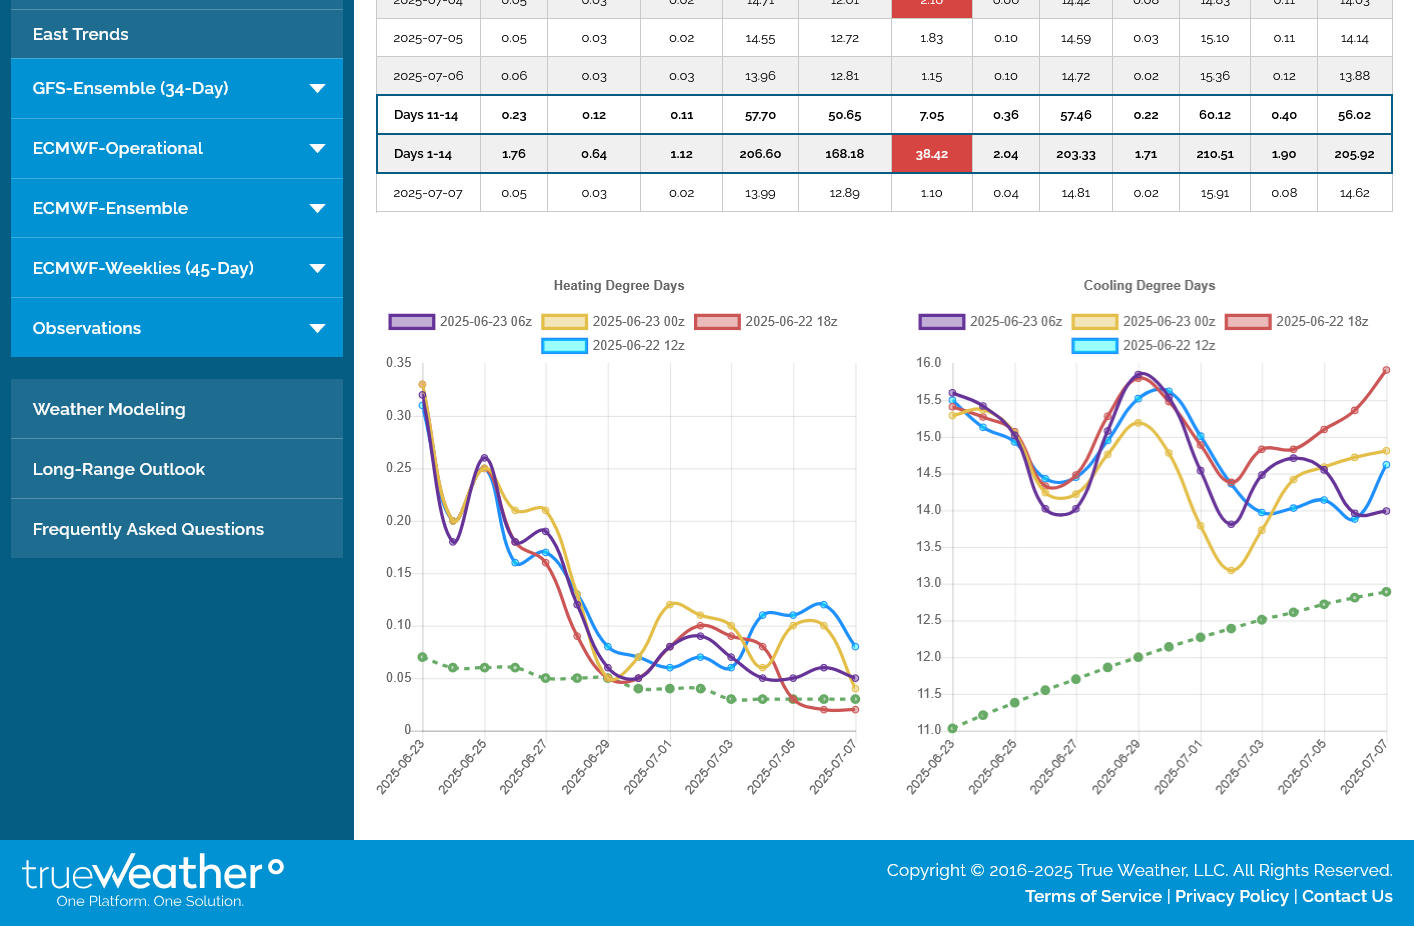
2. However, the last 24 hours have ADDED HEAT in week 2, including the just our 6z GEFS below in purple/right to go with the BULLISH EE above.
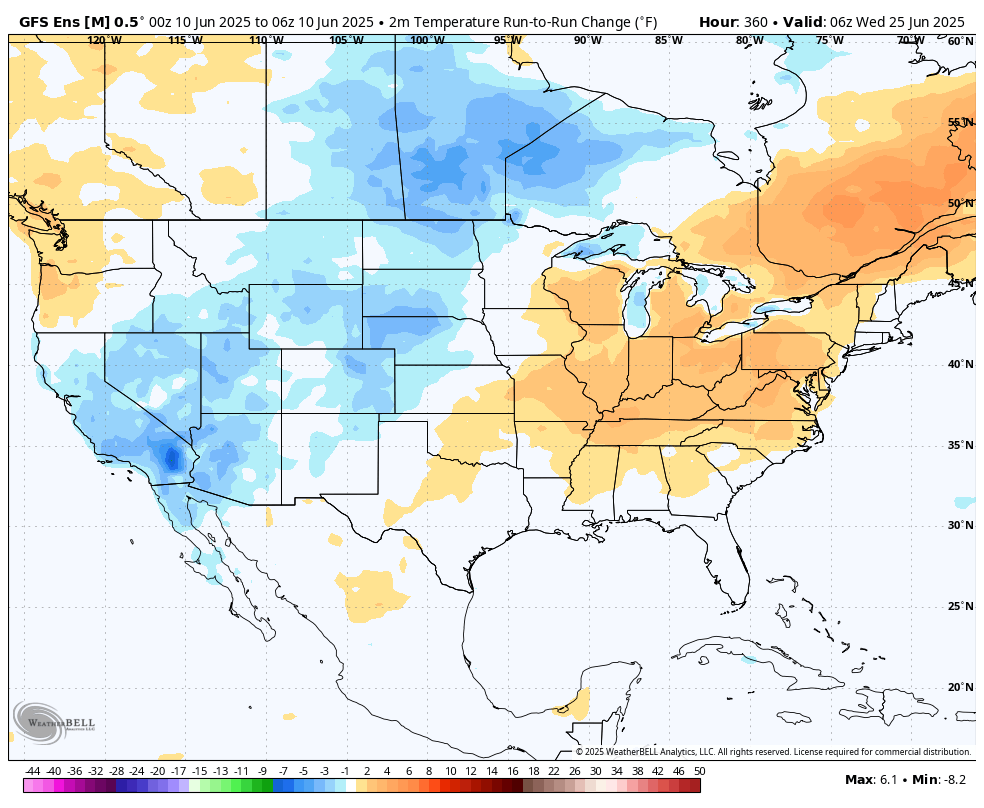
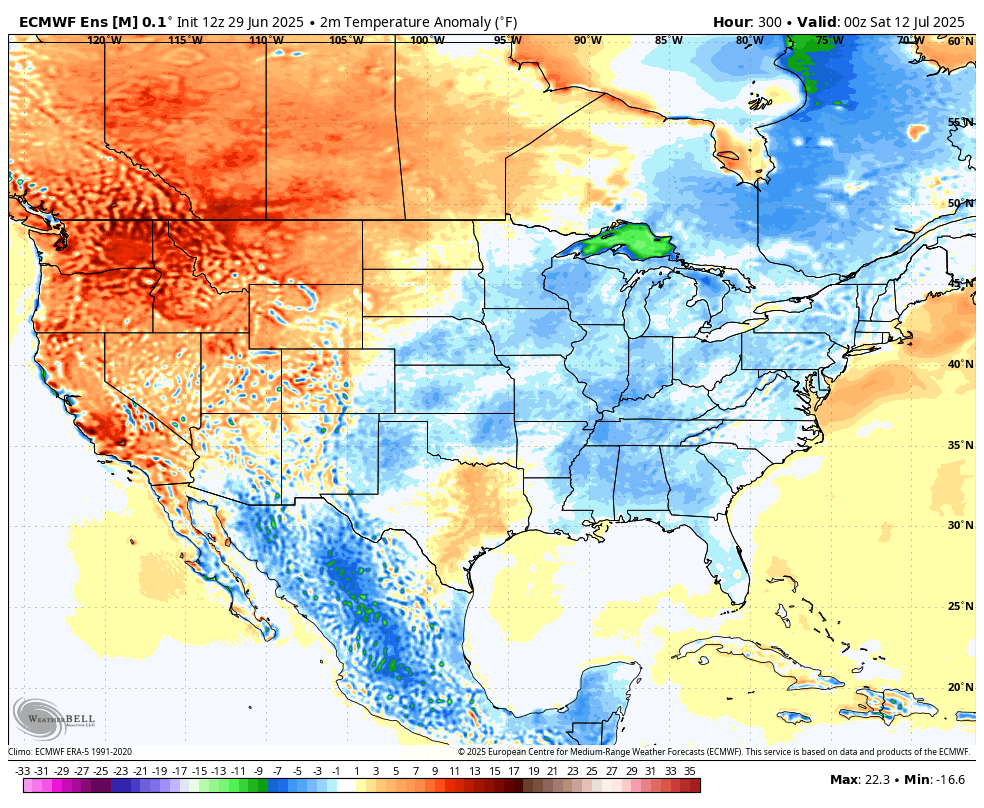
Big COOLER changes in the week 2 part of the forecast where the upper level ridge backs up westward and a modest trough develops in the eastern 1/3rd of the country by day 11. This cools temps in that part of the country to BELOW average for several days with the heat retrograding to the West, spilling out to the N.Plains.
(The automated NWS 8-14 day is out to lunch today and too hot in the areas in blue below.
These are the coolest days Fri-Sun July 11-13th. This is the departure from average highs.
+++++++++++++++++++++
By metmike - June 27, 2025, 8:16 a.m.
The last 0z European Ensemble model in purple, on the right was a whopping +5.6 CDDs vs the previous 0z run. NG prices have spiked higher overnight.

+++++++++++++
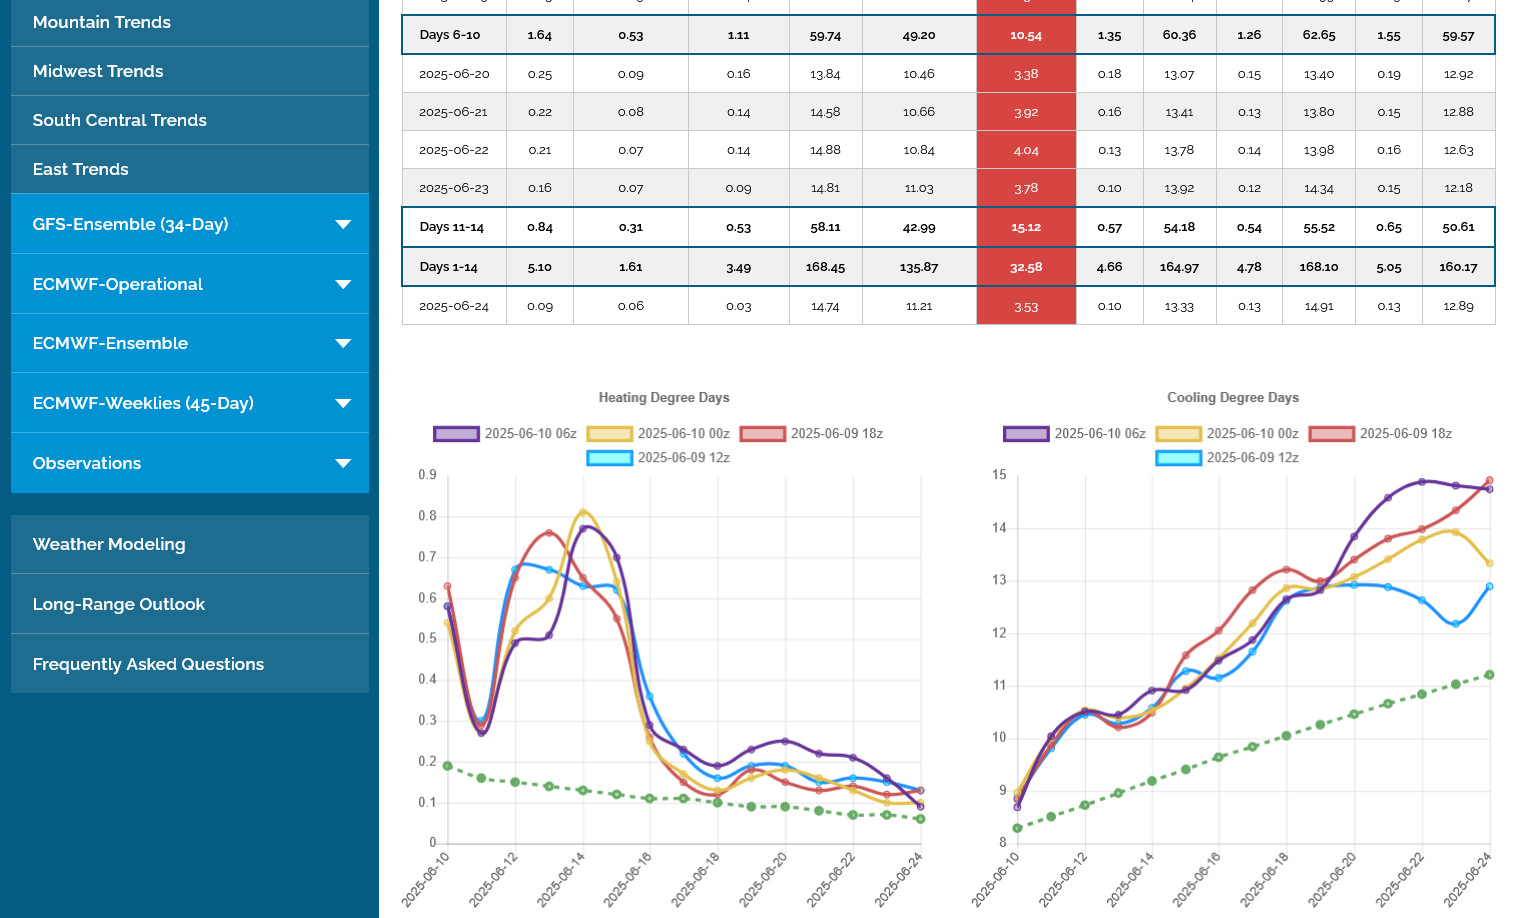
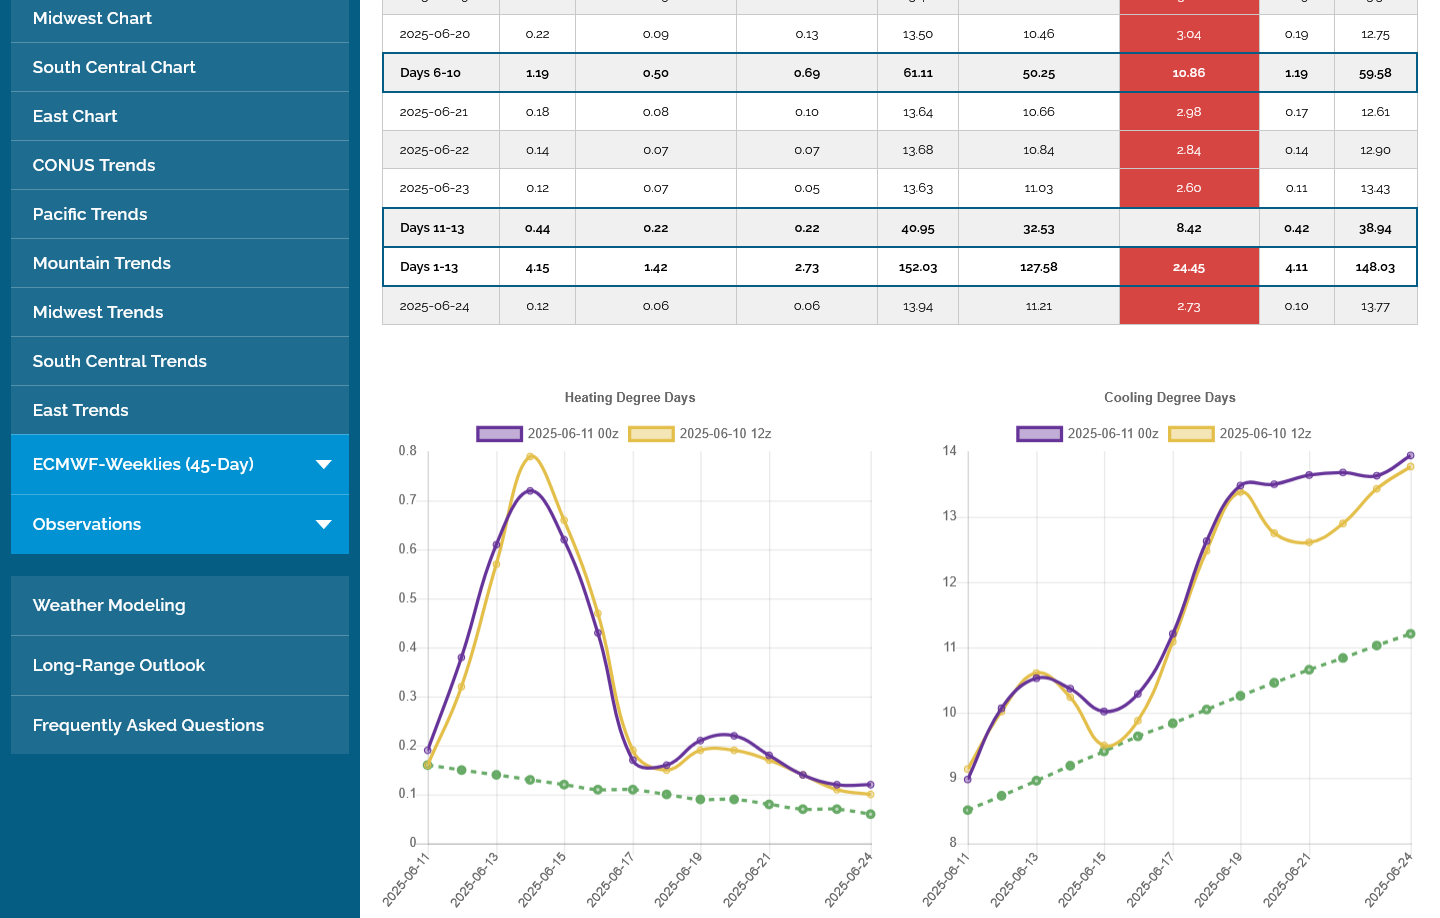
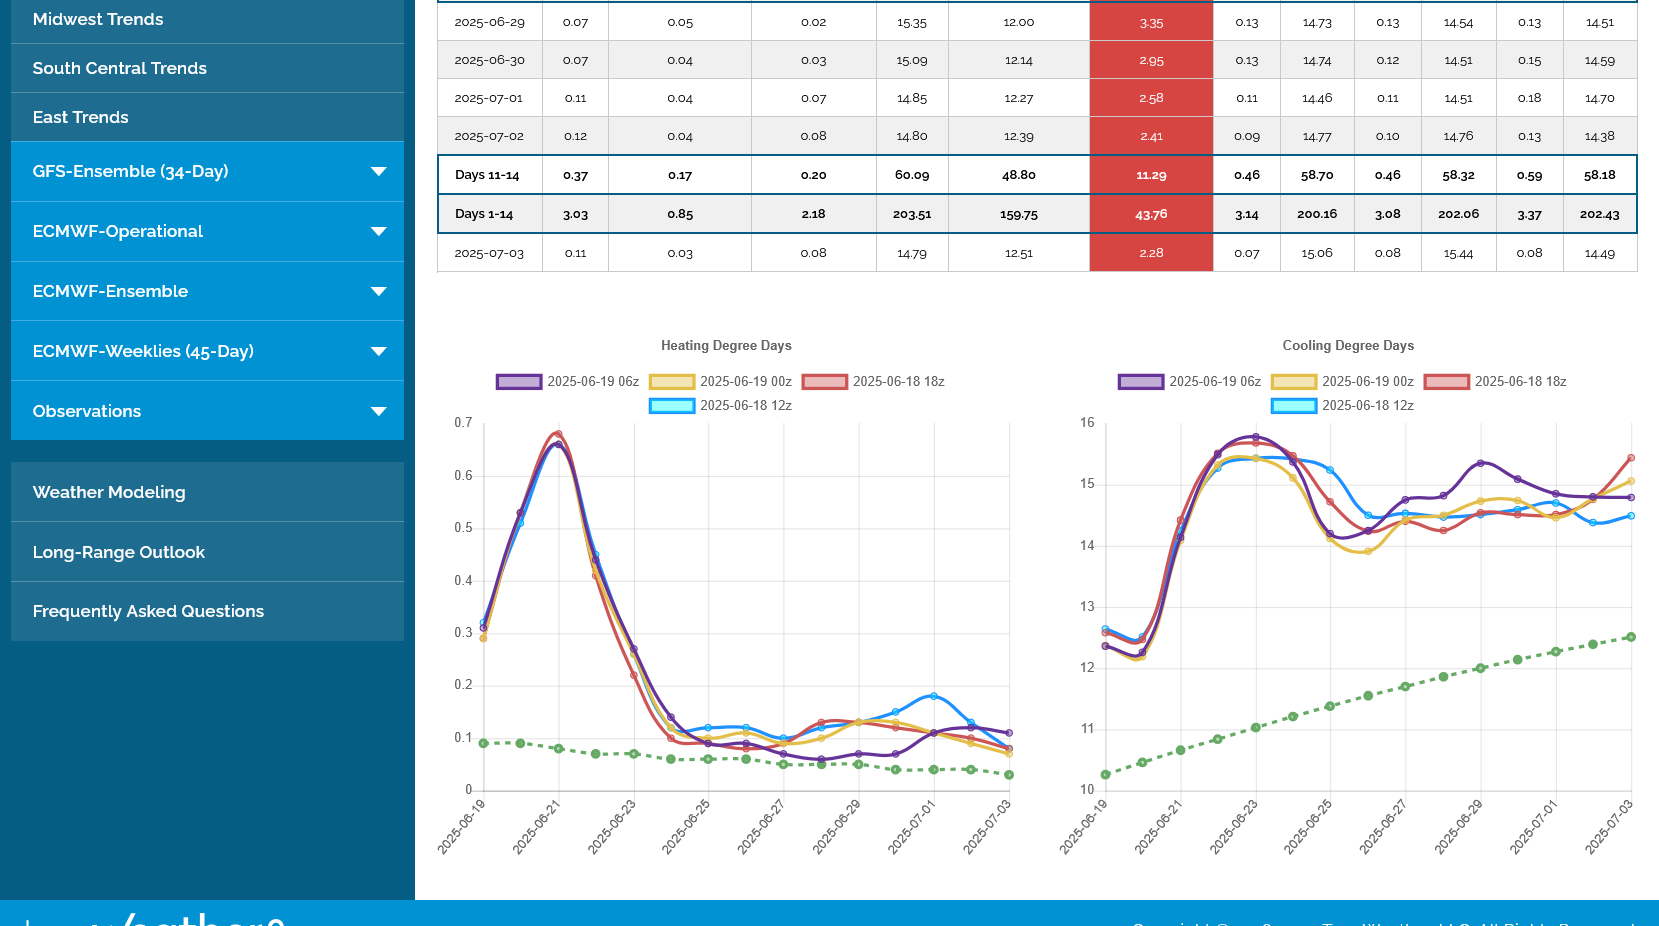
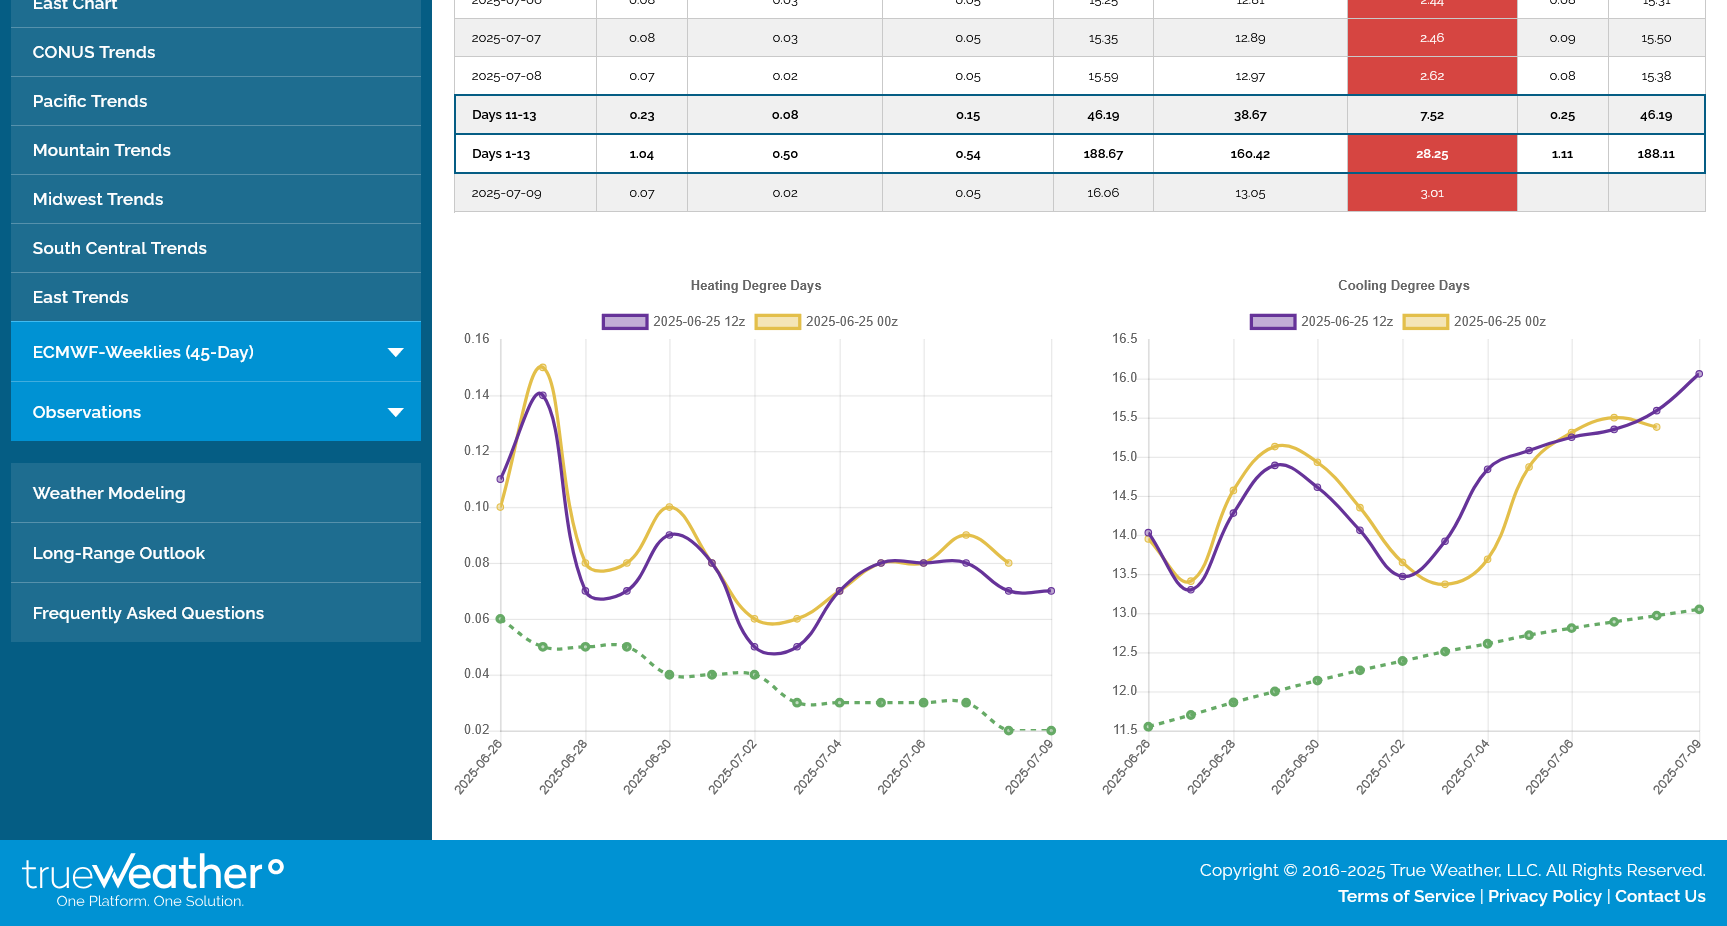
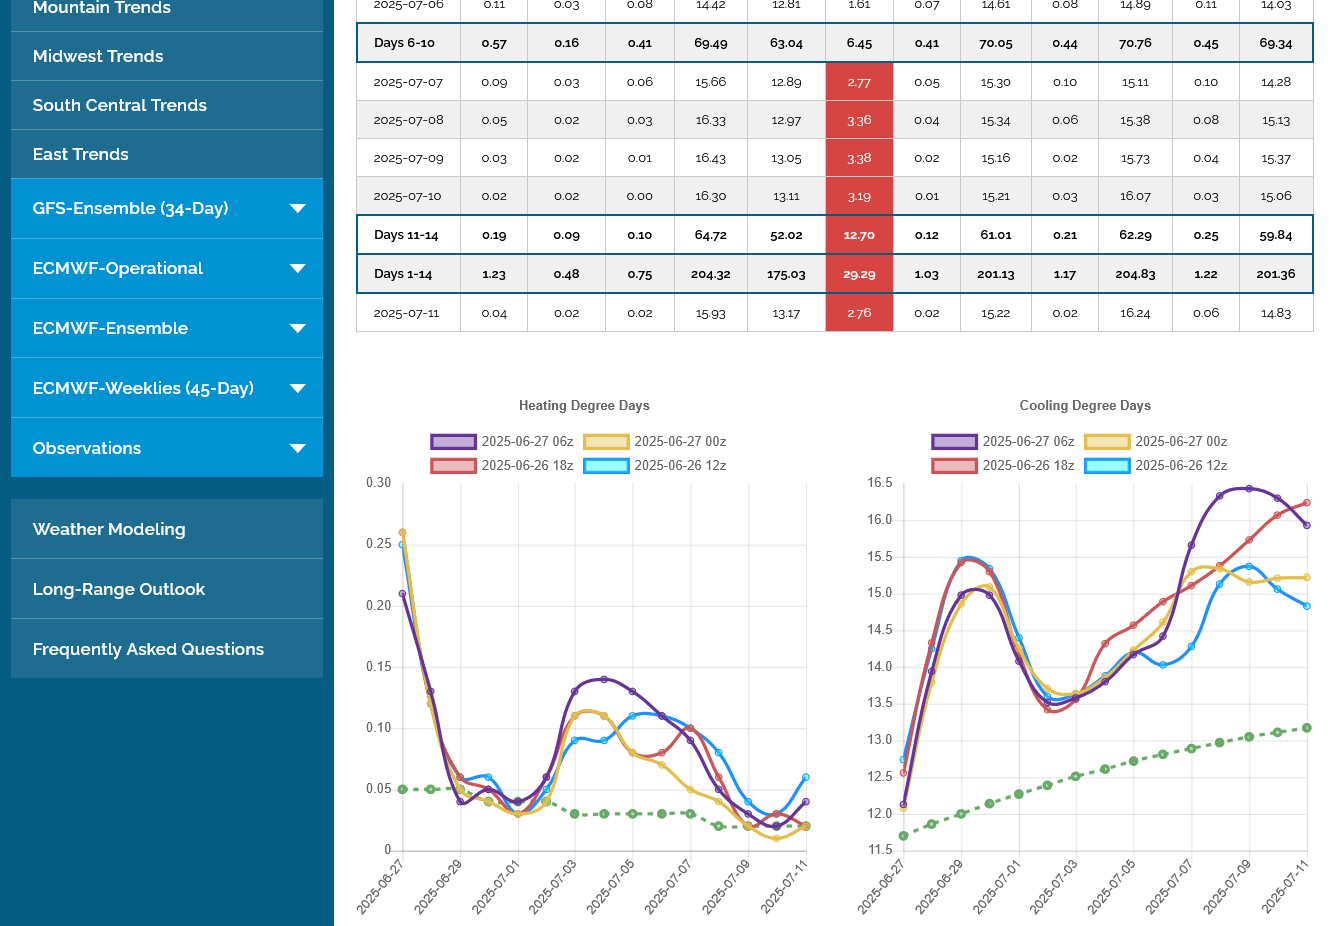
Here was the just updated 12z EE model CDDs. -3 CDDs from the previous 0z run, 12 hours earlier but LOOK AT WEEK 2!!!! This run is 2.5 days later than the one above, there is a shift of 2.5 days to the left below.
1. The heat spike is MUCH EARLIER and more intense. However the the last 5 days are the complete opposite. On Friday, above they were going straight up, last 2 data points around 16.5. On Sunday, below they are crashing down last 2 data points 14.5.
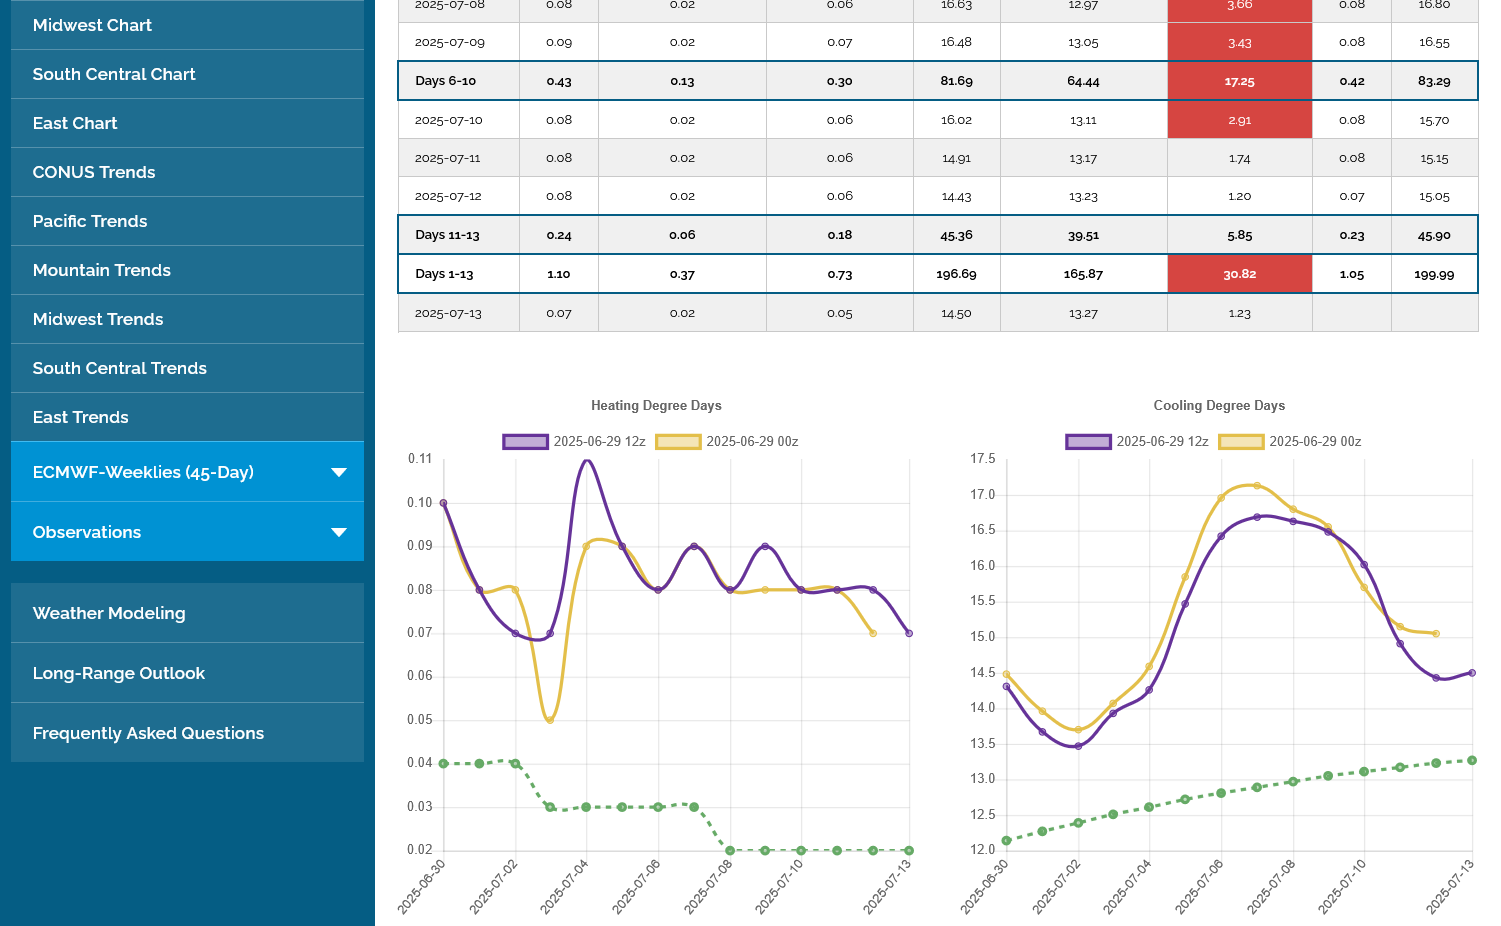
Out to lunch in the East!!!
https://www.cpc.ncep.noaa.gov/products/predictions/814day/index.php