Previous thread:
Grains/beans 4-13-25+
44 responses |
Started by metmike - April 13, 2025, 3:39 p.m.
https://www.marketforum.com/forum/topic/111157/
++++++++++++++++++++++
All the weather:
https://www.marketforum.com/forum/topic/83844/
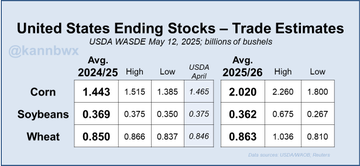
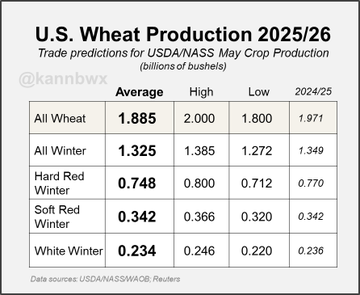
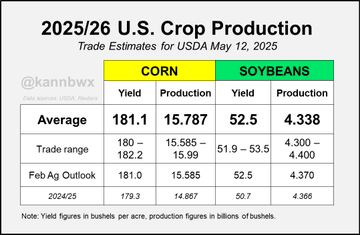
All trade estimates for USDA's supply & demand reports due at 11 am CDT on Monday. These will include the agency's first outlooks for 2025/26 as well as updates to 2024/25. Globally, corn and soy stocks are seen up into next year while wheat stocks are seen steady.
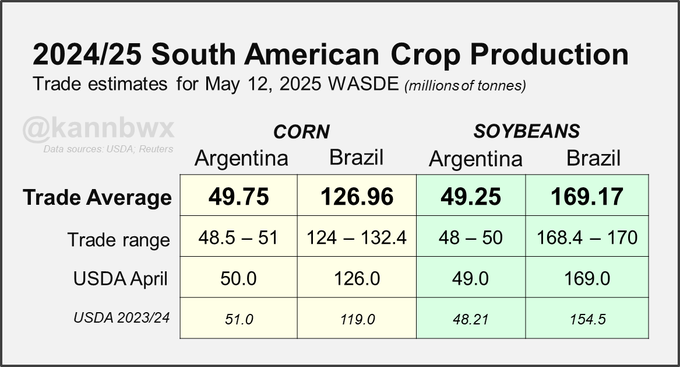
One more poll.... South American crops 2024/25. USDA will publish its first cut at 2025/26 but analysts are not polled for that yet since it is so early.
BULLISH!!!!
For corn and beans but BEARISH for NEW CROP wheat production!
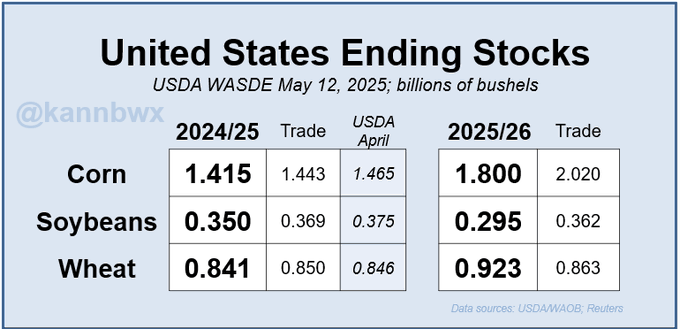
USDA puts 2025/26 U.S. corn ending stocks up 27% on the year (trade expected 40%). Wheat is pegged to rise 10% but soybean stocks are set to fall 16% on the year.
March planting intentions combined with USDA's trendline yields set 2025/26 U.S. corn production at 15.82 billion bushels and soybean production at 4.34 billion bushels.
·
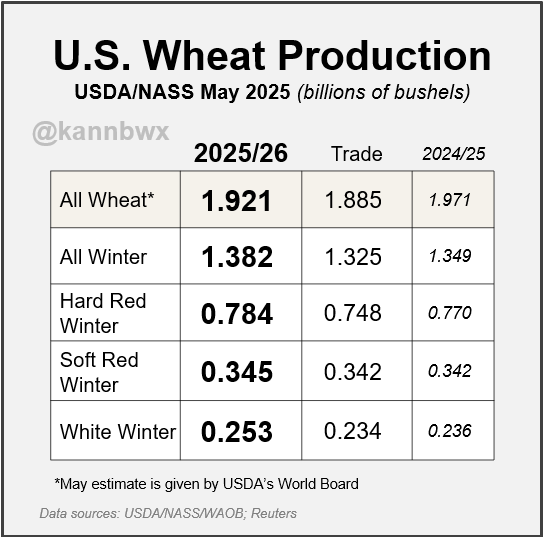
USDA predicts that the 2025/26 U.S. wheat crop will be smaller than in the previous year, but winter wheat output will be stronger. USDA's May survey also implied larger winter wheat production than analysts were expecting.
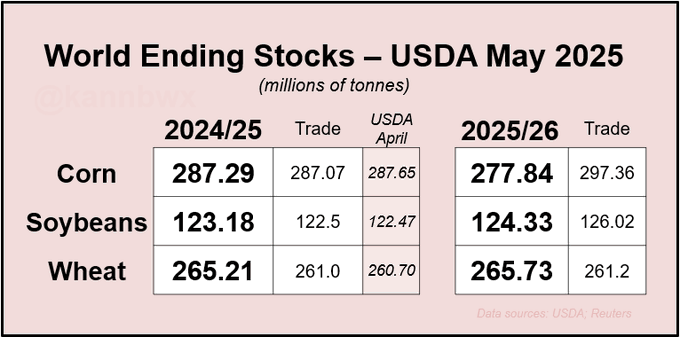
USDA leaves Argentina's 2024/25 corn and soy crops unchanged from last month but hikes Brazil's corn crop by 4 mmt. USDA also sets Brazil's 2025/26 soy crop at 175 mmt.
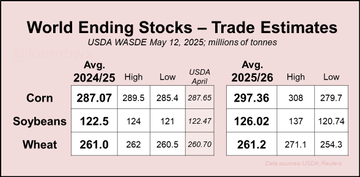
USDA pegs 2025/26 global #corn stocks well below trade expectations, largely driven by smaller-than-expected U.S. supplies. YOY global soy supply growth may not be as bad as feared, and wheat stocks are seen steady (though 24/25 stocks were hiked - and in several countries).
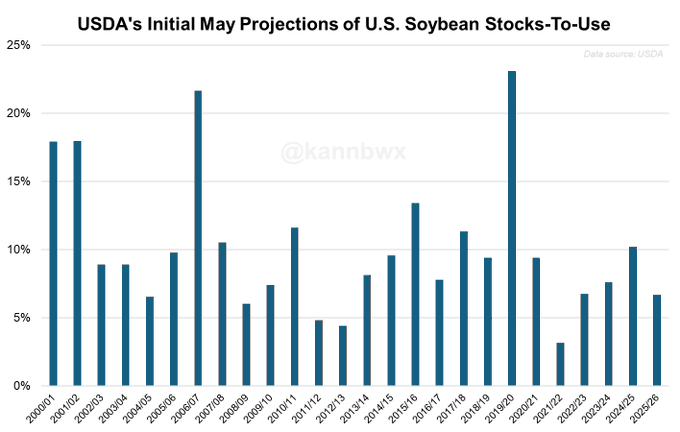
USDA puts 2025/26 U.S. soybean stocks-to-use at 6.68%, down from 7.98% in 2024/25. That is actually USDA's second lowest initial stocks/use outlook for U.S. #soybeans since 2012/13.
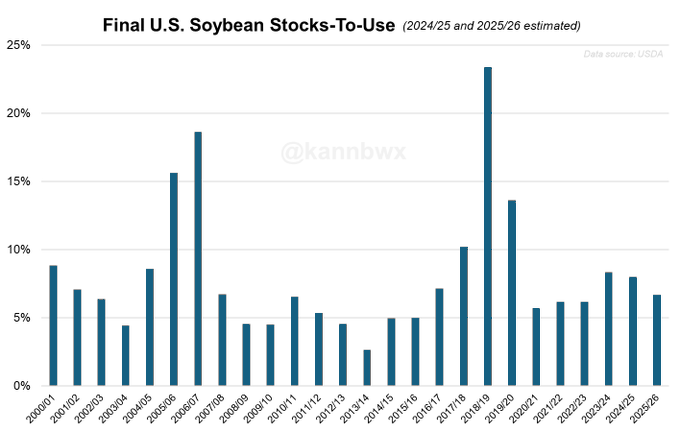
Up against the final stocks/use figures, 6.68% in 2025/26 would be a three-year low but slightly above the levels from 2020/21 through 2022/23. And this is assuming a record 2025 U.S. soybean yield of 52.5 bu/acre (current record is 51.9 from 2016).
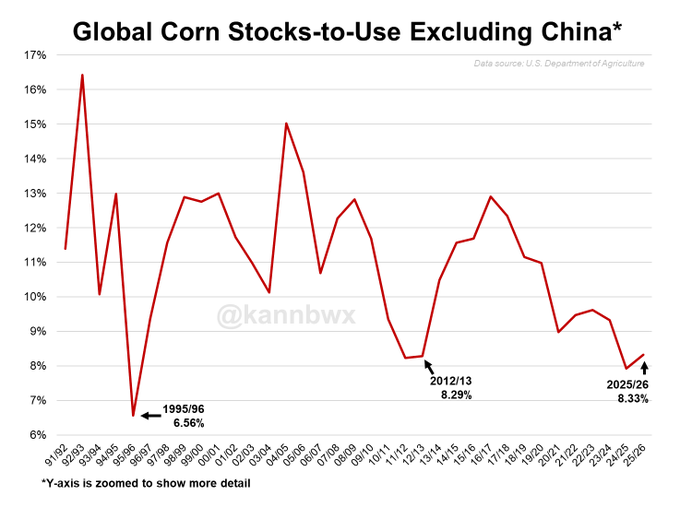
Global #corn stocks-to-use drops to 8.33% in 2025/26 when you exclude grain hoarder China. That is up from 7.93% in 2024/25 but is otherwise the lowest since 2012/13.
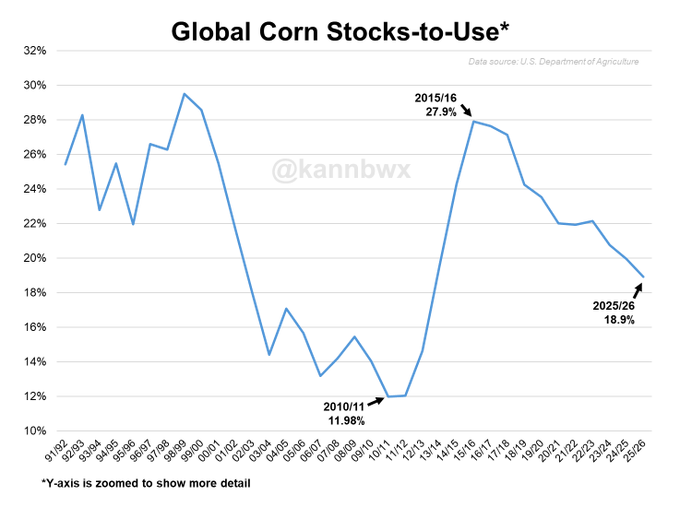
USDA forecasts 2025/26 global #corn stocks-to-use at a 13-year low of 18.9%. That is despite predictions for a record-large U.S. corn crop.
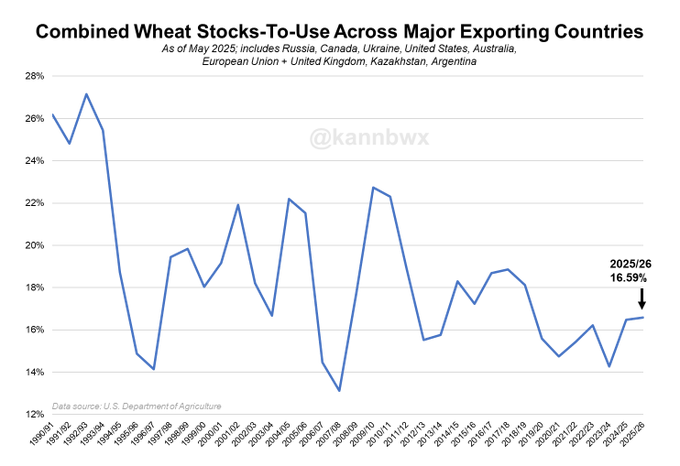
The narrative has indeed shifted in the #wheat market. USDA predicts 2025/26 wheat stocks-to-use among major exporters at a 7-year high of 16.59%. Up until earlier this year, the theme for imminent, multi-year low wheat stocks/use had been ongoing for a few years.
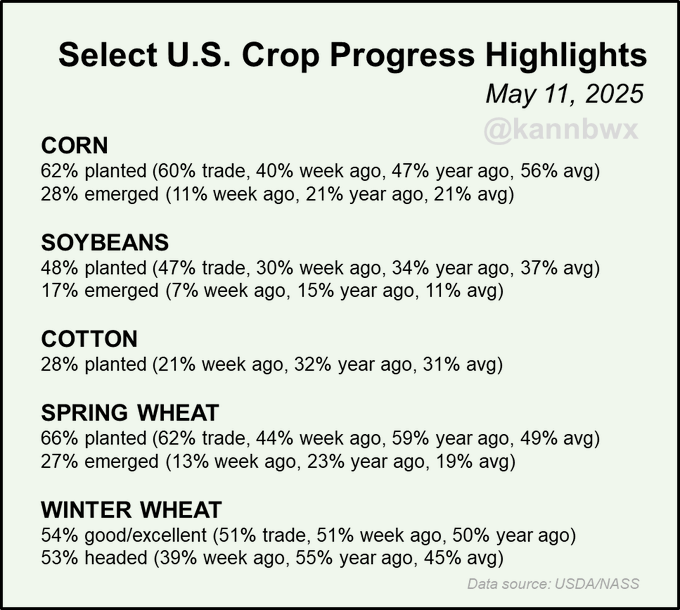
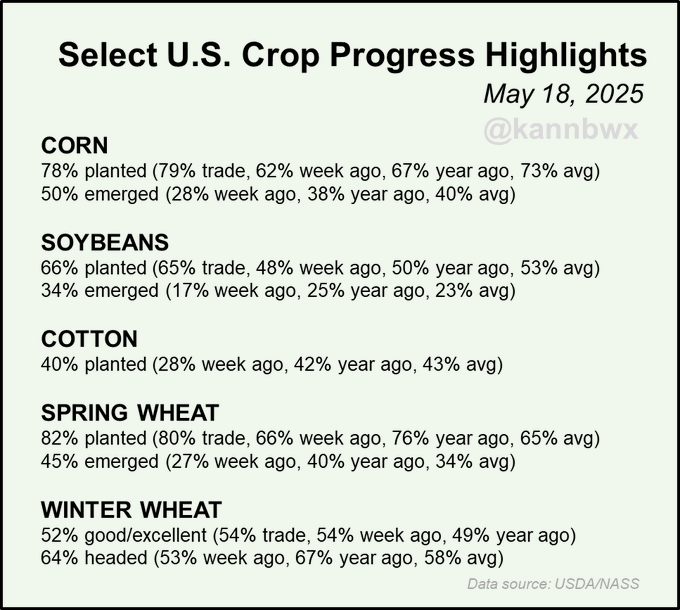
U.S. farmers got a bit more crops planted last week than the trade expected. #Soybeans are still clinging to their record planting pace and #corn is still moving along well. Winter #wheat conditions jumped again, now 54% good/excellent.
Full report here: https://downloads.usda.library.cornell.edu/usda-esmis/files/8336h188j/9k421b436/1z40nq264/prog1925.pdf
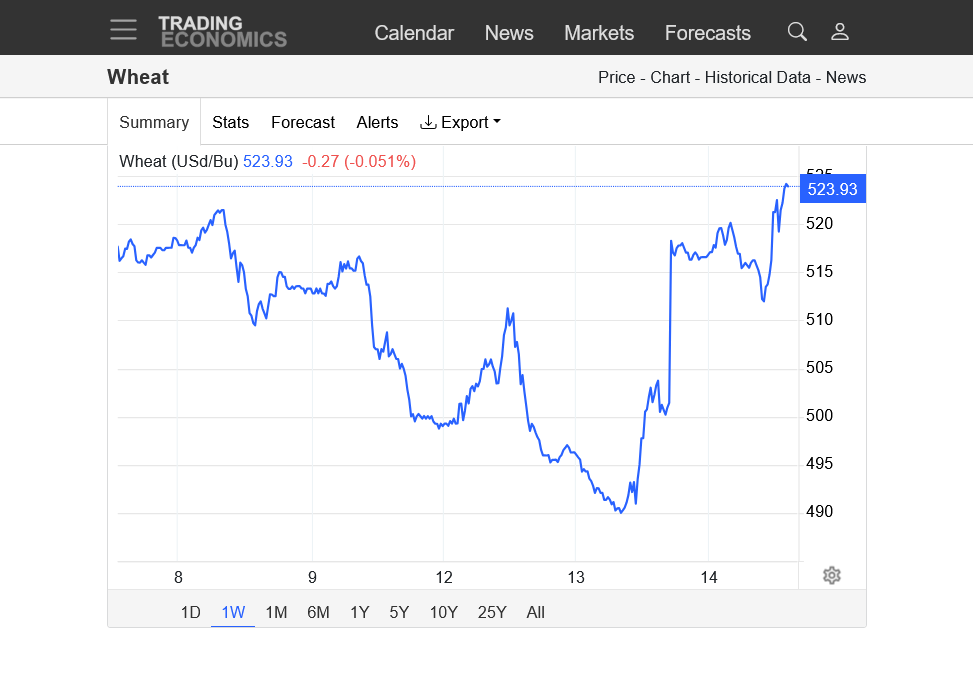
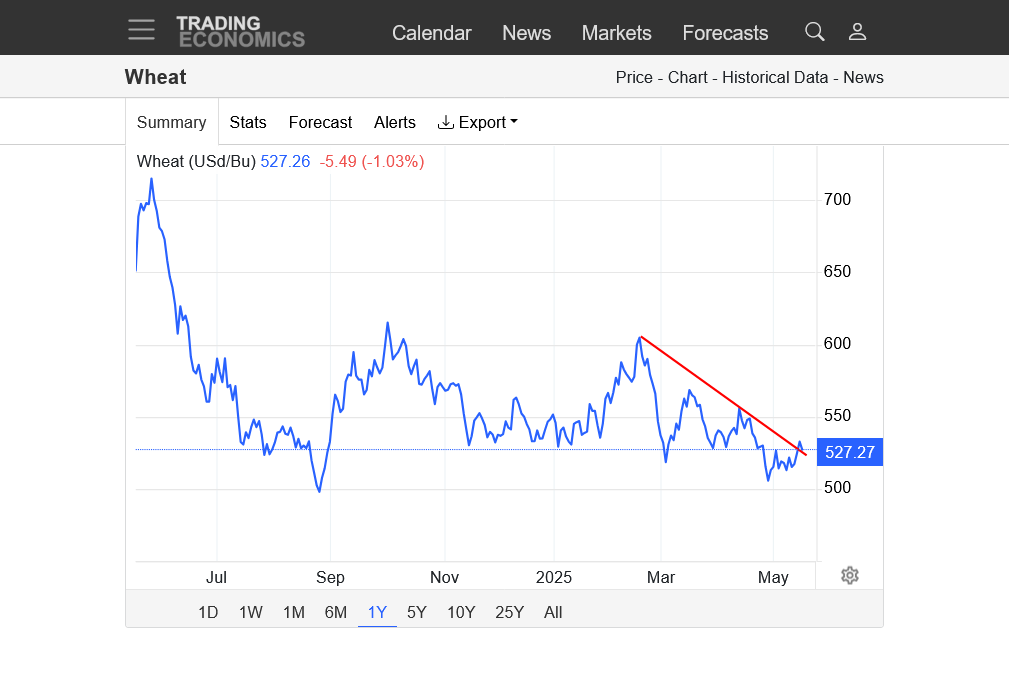
at what point does wheat become a compelling value
Maybe TODAY, coffeecloth!!!!
Big reversal up from spike low of long lasting downtrend (5 year lows-major support) possible today!
https://tradingeconomics.com/commodity/wheat
1. 10 years-Major support here going back 5 years near $5.
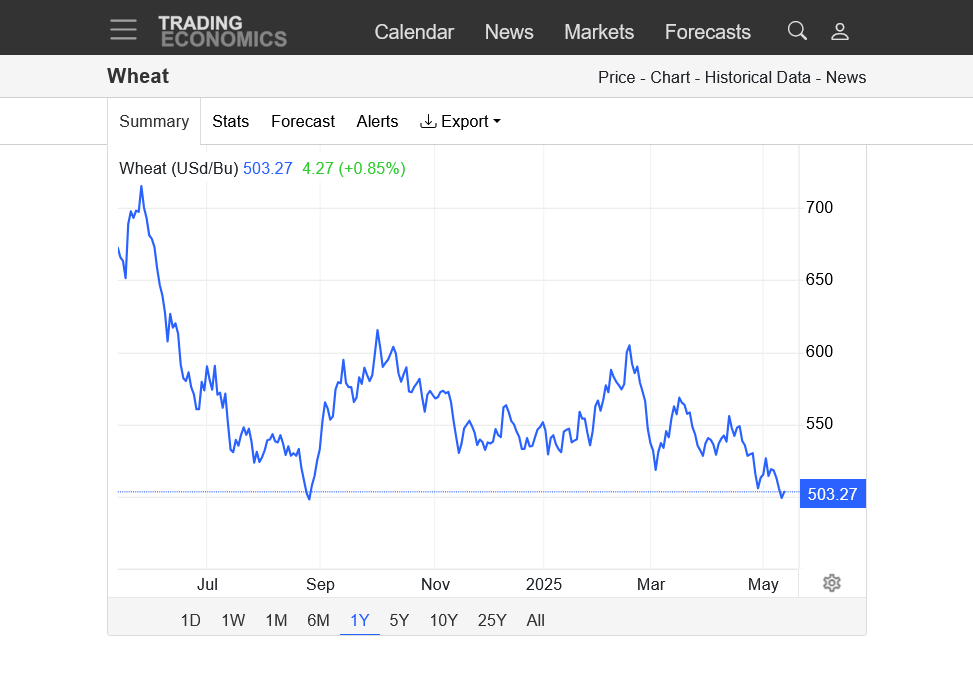
2. 1 year-Double bottom with last September
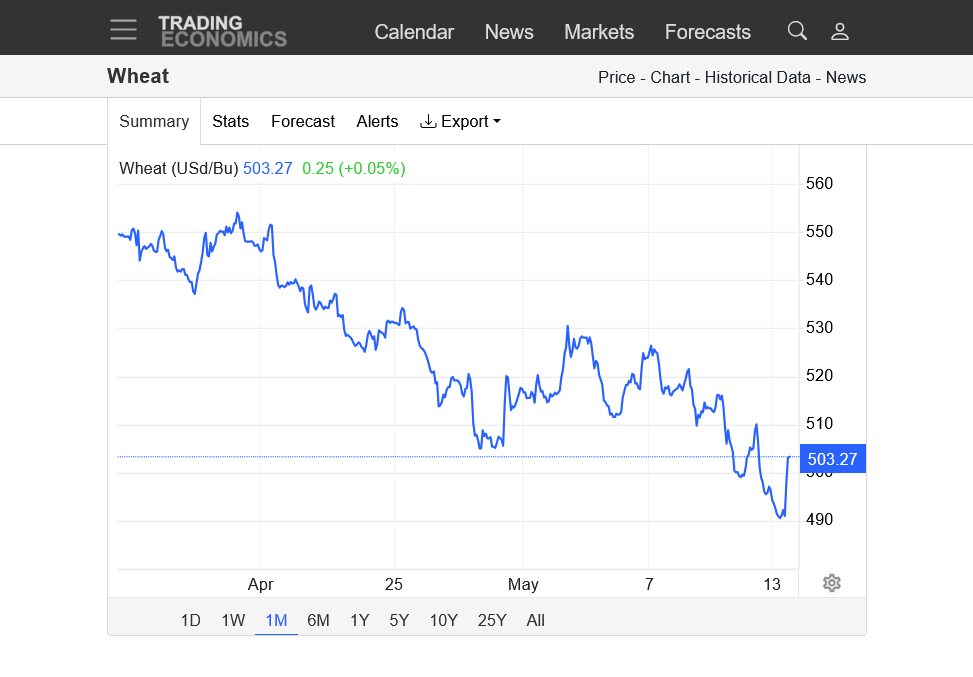
3. 1 month-Reversal up possible from fresh lows in strong down trend
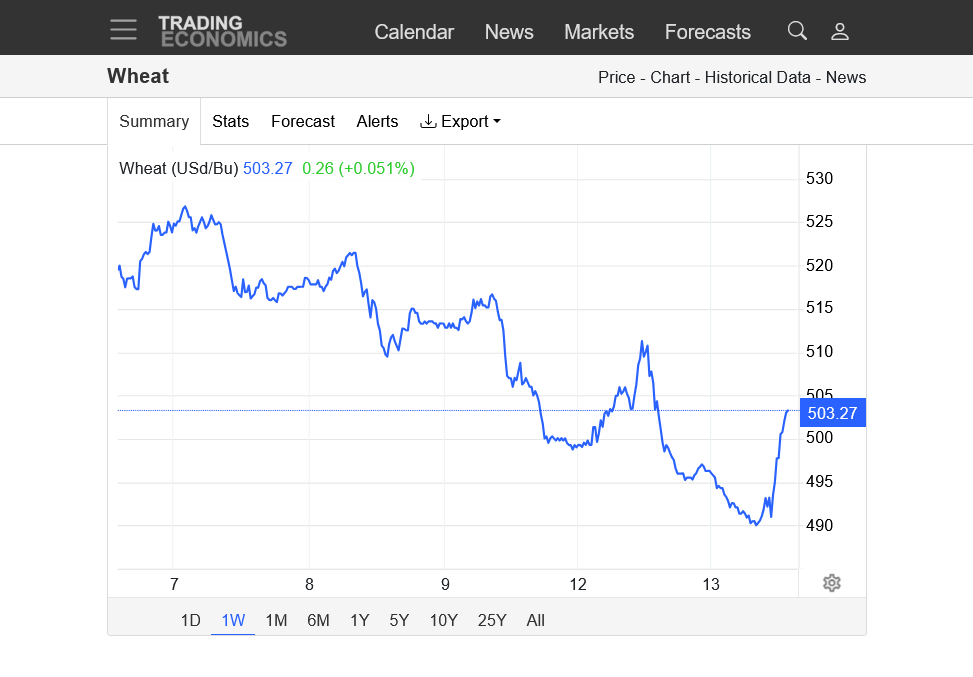
4. 1 week-Reversal up possible from new lows in big down trend-note the wave like structure of the strong downtrend
5. 1 day-Huge reversal up from spike low possible from selling exhaustion early this morning.........If we close higher.
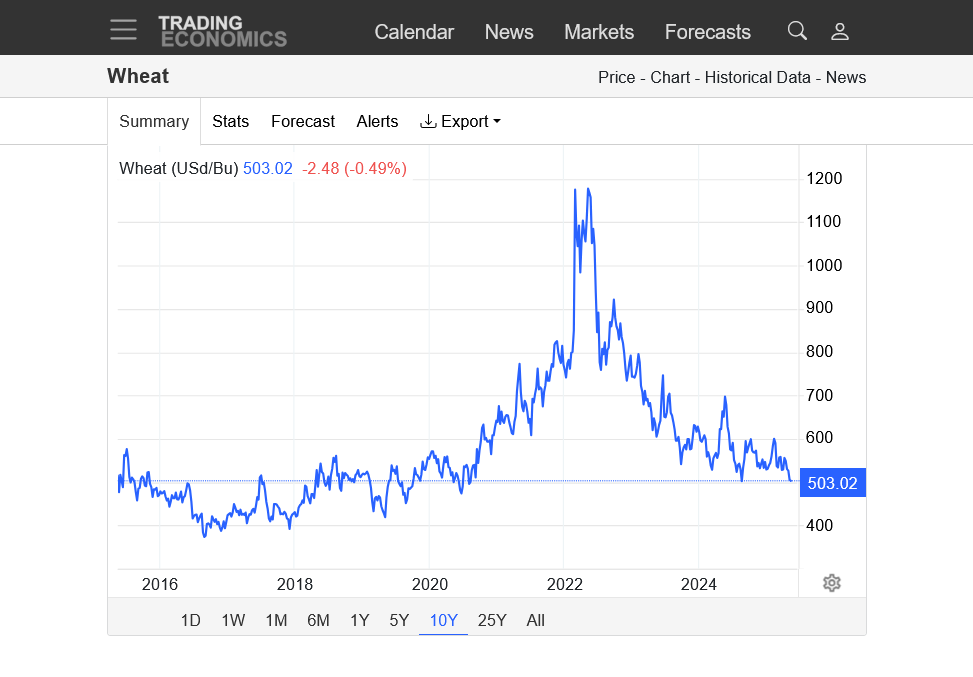
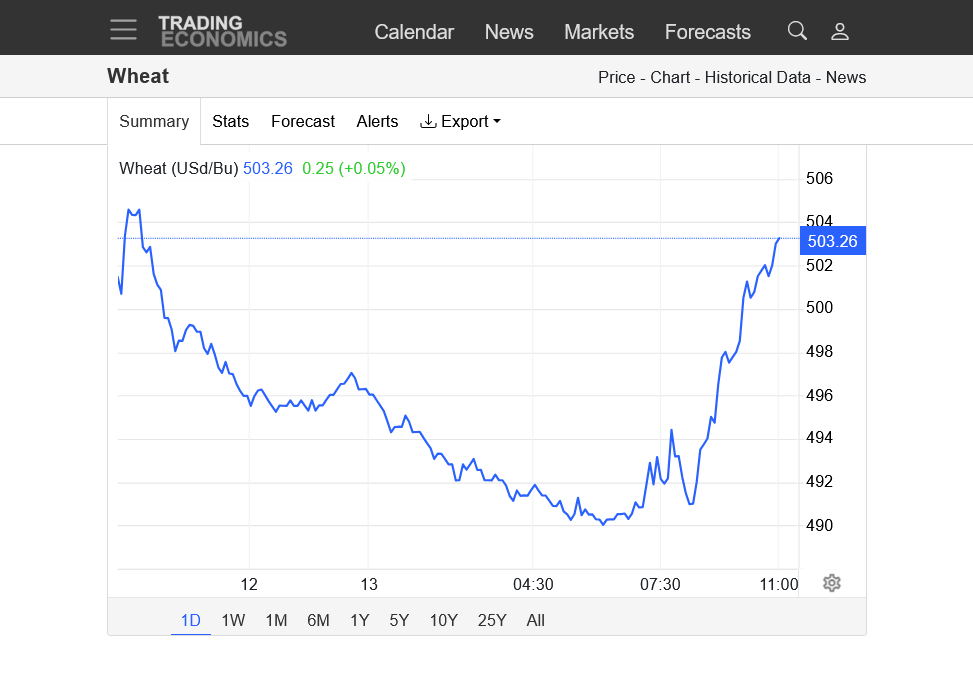
Wheat did end up closing a couple cents higher. Was this a selling exhaustion lower or just temporary based on the bear flags/wave pattern and very strong $5 price level, extremely strong resistance.
The charts that I use from this site do not always line up perfectly with the futures prices that I use from my trading account. They are free and show the general patterns so I'm not complaining, just explaining.
https://tradingeconomics.com/commodity/wheat
The USDA report for wheat on Monday was bearish and the crop progress report after the close was bearish yesterday. I think that, at the very least the bearish news and long lived selling had a short term peak.
++++++++++++++++
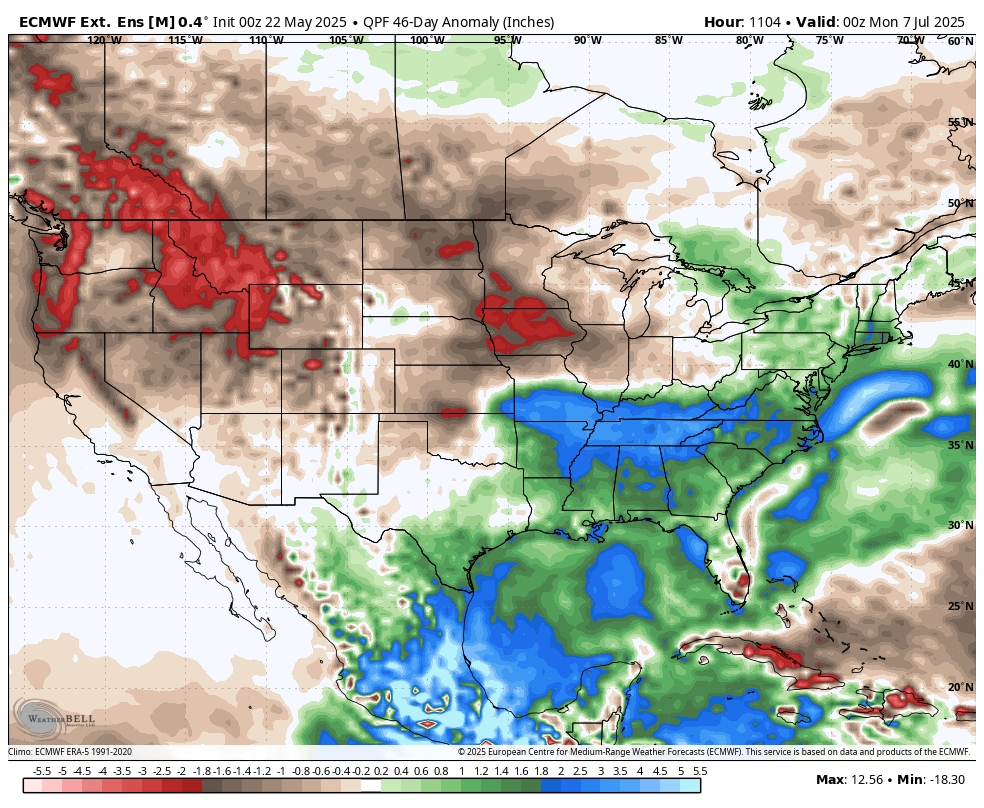
Also, adding to that bearishness is the rains the next week/7 days will be falling exactly where they're needed the most, especially in very dry Spring wheat country.
However, it is mostly dry for a key production area of the Hard Red Winter Wheat crop in the (western) Southern Plains during grain fill.
7 Day Total precipitation below:
http://www.wpc.ncep.noaa.govcdx /qpf/p168i.gif?1530796126

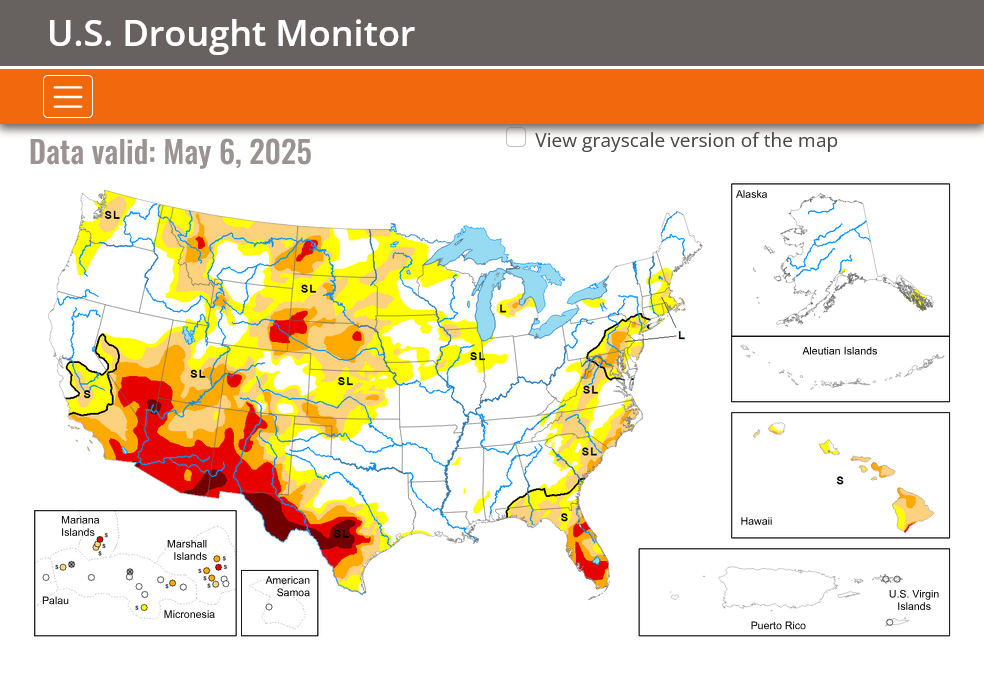
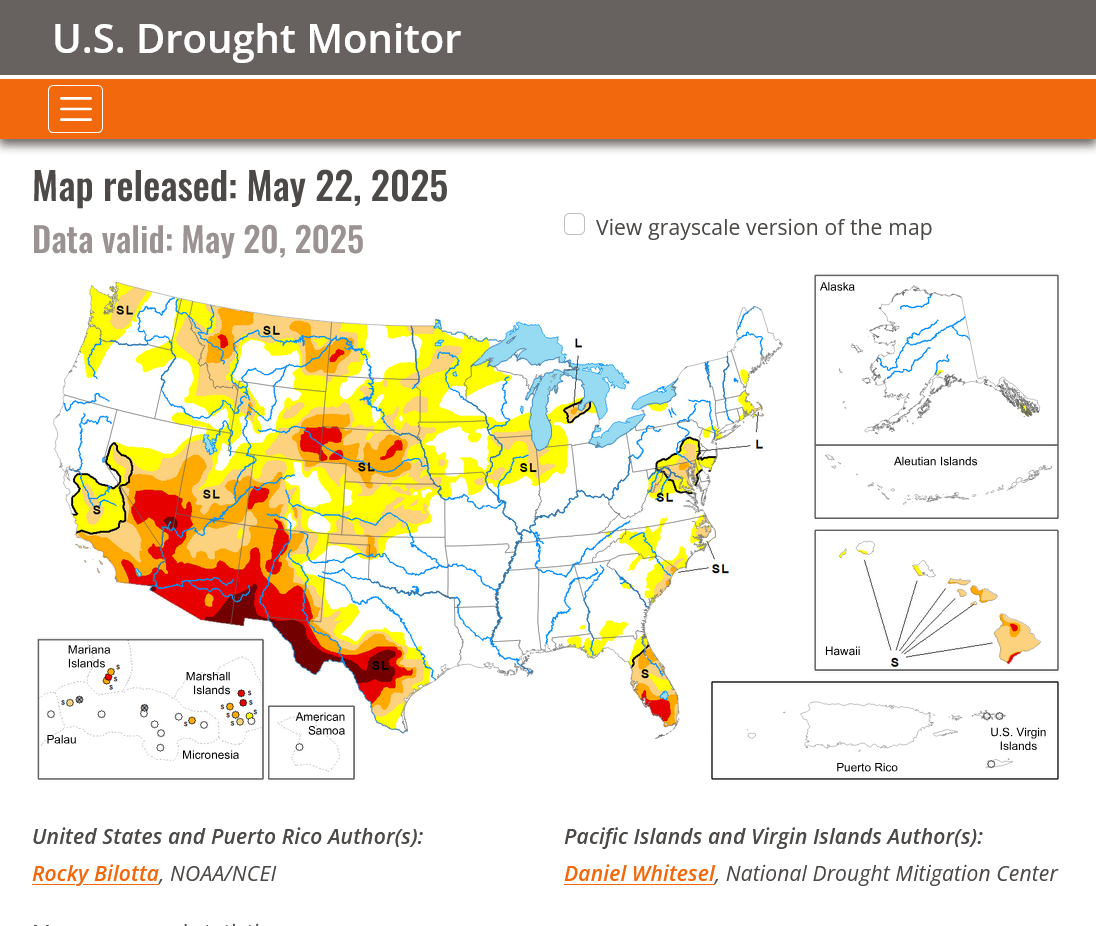
DROUGHT MONITOR
https://droughtmonitor.unl.edu/
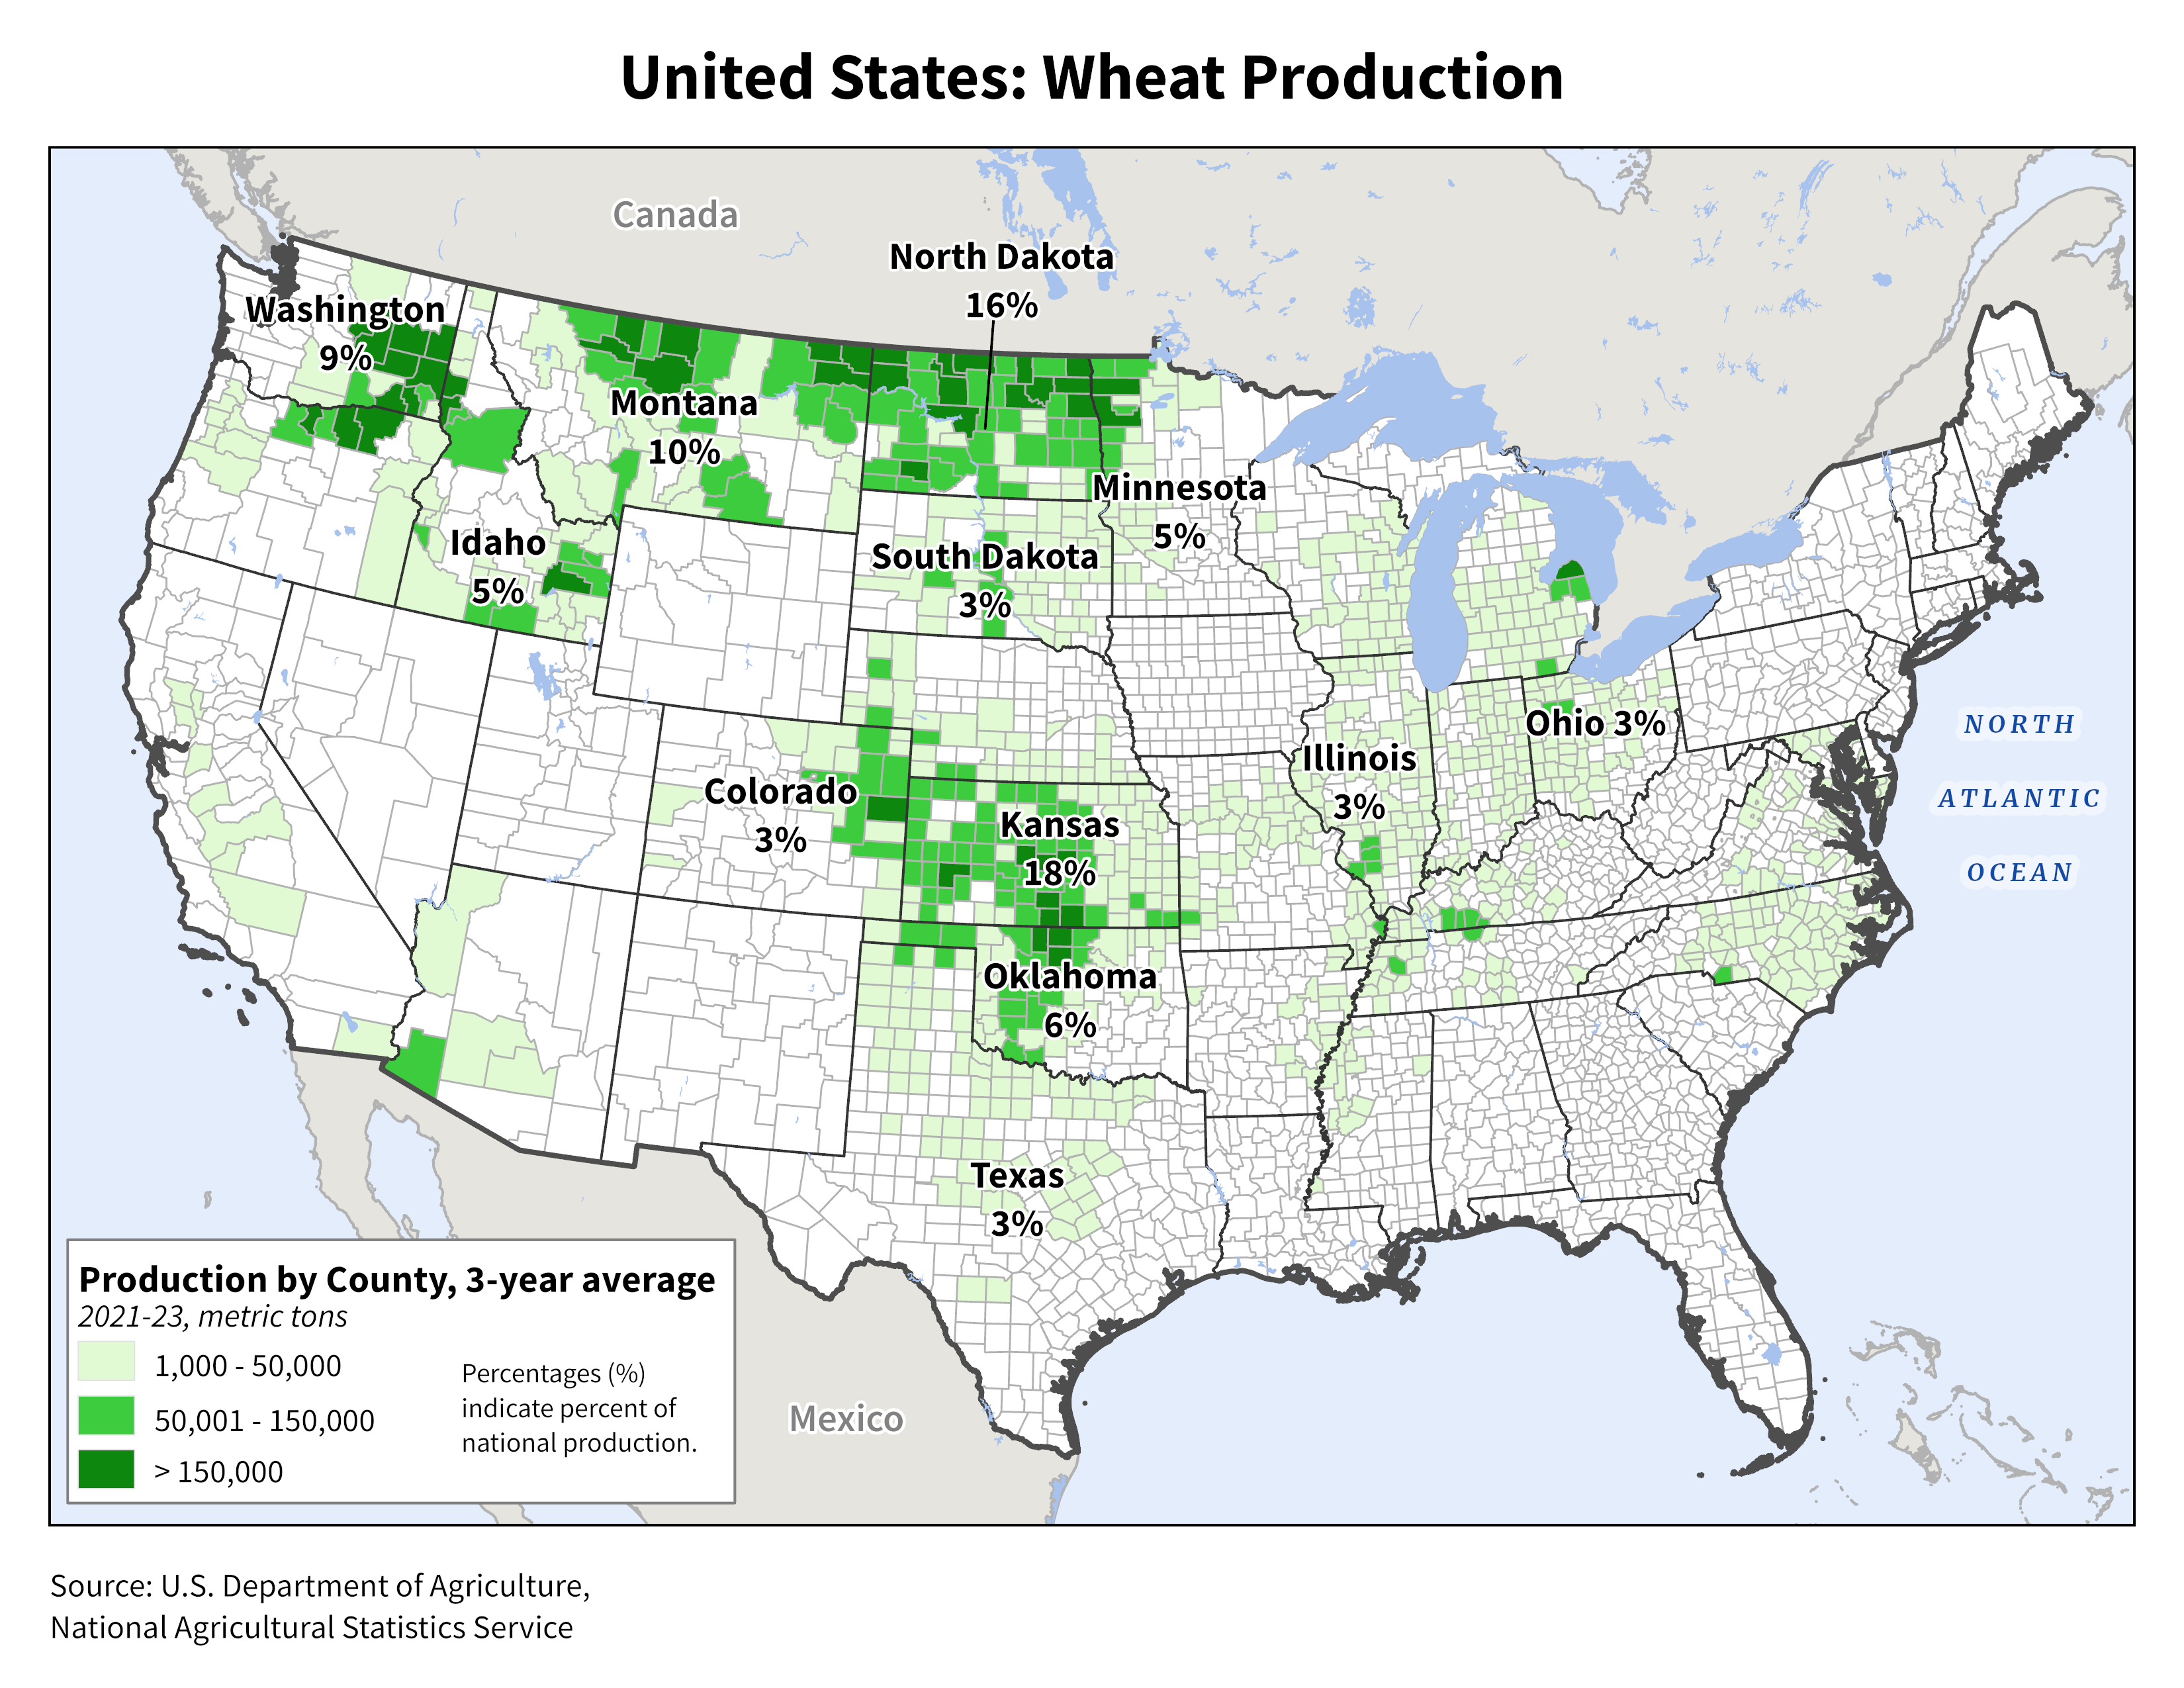
https://ipad.fas.usda.gov/rssiws/al/crop_production_maps/US/USA_Wheat.png
All the weather:
https://www.marketforum.com/forum/topic/83844/
Matt's weather:
May 13, 2025: Intense MN Fires | Midwest Severe Storms Likely | Vital Northern US Rains this Week
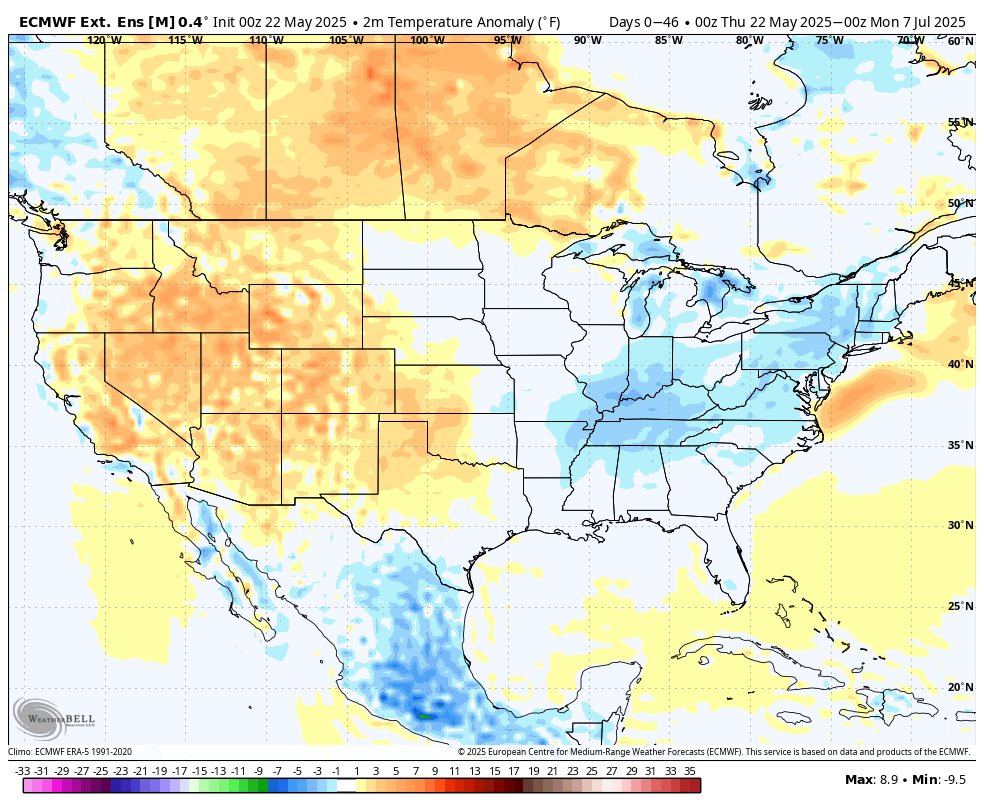
Update this morning: Forecast now, May 13th thru the end of June from the latest European Ensemble model:
Temps
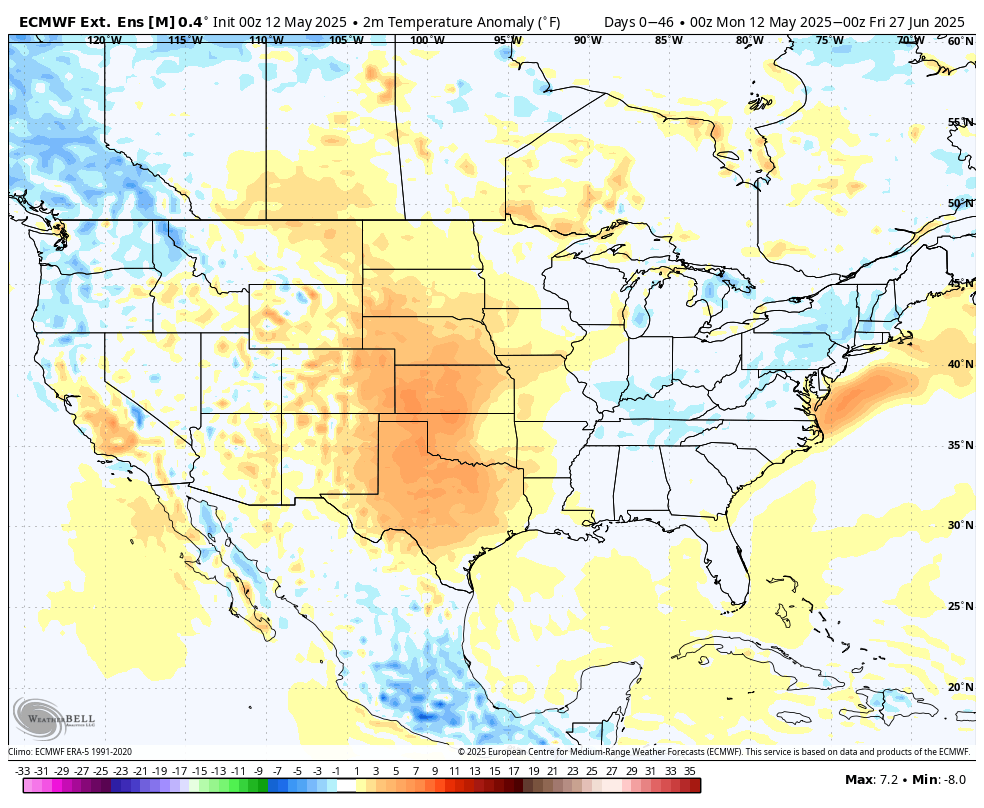
Rain
Is this what reversed wheat higher????
Much of the crop in KS/OK/TX has just reached being headed so the grain fill process has begun. That takes around 2- 3 weeks to complete.
SO FAR, Wheat has been unable to capitalize on the very strong, technical bottom formation from yesterdays huge bounce higher after spiking to near a 5 year low.
The biggest problem may be the huge rains the nest week in the driest areas of the Plains and Upper Midwest, including most of the Spring wheat belt.
Look,at the 7 day rain forecast a few pages up.
7 Day Total precipitation below:
http://www.wpc.ncep.noaa.govcdx /qpf/p168i.gif?1530796126
This will put a major dent in the drought for those areas.
If the wheat had been going straight up and making new highs, this weather is actually a short term selling set up.
However, its the opposite chart formation for that.
There was an attempt to sell the wheat off again early this morning but it ran out of sellers and found plenty of buying.
1. 1 week chart below.
2. 1 year-about to break out above the 3 month bearish/down trend
https://tradingeconomics.com/commodity/wheat
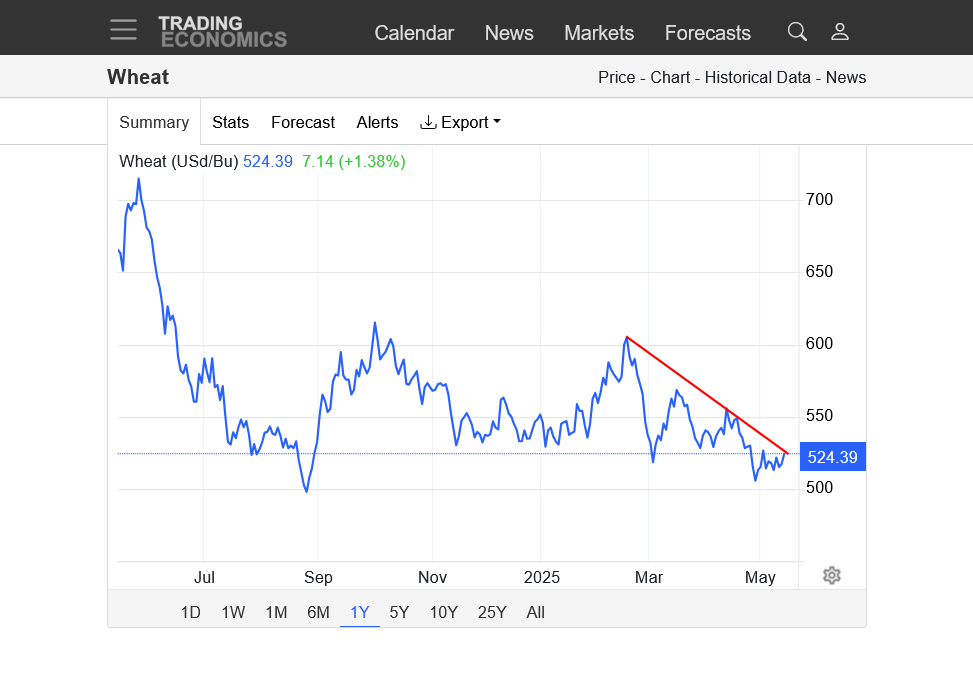
Kansas City/HRW is leading the rebound so the hot/dry outlook for the Southern Plains the next month may be a huge factor.
Huge new-crop U.S. wheat sales last week, led by unknown and Philippines. Old-crop corn export sales also beat expectations with South Korea and Mexico topping the list. Finally signs of life for new-crop bean demand with big sales to Pakistan and Mexico.
Conab raises Brazil's second crop #corn harvest, which is now up 11% on the year. Tight corn stocks are seen recovering to the two-year-ago levels by Jan 2026. Brazil's soy crop was also revised slightly higher.
Beans were blindsided by this on Wed night/Thursday!
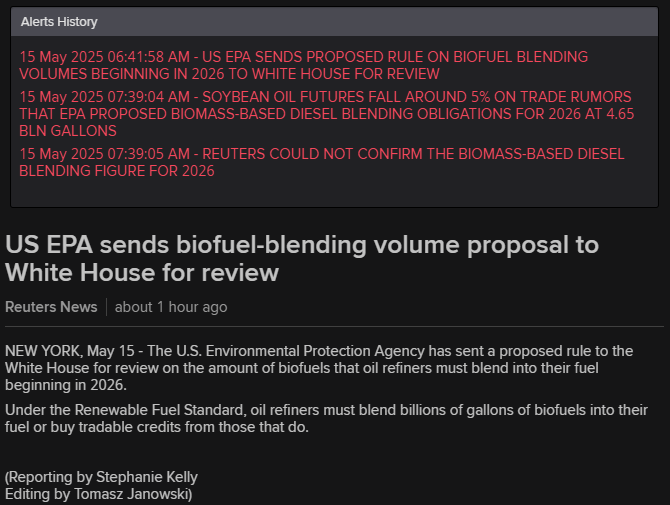
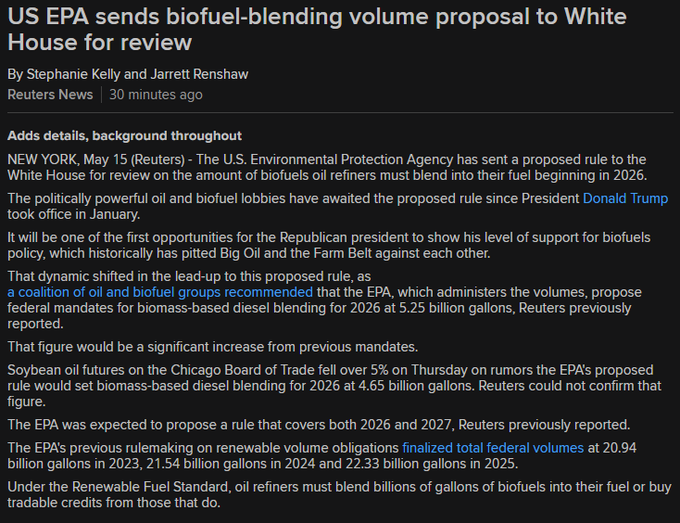
The US EPA has sent a proposed biofuel-blending volume to the White House for review. Bean oil plunged the daily limit overnight into Thursday on the rumored volume obligation for 2026, though as of early Thursday Reuters had yet to confirm that figure.
+++++++
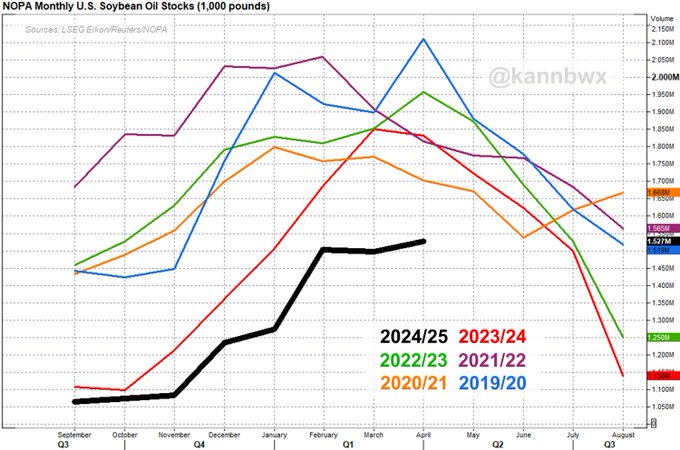
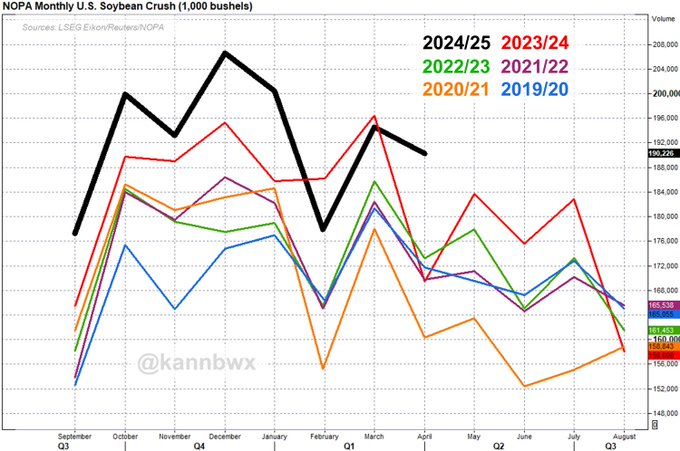
NOPA U.S. crush, April 2025:190.226 mln bu of #soybeans Monthly record; +12% YOYAbove avg trade guess of 184.642 mlnSoyoil stocks 1.527 bln lbsAbove all trade guesses (avg was 1.412 bln)Lowest April oil stocks since 2015
With wheat, was this a major bottom or was it a fake upside break out and just another bear flag/pennant and pause in the move down because of (temporary) strong $5 support?
The chart pattern below is NOT decisive for the bears or bulls.
https://tradingeconomics.com/commodity/wheat
This is getting close to the time frame for the typical seasonal low for wheat. Harvest is coming up, starting in June. Ahead of that, we often see weak prices...in a market that runs out of sellers. EACH YEAR IS DIFFERENT!
Last 6 years:
www.tradingview.com/symbols/CBOT-ZW1!/seasonals/
Seasonality
https://agecoext.tamu.edu/wp-content/uploads/2023/02/Welch-Seasonality.pdf
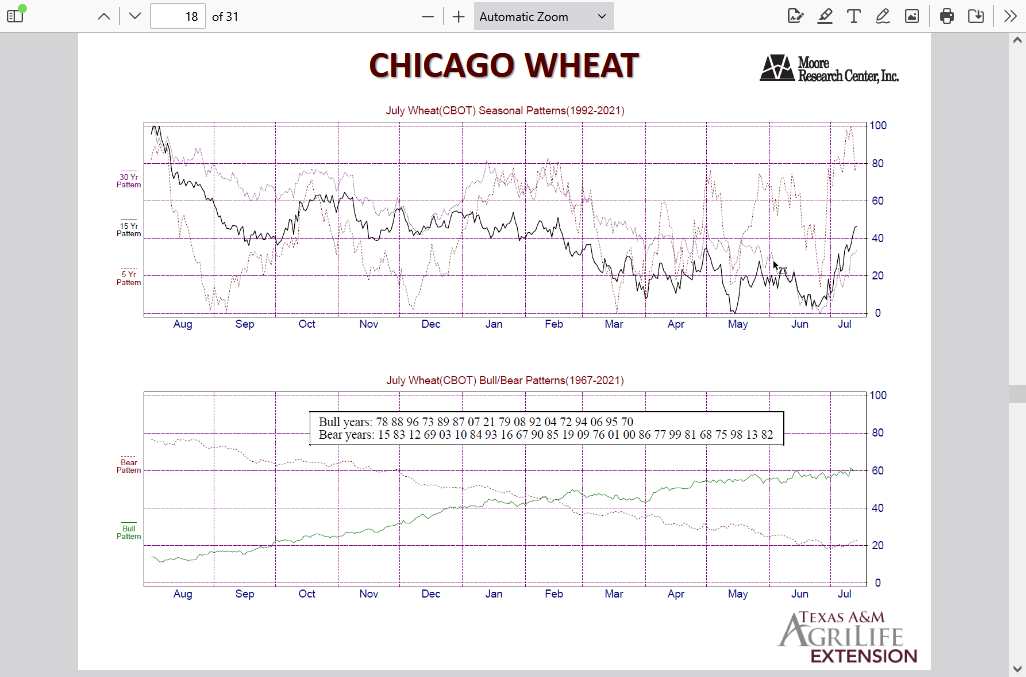
https://agecoext.tamu.edu/wp-content/uploads/2023/02/Welch-Seasonality.pdf
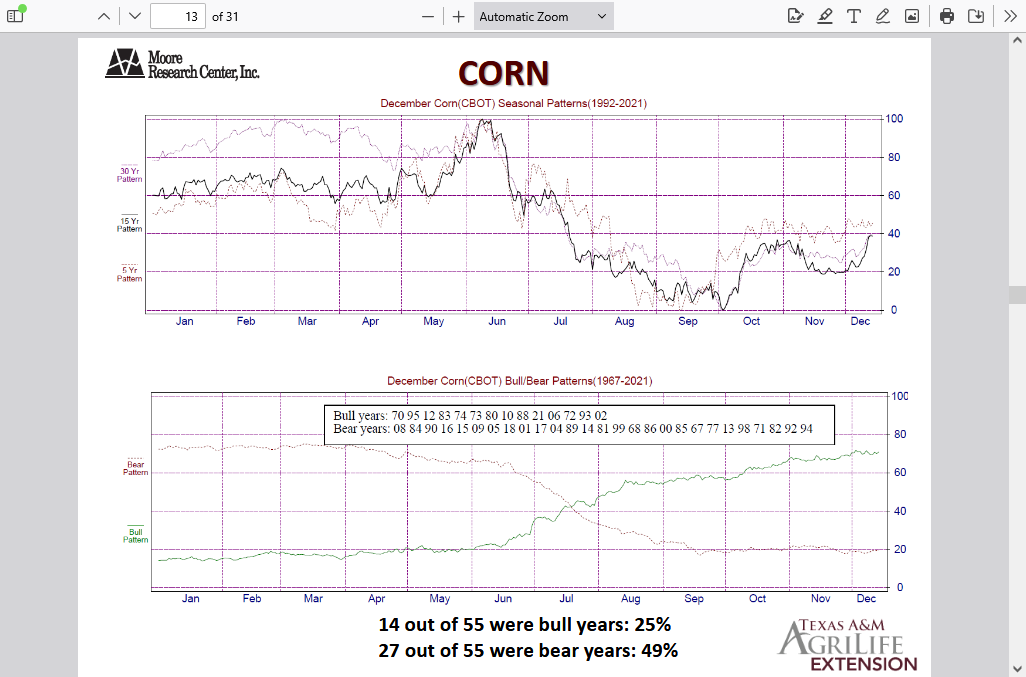
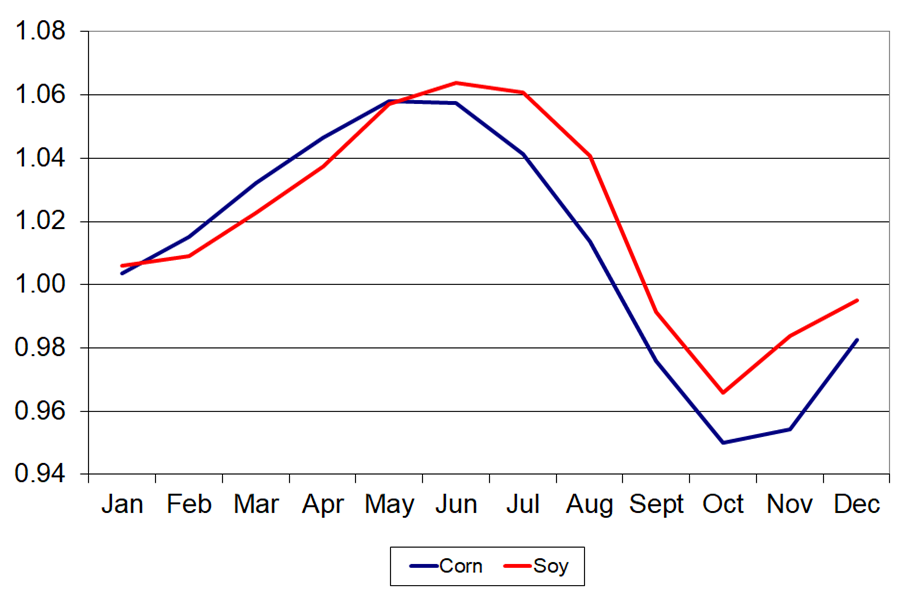
Corn and beans seasonals:
The price of corn typically peaks in early June, after the crop is planted, when the weather is favorable(which is most of the time, thanks to REAL climate change).
EACH YEAR IS DIFFERENT!!!
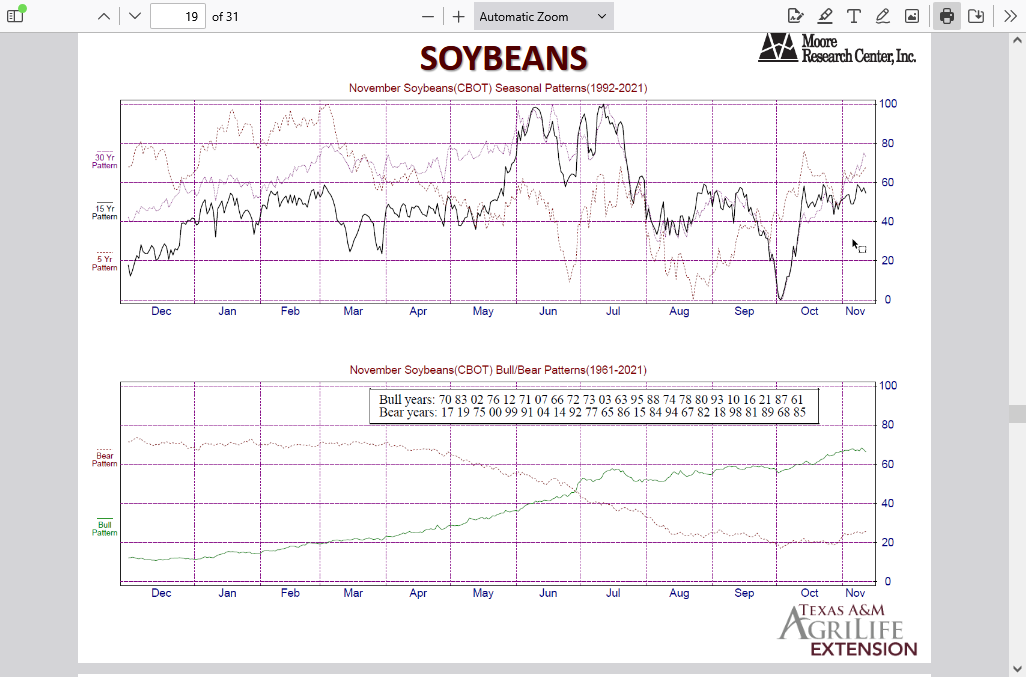
The price of beans typically peaks in June/July, ahead of flowering/pod filling. EACH YEAR IS DIFFERENT!
WN-25 closed -8c which gave the bears a victory after several bullish days. The abrupt retreat at resistance, leaves the potential of this just being another bear flag..........but also, a potential major bottom is still possible after the Tuesday reversal higher, followed by higher closes on Wed/Thu.
Bears won today and still have the long term trend on their side.
Bulls have the reversal higher and very positive weekly price action.
I'm thinking that this recent strength, especially on Wednesday could have been weather related with the overnight models, especially the 0z European model looking pretty dry into the first week in July for much of the Midwest.
However, temps are not that hot......yet!
+++++++++++++
The next 2 weeks will be dry but cool. Heat hits the N.Plains/Upper Midwest in week 2.
https://www.marketforum.com/forum/topic/83844/#83852
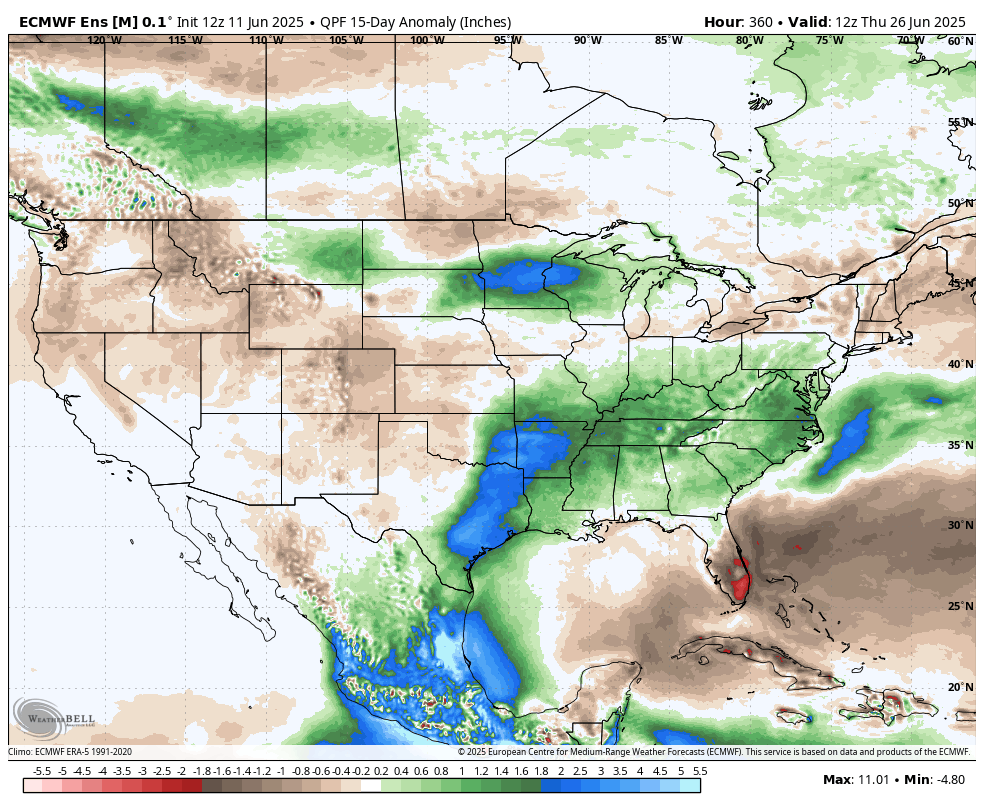
The 360 hour 12z European Ensemble after the close added a tiny bit of rain.
All the weather here:
Eric's awesome weather:
Matts weather:
May 22, 2025: NDVI Update | E Pac Hurricane? | Midwest Dry | Drought Indicators to Watch in June
https://www.drought.gov/current-conditions
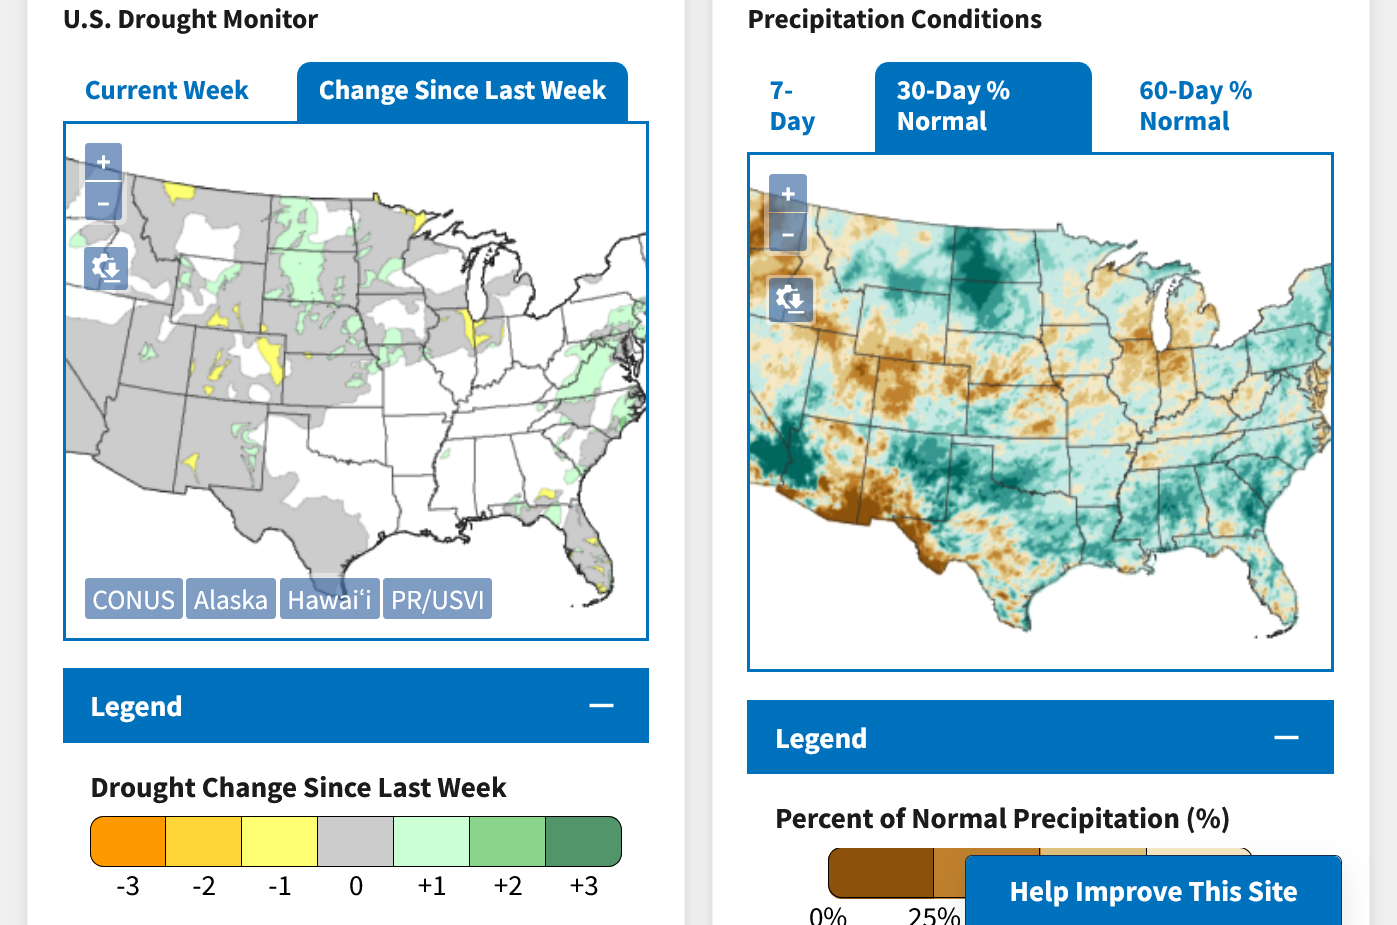
MAJOR drought in Nebraska!
DROUGHT MONITOR
https://droughtmonitor.unl.edu/
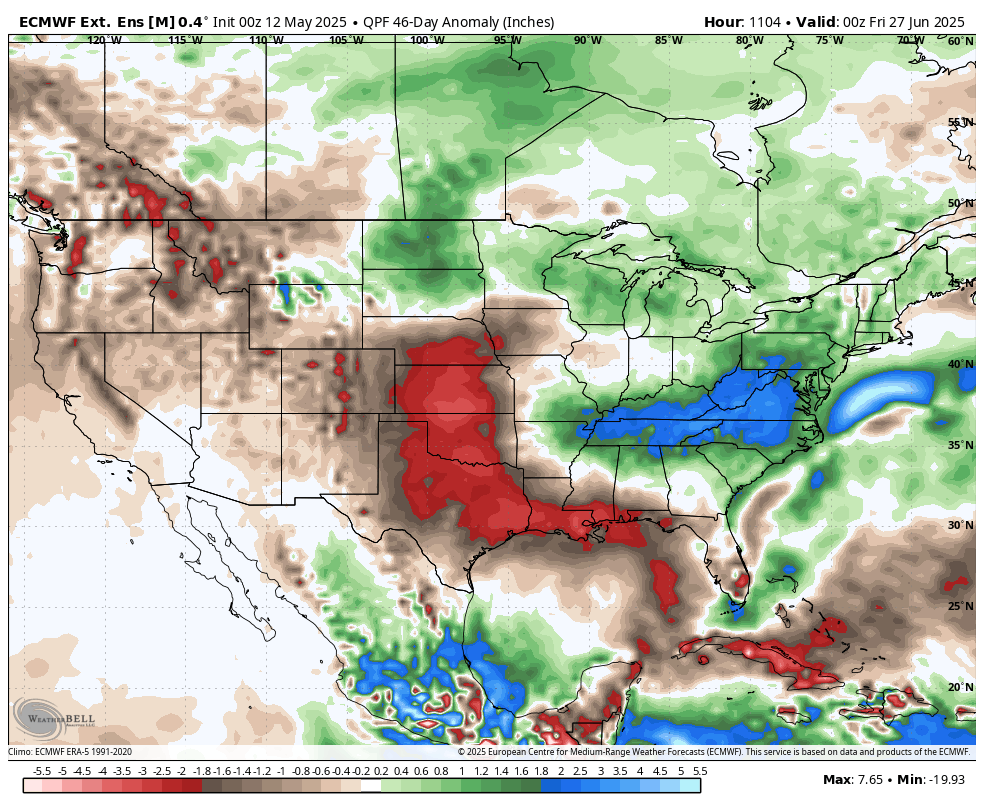
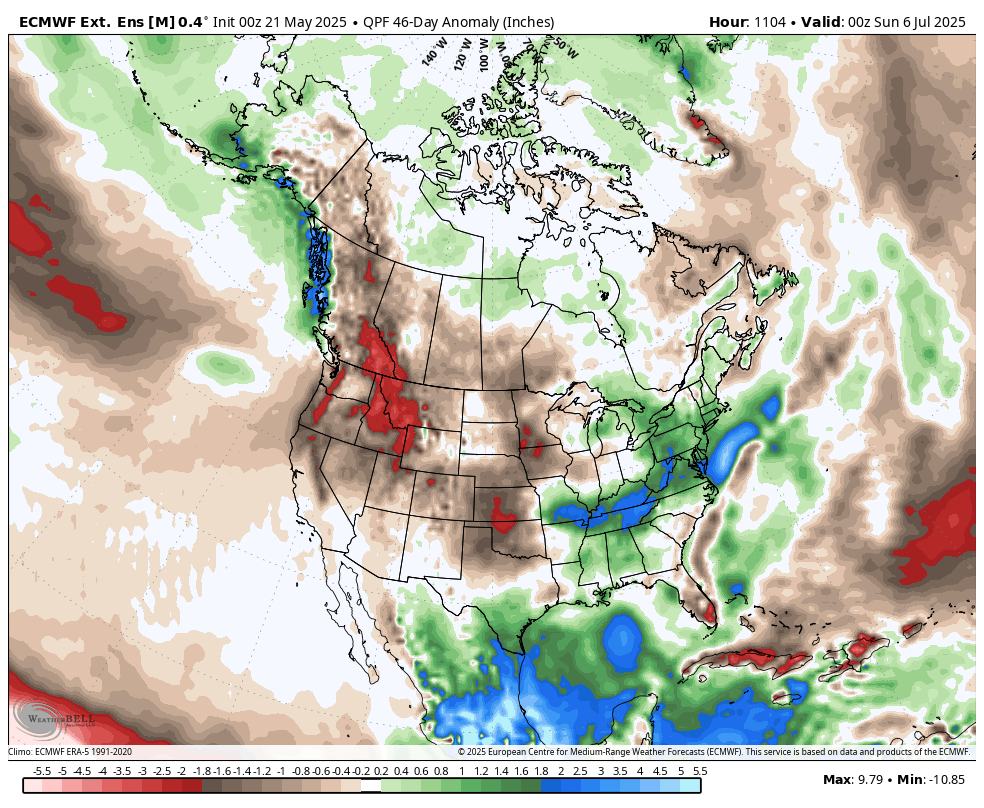
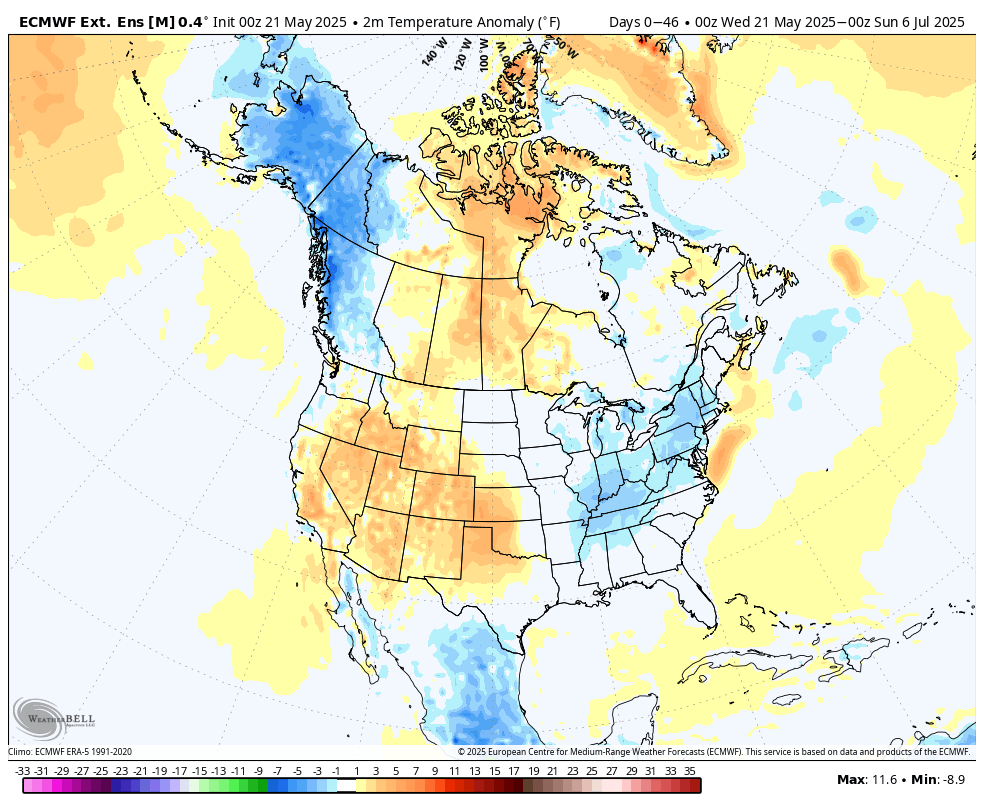
The updated long range 46 day European Model is dry(wet SCornbelt) but with no major heat(cool in the ECornbelt) thru the 1st week in July:
The best weather videos in the world come from Eric but today he delivers a Hall of Fame version on fundamental meteorology that is the best I've ever seen.
May 23, 2025: Why So Windy? | Important Global Trends Since 1980 | Flooding Rains OK/MO/AR/KS...
The markets are closed until Monday evening but the forecasts may turn bullish next week:
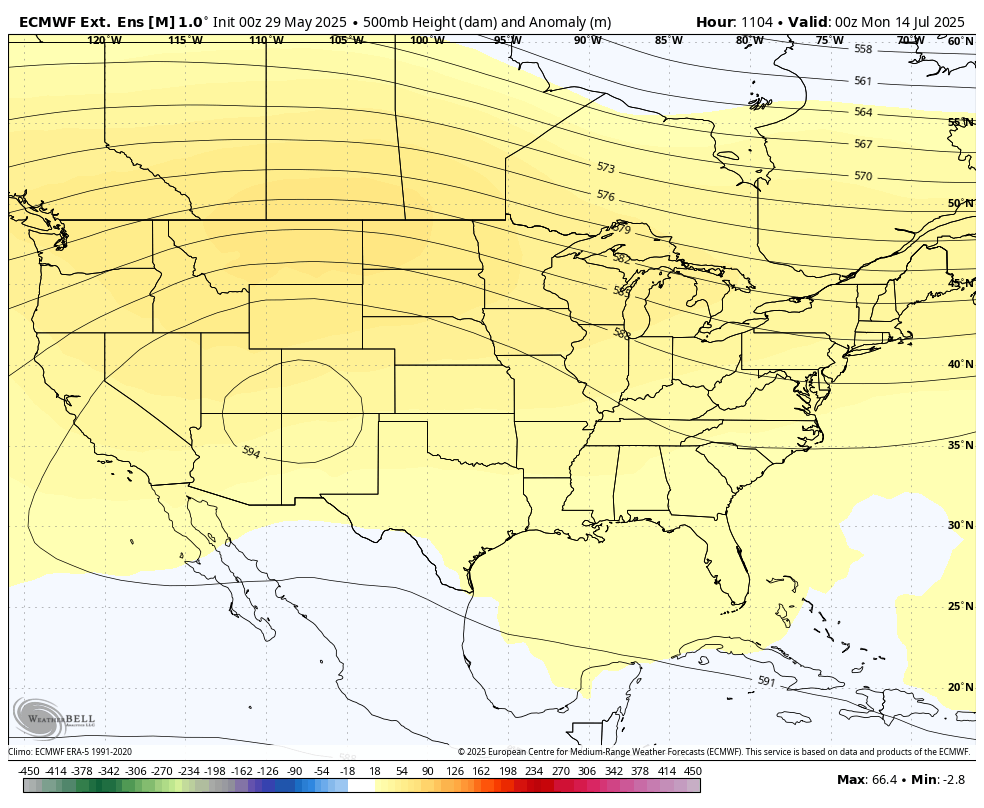
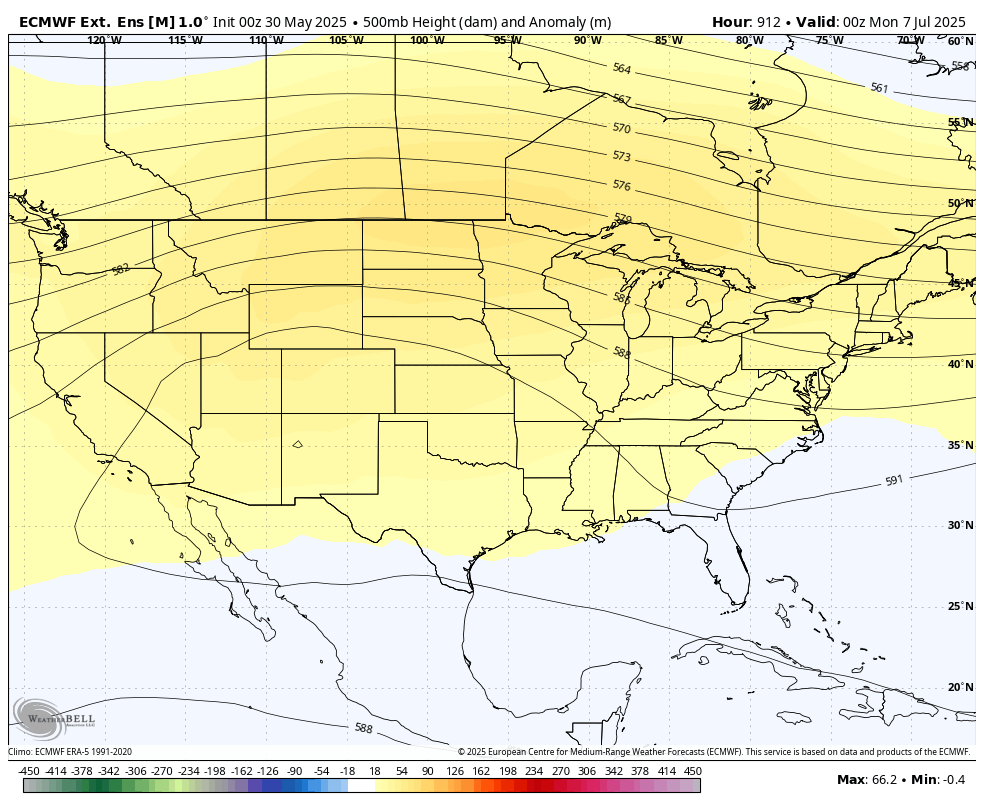
This is the upper level forecast at 500 mb with anomalies in color, at the end of the first week in July from the last European Ensemble model.
Predictions this far out have low skill. However, IF this is close to being correct, corn and beans will likely see some strength from bullish weather in June.
The stronger the upper level ridge is and farther north it is, the more bullish it will be.

Recent extended weather discussion:
Re: Re: Post of the week-Eric Snodgrass
By metmike - May 25, 2025, 3:40 p.m.
+++++++++++
Week 2 models here on Memorial Day 2025 are continuing to get wetter(that started yesterday).
Why is that a surprise. The crop killer is finally saying the forecast is trending wetter. The backpedaling is continuing. Why didn’t he state that there is an equal chance of drought or adequate moisture instead of trying to increase subscriptions by crying drought.
If you fallow Eric you would know that1, he says long range forecast are speculative at best 2, he has said you have to have cold water in Gulf of Alaska for drought risk to grow. which he shows is not there, it is what to watch for, 3, I believe he said something like normal chance of drought is <5%. but he thought this year's chances were maybe 10 to 15% chance.
So why do you call him a crop killer?
vinny,
I've been an operational meteorologist for 43 years and trading/following grains every day for 33 years.
Eric and his assistant Matt, do an outstanding job which is why I show them here with their FREE, extremely comprehensive videos.
Neither of them have any idea who I am and MarketForum gets 0 from Nutrien Ag Solutions.
It's here because it's great stuff!
https://www.youtube.com/watch?v=N4Z4UUO3Sco
++++++++++++++=
Another source, BAM weather(can't hold a candle to Eric):
https://www.youtube.com/watch?v=K5Nuqk8jCBk
Max Velocity:
The the first corn crop rating was 68% G/E, which was around 5% less than the market expected. So corn will open higher, especially December.
Winter wheat condition dropped 2% to 50% which was still 2% better than last year/2024.
Spring wheat's first crop rating was only 45% which is not that good. Not sure what was expected.
Worst ratings in the P/VP were MT-18% and ND-26%.
Mississippi cotton was only 43% planted vs the 77% average because of the wet weather.
Wheat is the only one that did well overnight, with Spring (MWE) wheat still +9.5c as we wait for the day session to open. Poor initial conditions for the MINN wheat on the crop report are the main reason.
Dec Corn opened higher at 447 on an initial condition -5% vs expectations, got to 449.5 but is back to 447 at 8am.
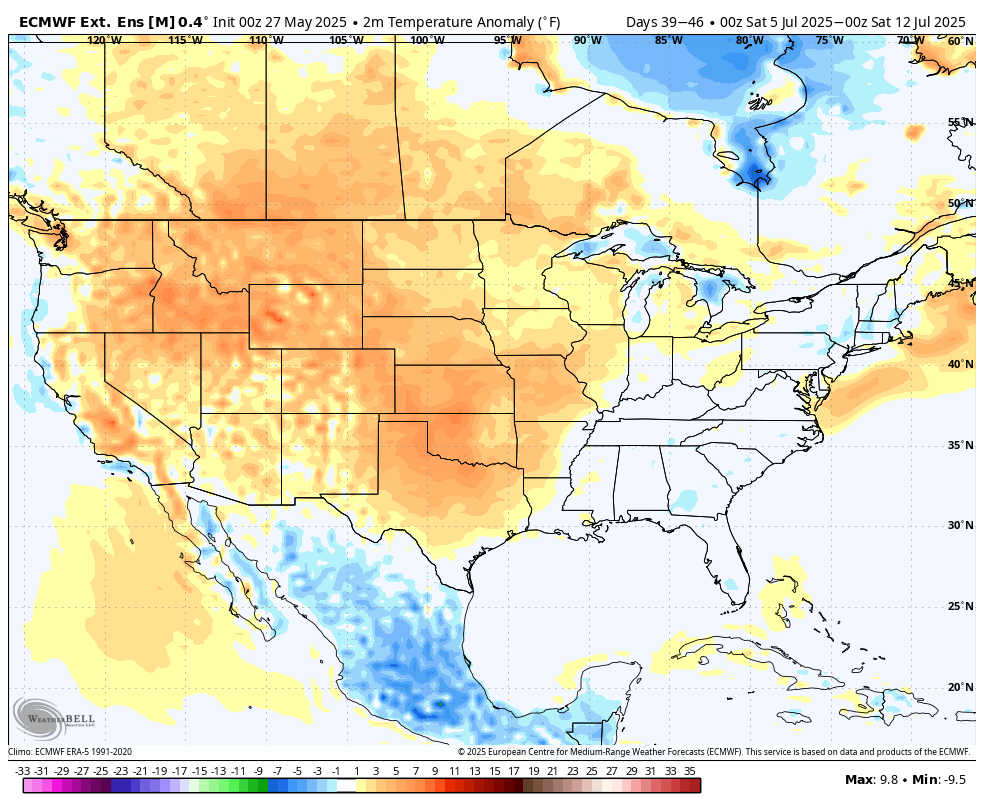
The end of week 1 will turn wet for the Cornbelt, then rains shift from northwest to southeast. However, the end of week 2 will feature upper level ridge building and increasing heat in N.Plains/WCB.
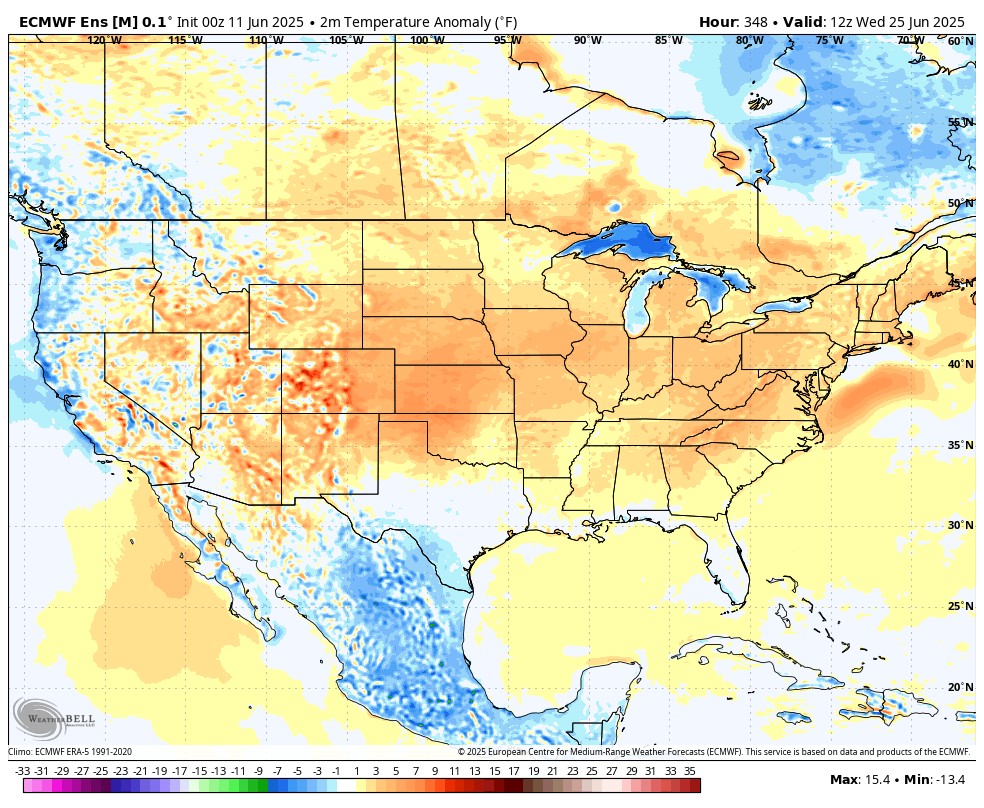
This is what the temperature anomalies during the 2nd week of July look like from the last European model:
https://www.youtube.com/watch?v=Kw6mAJiy_iQ
+++++++++
BAM weather
https://www.youtube.com/watch?v=19z85ZWecrs
+++++++++++
WeatherBell
https://www.youtube.com/watch?v=DkDqaEilhCc
++++++++
Josh's weather:
https://www.youtube.com/watch?v=O-CBfqt6ox8
https://www.youtube.com/watch?v=Upmedn7vCCU
+++++++++++++++===
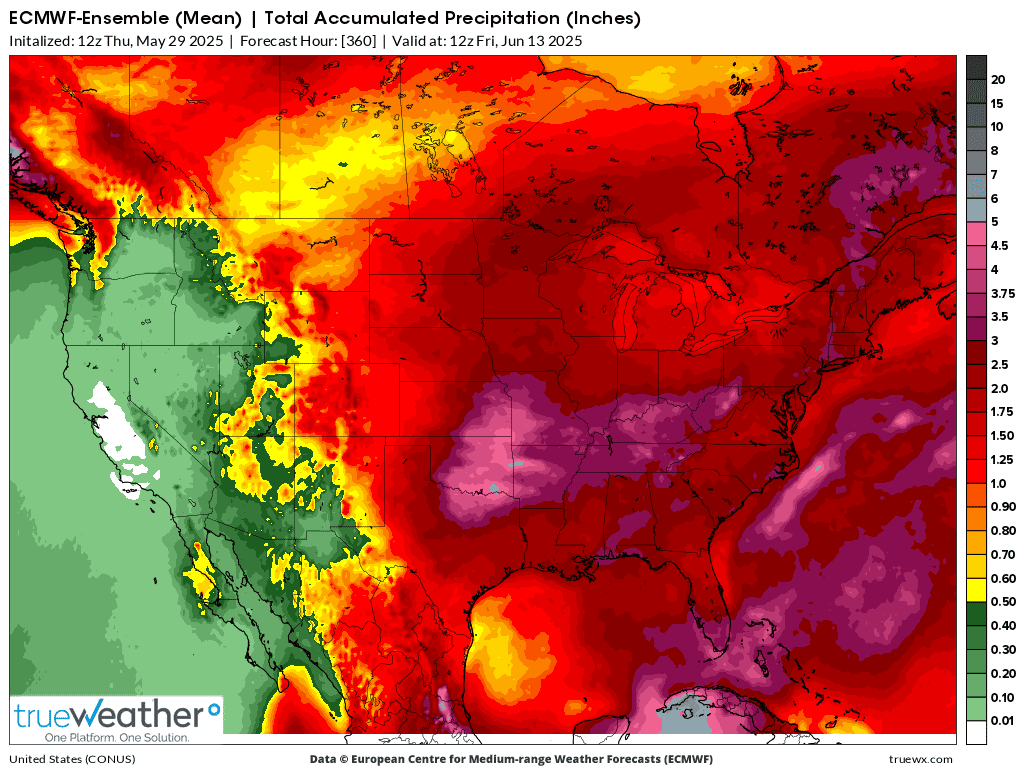
European model 2 week rains from the last 12z model. Bearish for C and S from the amount of rain in the Midwest.
Eric's awesome weather: Brown ocean effect from wet soils in the South!
I will disagree with Eric on the type of drought that COULD happen this year.
It will spread from west to east NOT south to north and be a function of the upper level high having a position farther west, like this in early July.
The intense hot and dry winds come from the Southwest US and blow across the Rockies towards the N/C.Plains and WCB.
HOWEVER, perturbations coming around the periphery of the high, then tracking across the Midwest with northwest flow are the best chance to keep the drought from developing or/and expanding.
This is the 2nd week in July and has very low skill. A small shift in the position in this upper level high will mean alot.
Beneficial man made climate change and no La Nina this year reduce the chances of a widespread Midwest drought.
May 30, 2025: Dreaming About Iowa… | Canadian Wildfire Smoke | Very Active Pattern Continues, but..
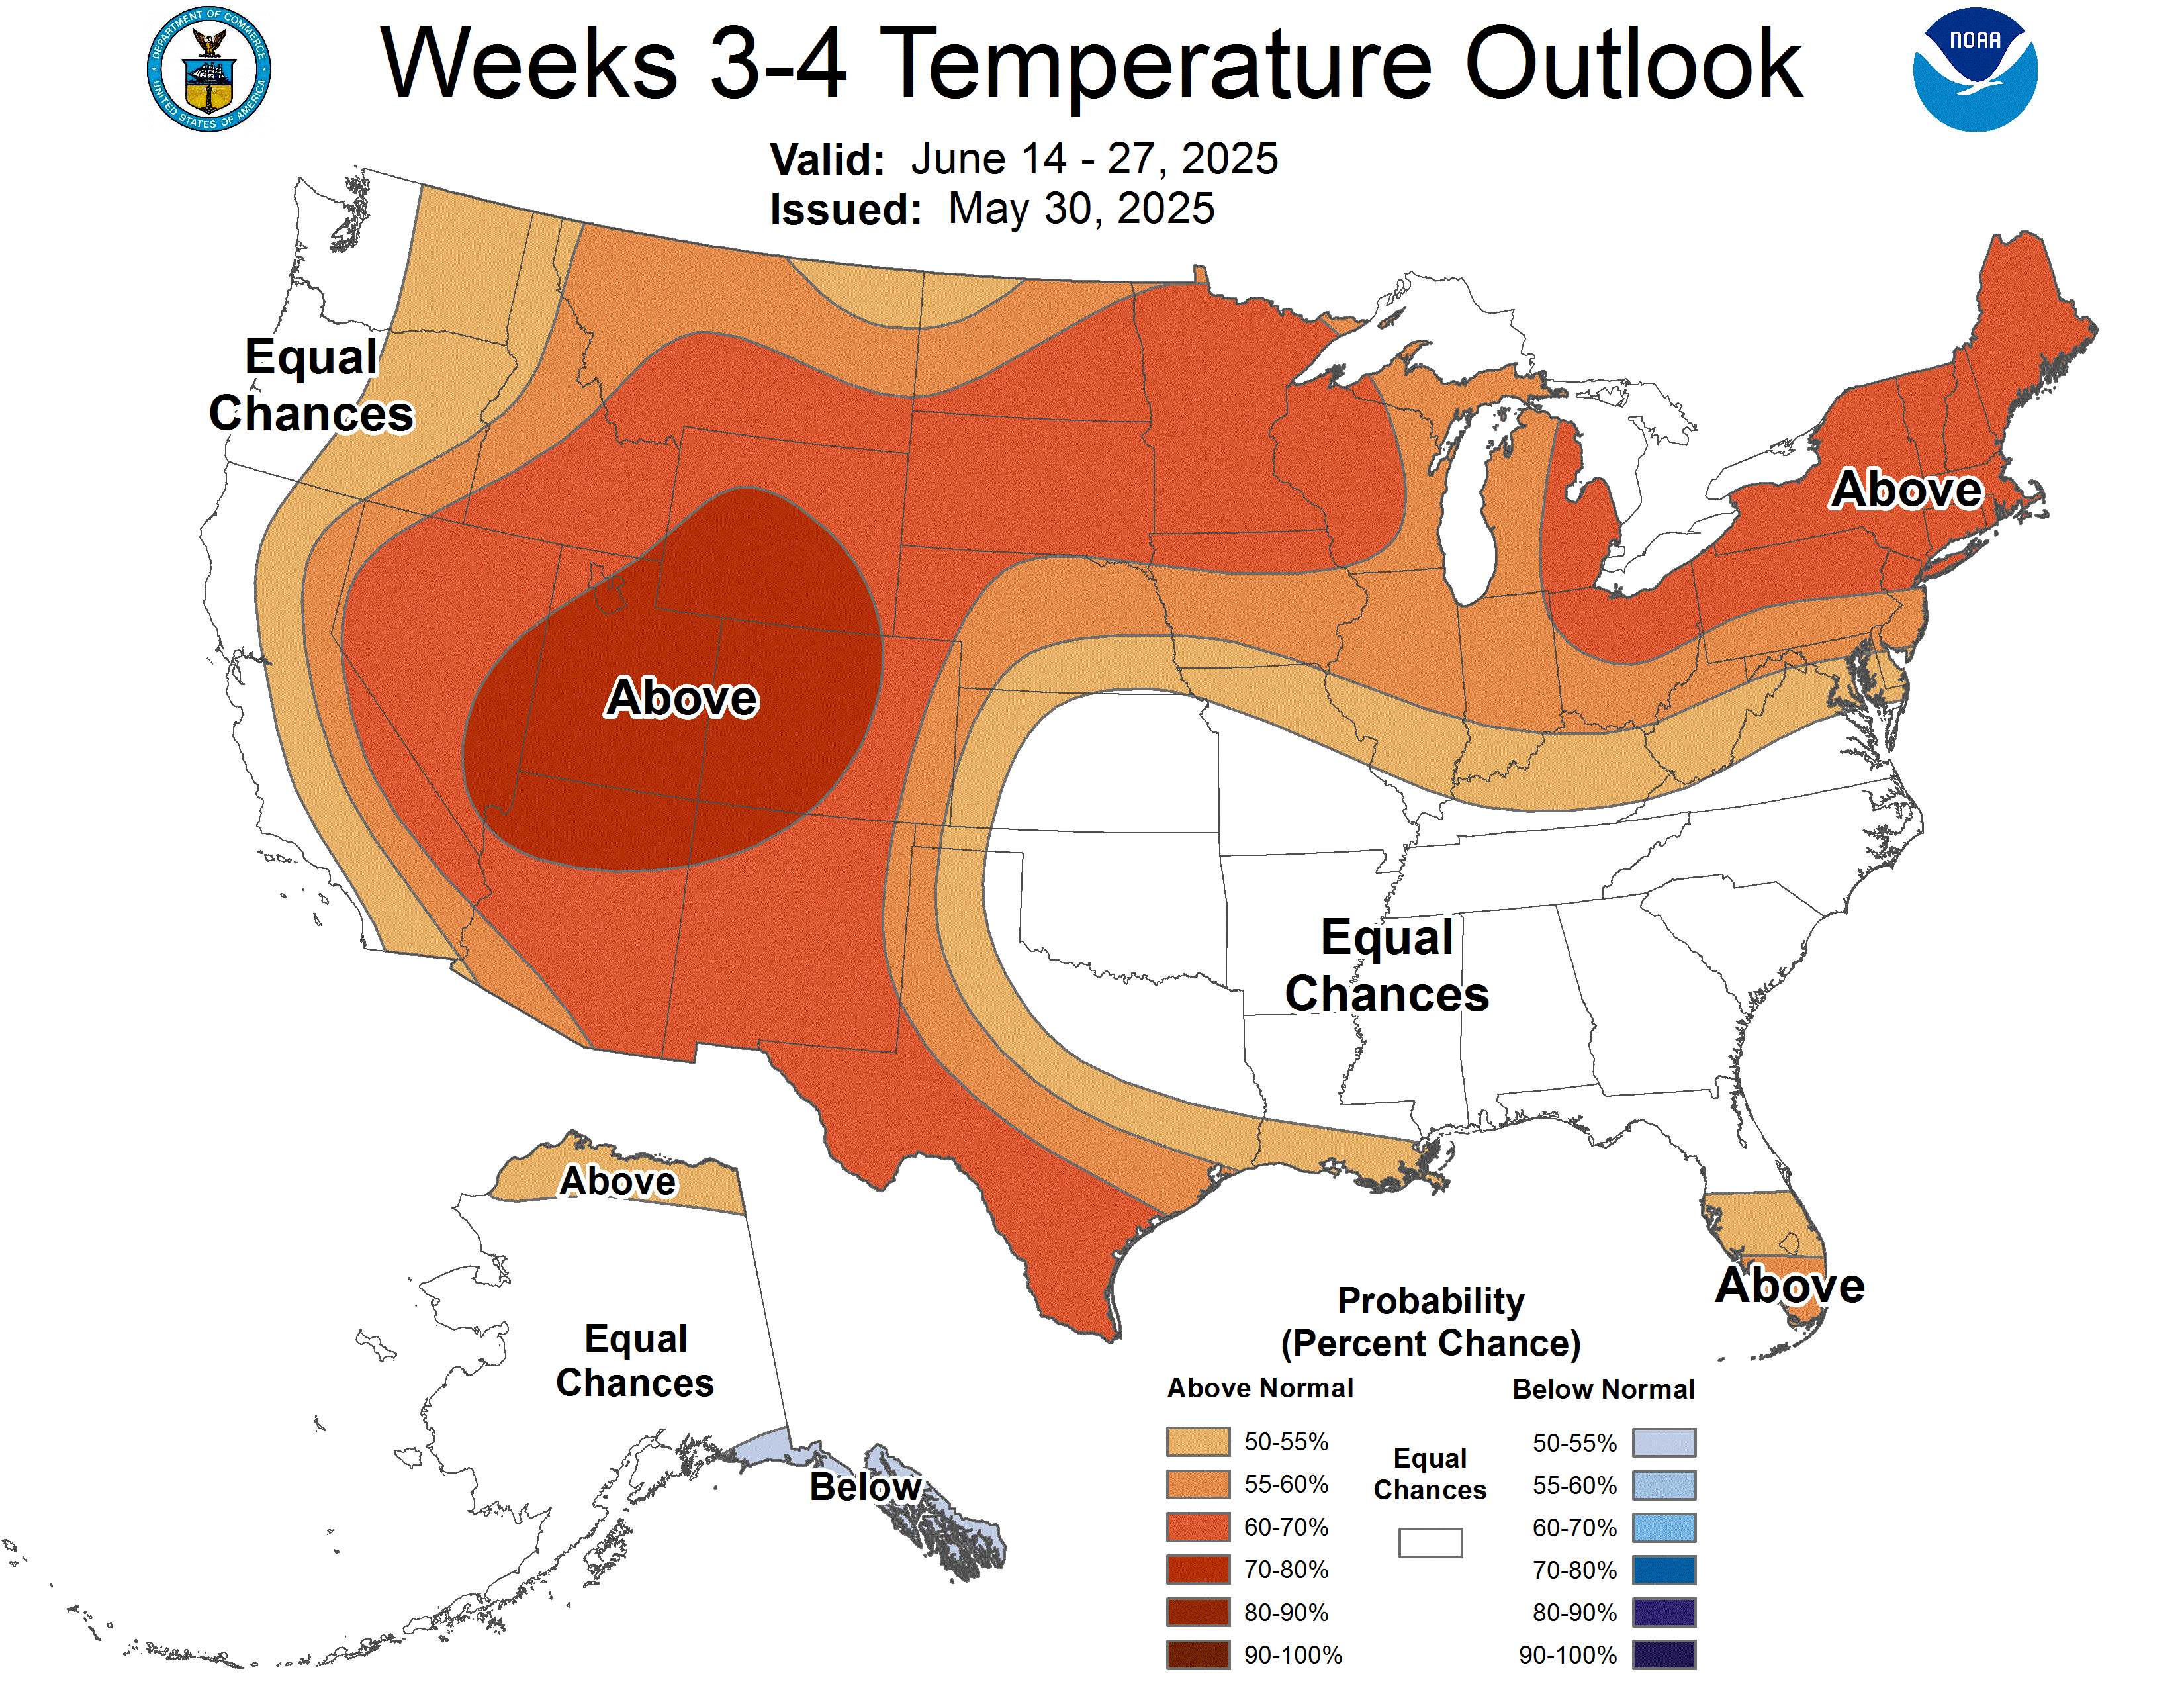
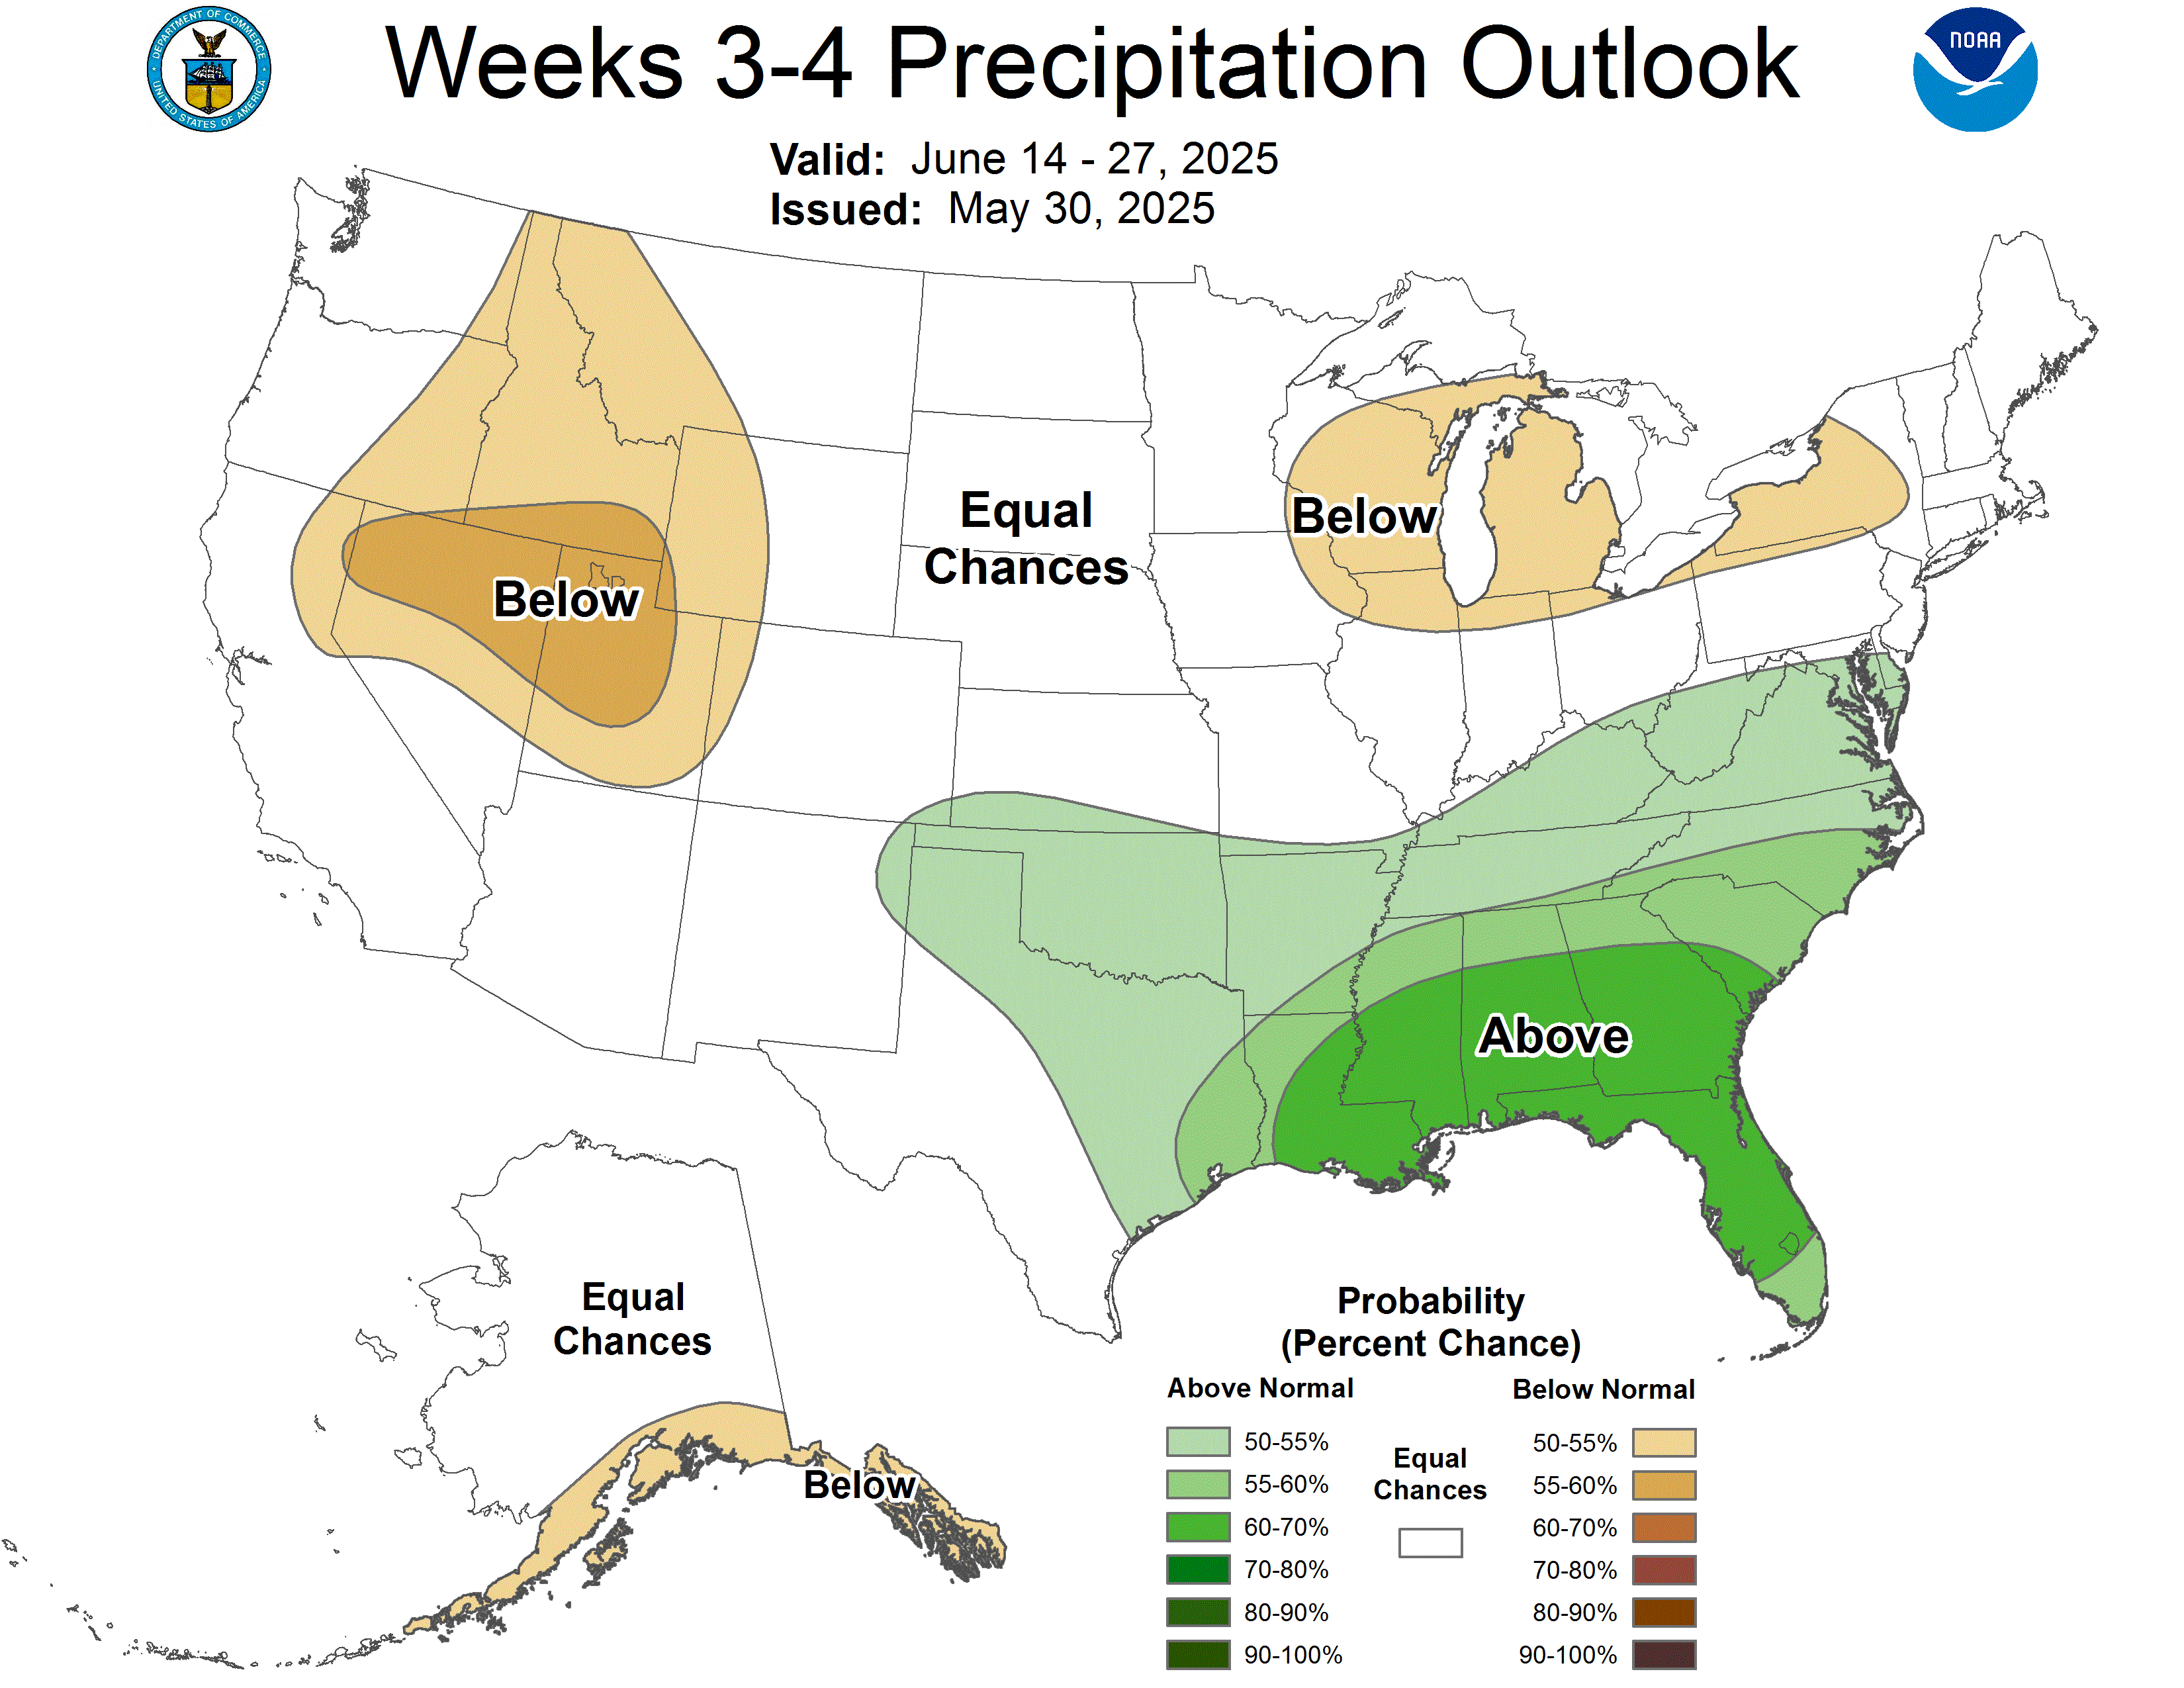
Week 3 & 4 is a low skill time frame. However, I agree with this assessment.
Heat coming from the Southwest and spreading into the N/C Plains/northern tier.
Rainfall is very uncertain. Even compared to normal. Places that experience rainfall deficits AND the heat will dry out quickly.
However, northwest flow is especially tricky to forecast in the Midwest in June/July. With impossible to see perturbations (at this time frame) tracking around the periphery of the Dome farther southwest often being very productive if surface moisture farther to the south can return north, below the the destabilized upper level.
https://www.cpc.ncep.noaa.gov/products/predictions/WK34/
This will enhance rainfall amounts next week in the Midwest, including NE and surrounding dry areas.
Eastern Pacific Tropical Storm Alvin
Started by metmike - May 30, 2025, 4:27 p.m.
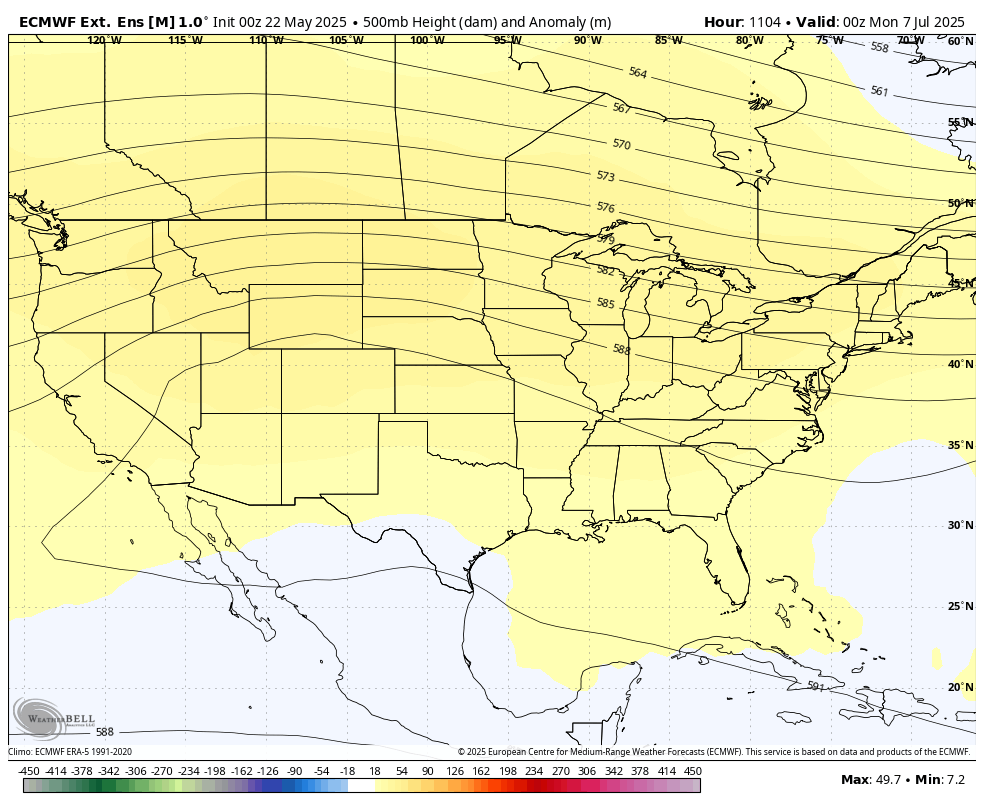
Last 500 mb 46 day forecast map from today's European model on July 15th.
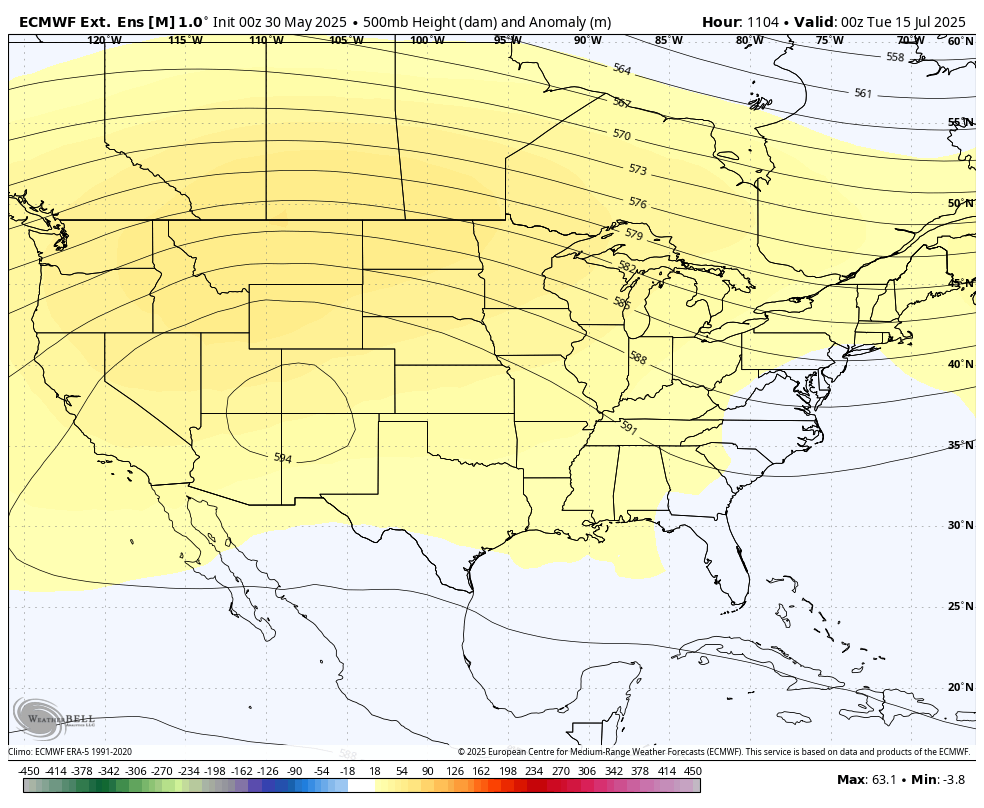
This is the last forecast for July 7th
This was the last European model for July 7th, made 8 days earlier.
This should be compared with the map directly above to see if the mid July forecast is staying consistent. It is and in fact the July ridge has strengthened a bit over the last week.
So the first week of June has turned out much more bearish than what it was predicted to be but July is still looking pretty bullish for the Plains and WCB.
Some extreme pulls from weather today and extremely volatile trading. Huge rains this week some in dry places, heaviest in already wet places but potential heat dome in week 2. The near term rains are dominating for C and S, especially since NE, which needs rain (and heat) the most will be getting a big soaker!
7 Day Total precipitation below:
http://www.wpc.ncep.noaa.govcdx /qpf/p168i.gif?1530796126
++++++++++++=
This was the last 0z European Ensemble, last map at 360 hours. Major upper level ridge building north into the Great Lakes.
What's interesting is that the individual ensemble members are not in very good agreement on what the means for temperatures or precip: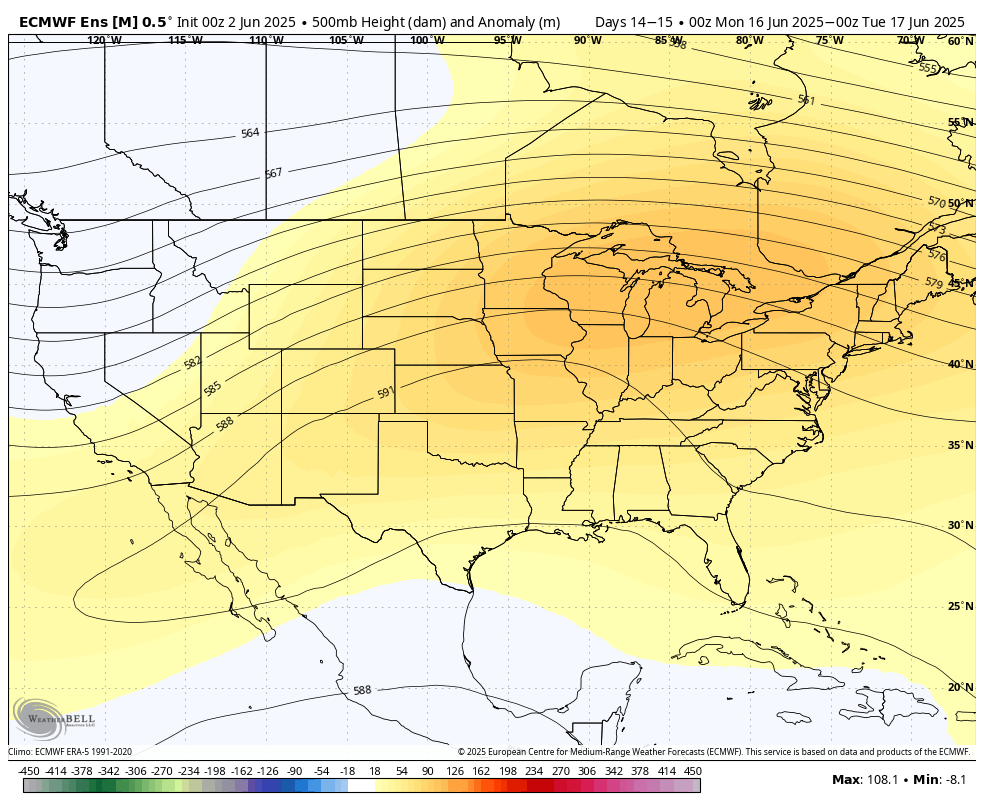
I was focusing alot of the day on natural gas. Sorry that I failed to mention Trumps latest tariff statements hurting the beans a great deal. Also heat for the Cornbelt after a near record cool May is initially a good thing.
It's going to be very tough to build a dome of death when the ground is so wet in the southern half of the country acting like a "brown ocean" moisture source for air masses coming from that direction and with tightly packed rows of corn.
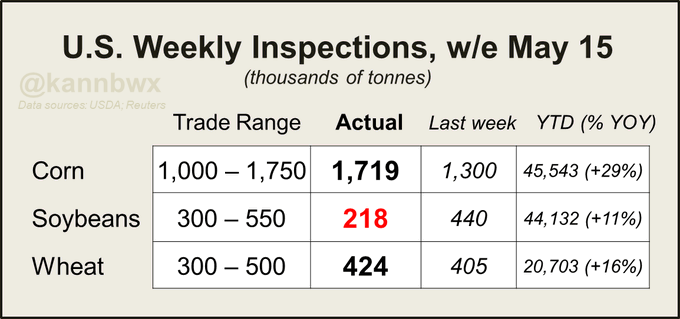
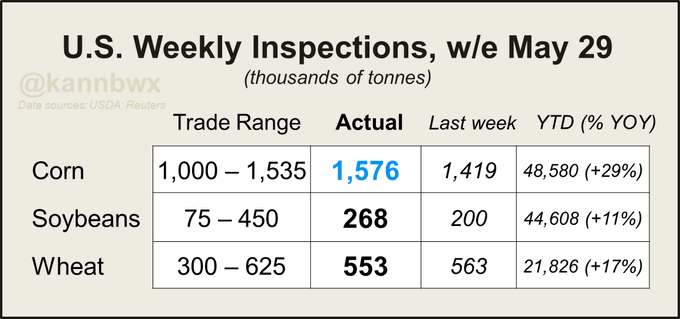
U.S. corn export inspections beat expectations last week while soybeans and wheat fell in line with them. One bean cargo was inspected at the Gulf for China. Wheat inspections likely ending the 2024/25 marketing year up 17% on the year - USDA's export forecast is +16% YOY.
Karen Braun
@kannbwx
·
May 30
Funds staged a record selloff in CBOT #corn from late Feb to mid-May, initially driven by extreme economic uncertainties then perpetuated by fundamentals. But the growing stockpile scenario was already expected. Makes you wonder what it would look like if not for the tariffs...
·
9,194 Views
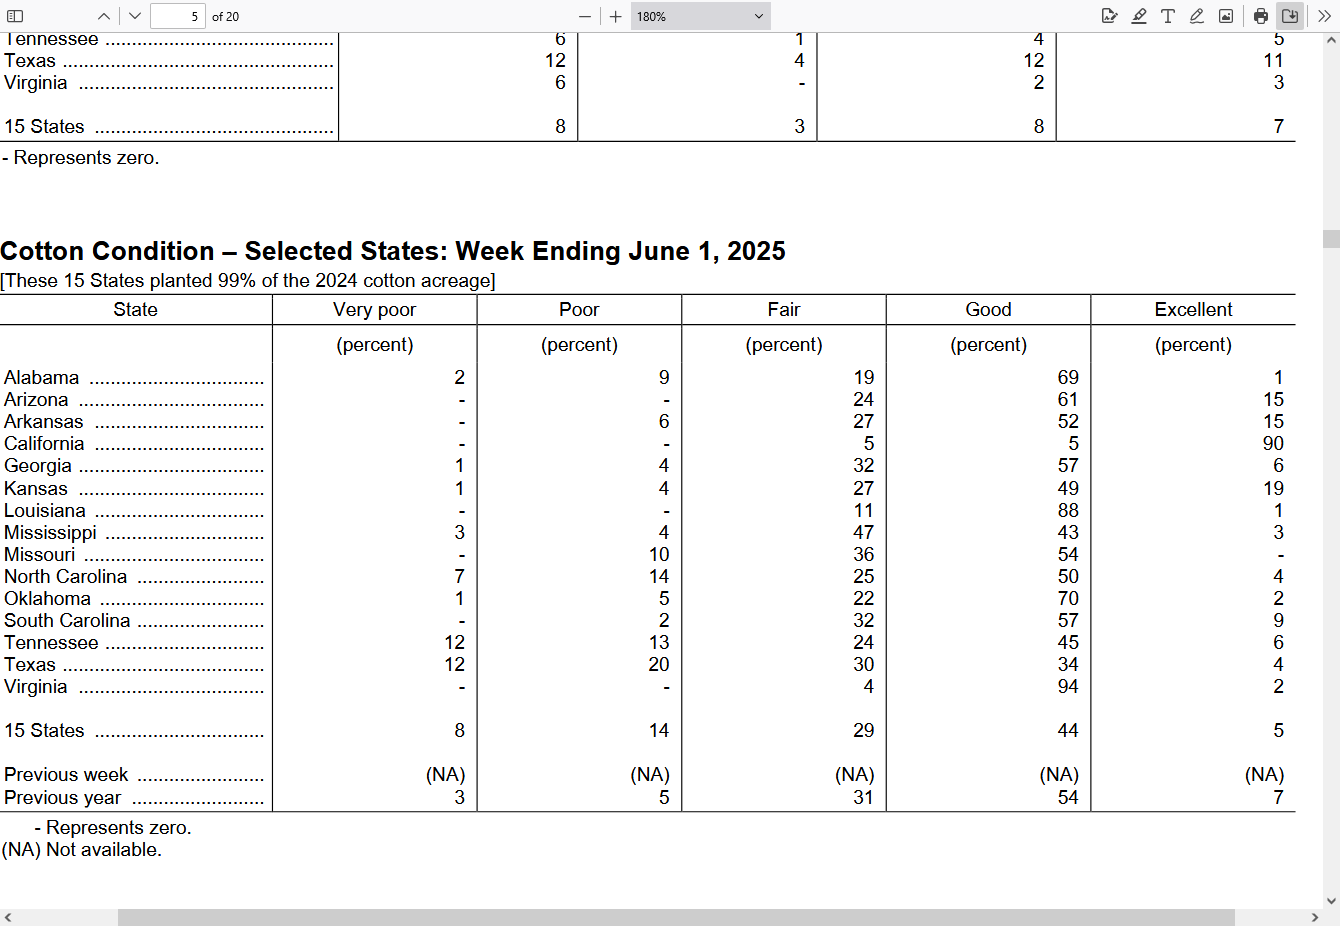
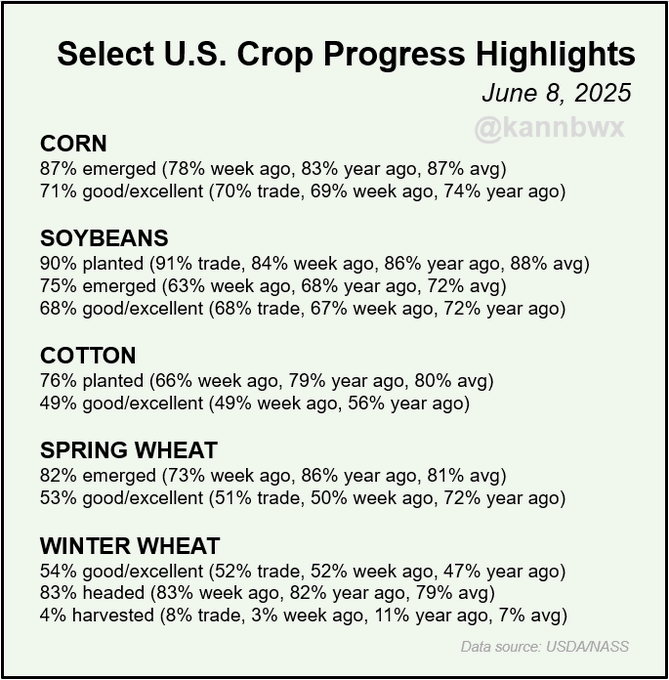
U.S. soybean conditions come in just below trade expectations, corn ratings rise as expected. Spring and winter wheat conditions rose more than expected, but cotton ratings are notably off the year-ago level. Winter wheat harvest has just begun.
+++++++++++++++++++++++
metmike: See the full report here: https://release.nass.usda.gov/reports/prog2225.pdf
This is what stands out the most for me: 22% of the cotton crop is P/VP. This compares to just 8% P/VP last year.
Double digit P/VP states were AL, MO, TN and TX.
G/EX was 49% compared to 61% last year.
Best weather video on the internet with Eric today:
Matt is in today:
June 4, 2025: What's a Worst Case July Look Like? | Mid-South Severe Threat | MJO | Cool Midwest
https://www.youtube.com/watch?v=AYY0_WFWreA
+++++++++++++++++++++++=
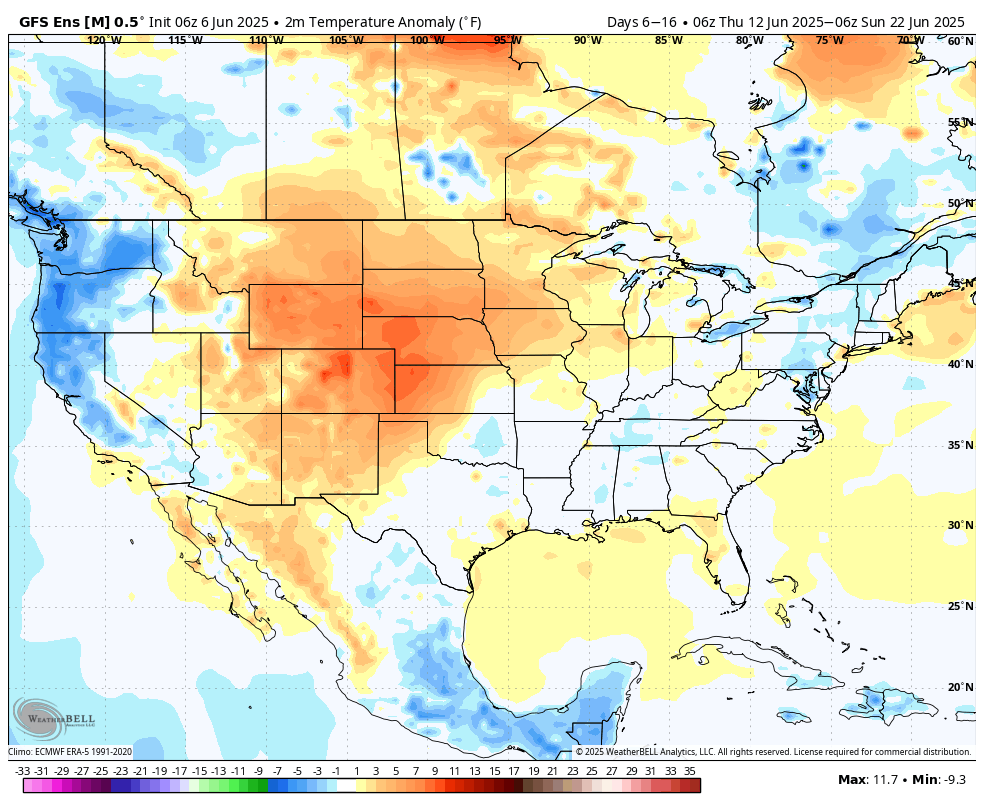
metmike: Huge heat dome coming later in June may turn the grains bullish.
This was the last 360 hour map from the just out 12z European Ensemble model.
Big heat is a given. How much rain is very uncertain. 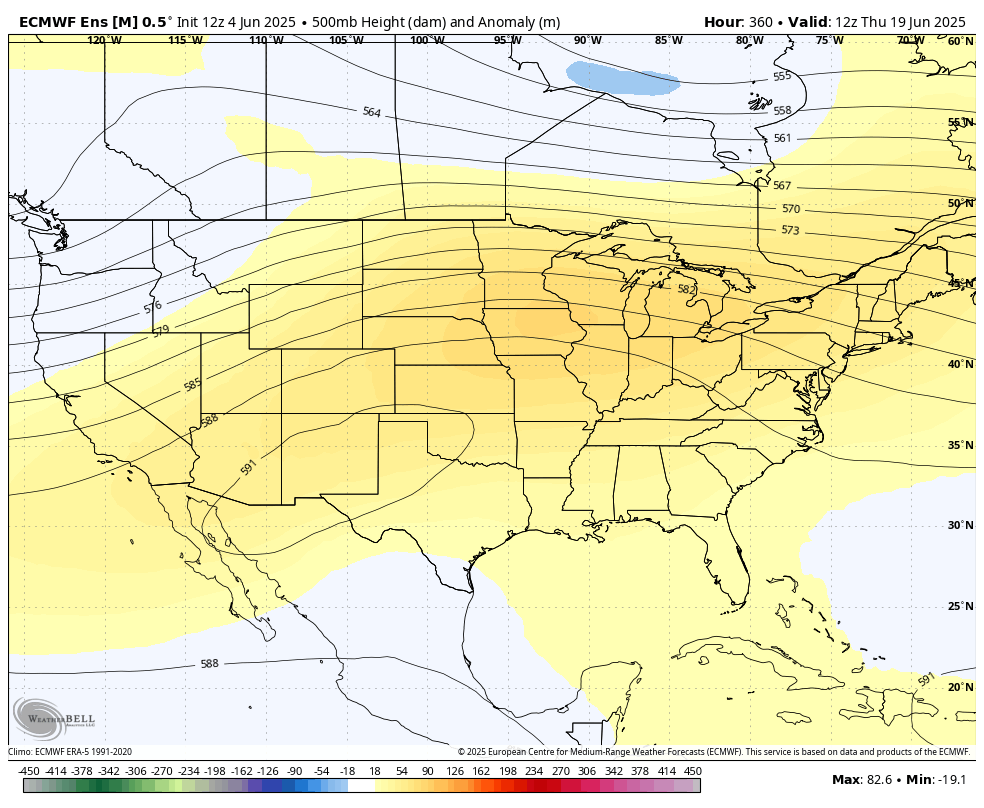
Snodgrass Gives Summer 2025 Ag Weather Outlook With Eric Snodgrass
https://www.youtube.com/watch?v=I1oXyHCIJ-c
+++++++++++++++++++++
Matt is in today:
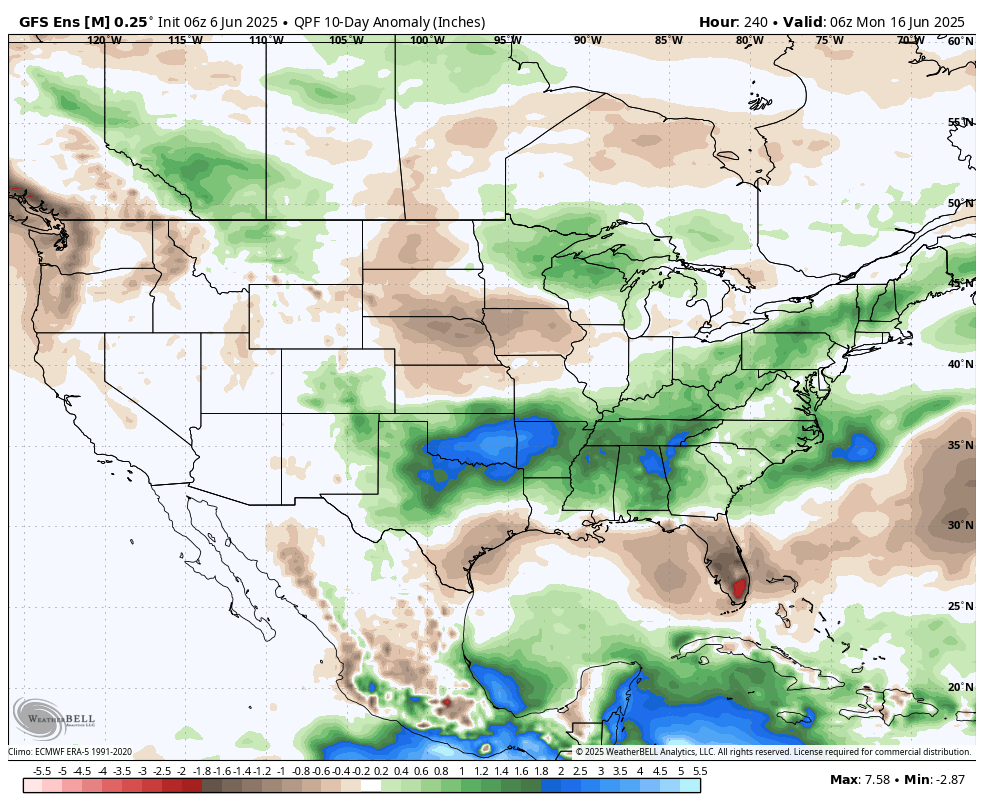
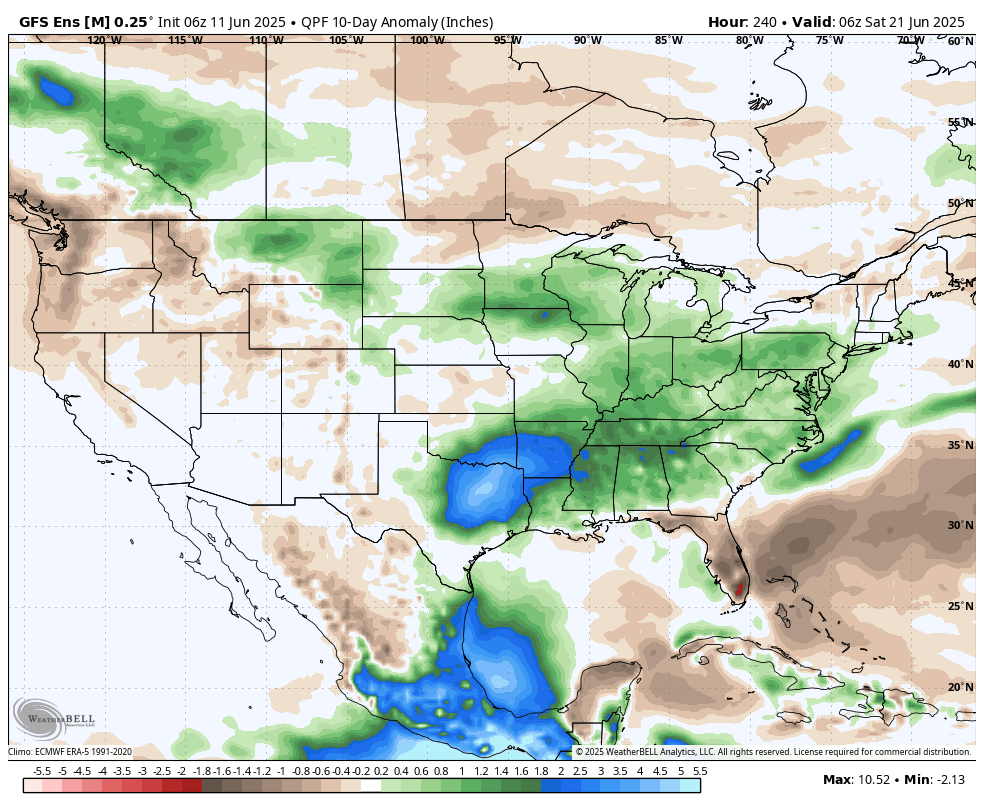
These are the rainfall anomalies for the next 10 days from the just out 6z GEFS. Drier than average in NE/IA!
These are the temp anomalies the next 10 days. Below average with the heat still West.
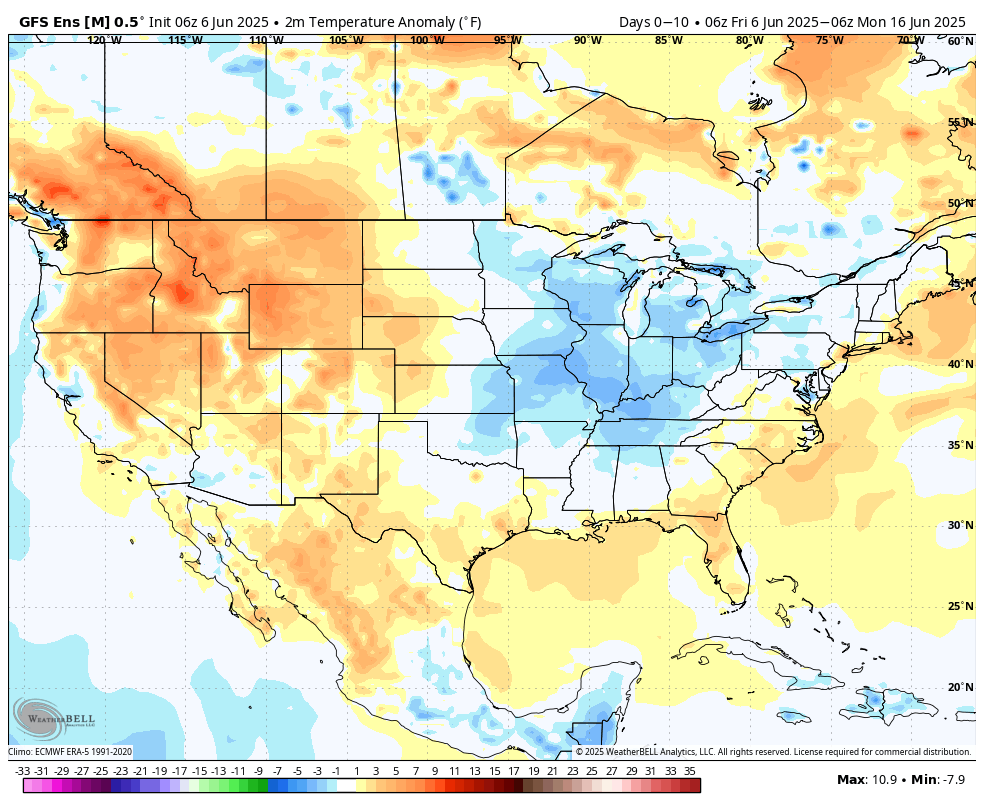
Day's 6-16 Here come da heat!!!
 6-16 day rainfall anomalies:
The heat pouring in and negative anomalies turn the weather bullish/net drying in NE/IA.
However, the last 0z European model has northwest flow and increasing rains for week 2, June 14-21 without the pronounced dry pocket in the Western Cornbelt(closer to average in the driest spots).!
U.S. export sales were all as expected last week. Wheat starts 2025/26 with the best sales in 12 years. Although far from the highest guess, old-crop corn sales are still safely above weekly averages. New-crop bean sales are tied with last year for a 20-year low for the date.
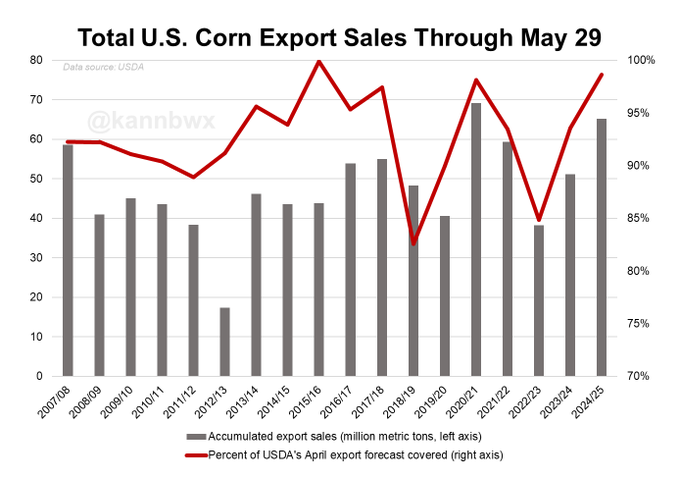
The hefty U.S. #corn export goals for 2024/25 are definitely playing out. With 3 months left, export sales totaled 2.56 billion bushels, some 99% of USDA's full-year target. That's the most coverage by this date in 9 years.
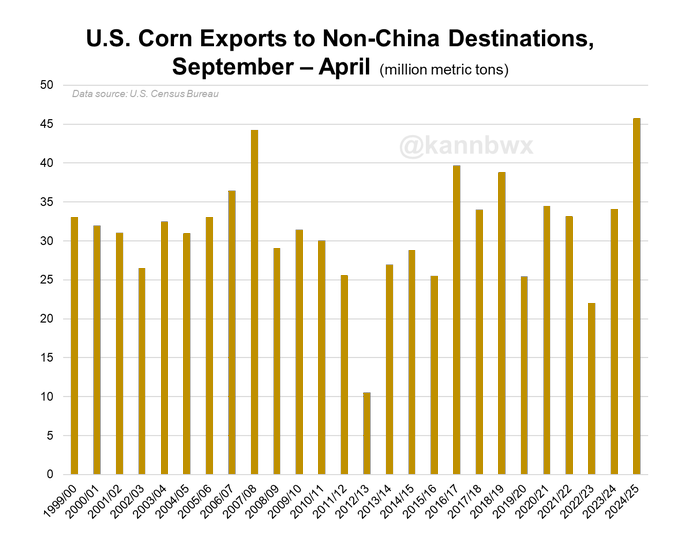
In the first 8 months of 2024/25, the USA exported a record 45.8 million metric tons (1.8 bbu) of #corn to destinations other than China. When including China, the 45.8 mmt for 2024/25 is second best for the period, just 1% off 2020/21's high.
Here's what the chart looks like when China is included. 2024/25 is slightly below 2020/21, but the impressive performance is undeniable.
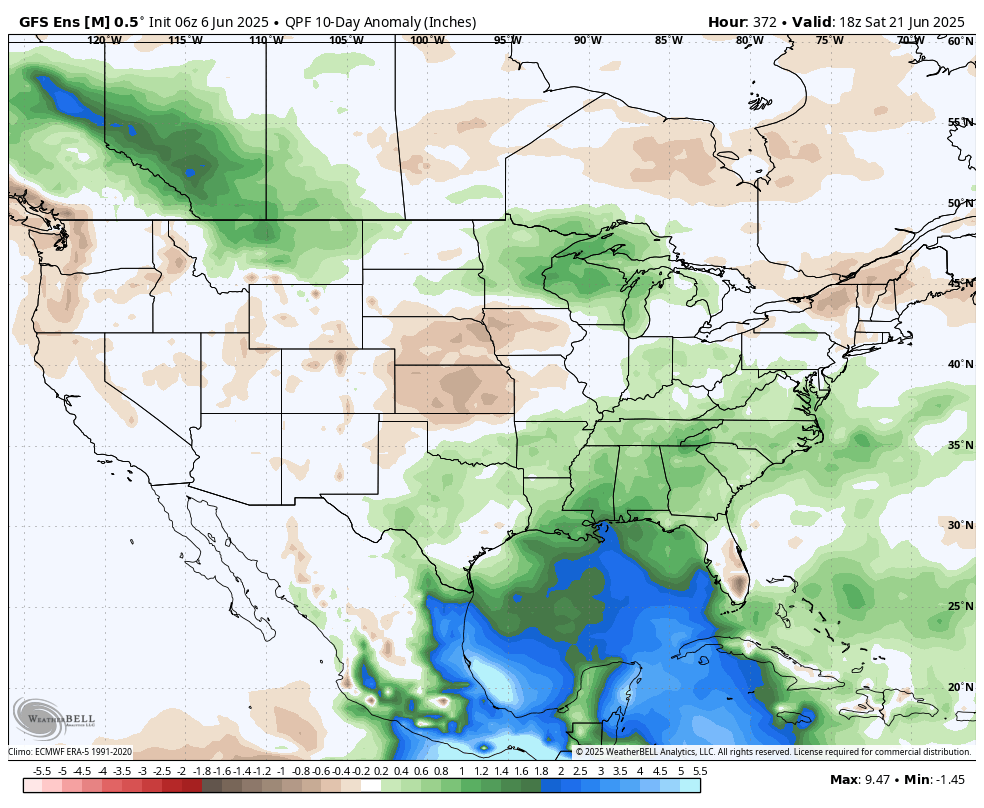
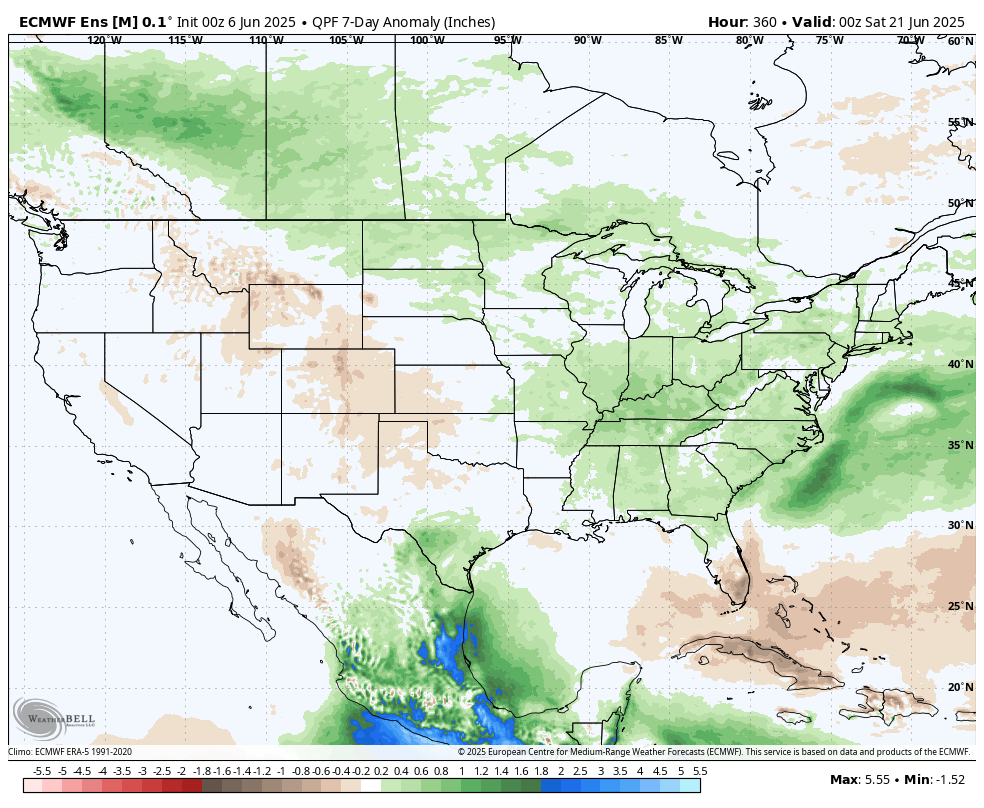
Hotter and drier long range forecast in late June/July for IA/NE but its hard to get very bullish with this 2 week rain forecast from the just updated 18z GEFS model.
The light blue is 2+ inches of rain.
This is the first week of those 2 weeks. Bullish for the areas of the Cornbelt that only have greens or white. Bearish for an even larger area.
7 Day Total precipitation below:
http://www.wpc.ncep.noaa.govcdx /qpf/p168i.gif?1530796126
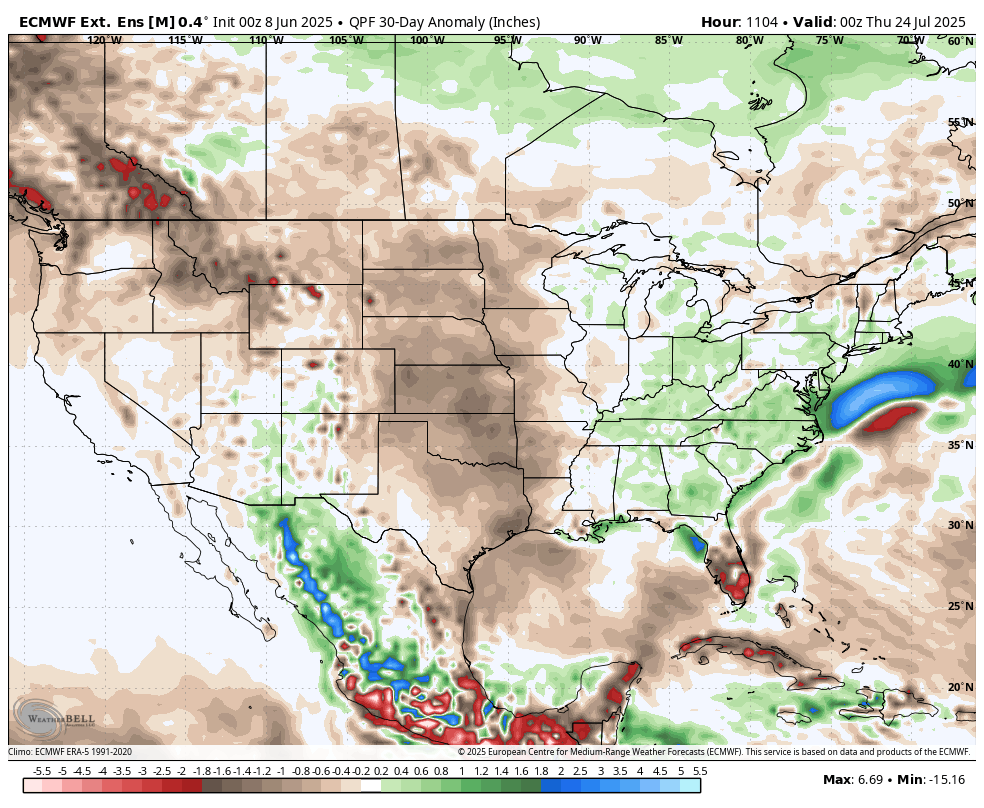
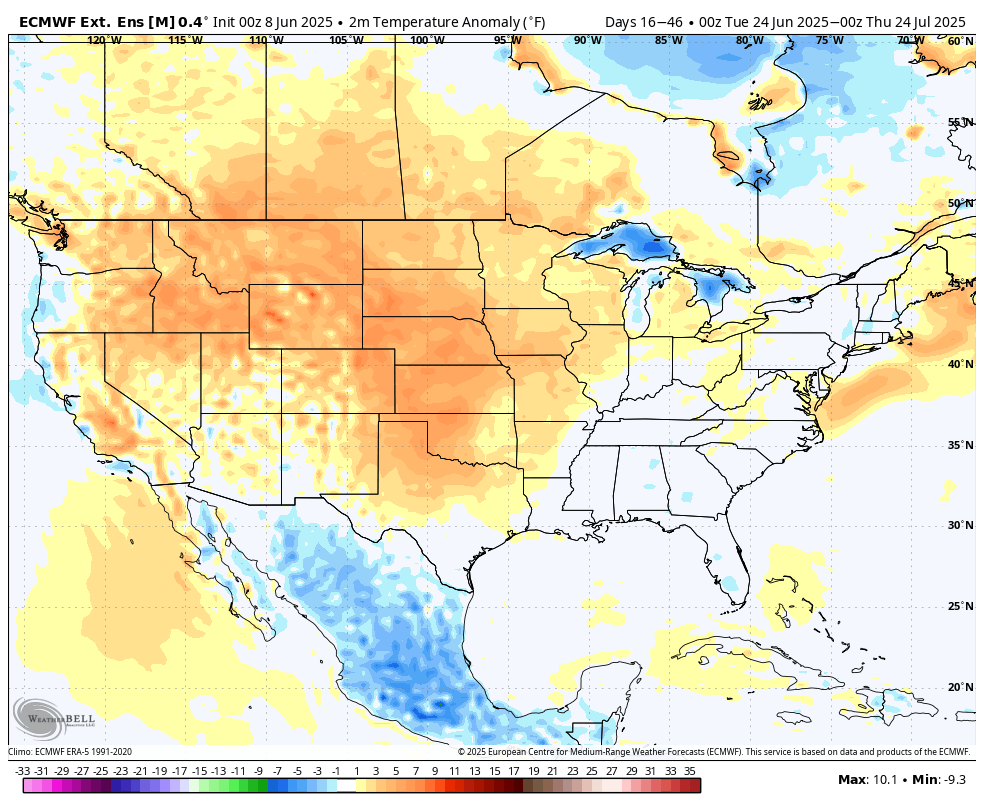
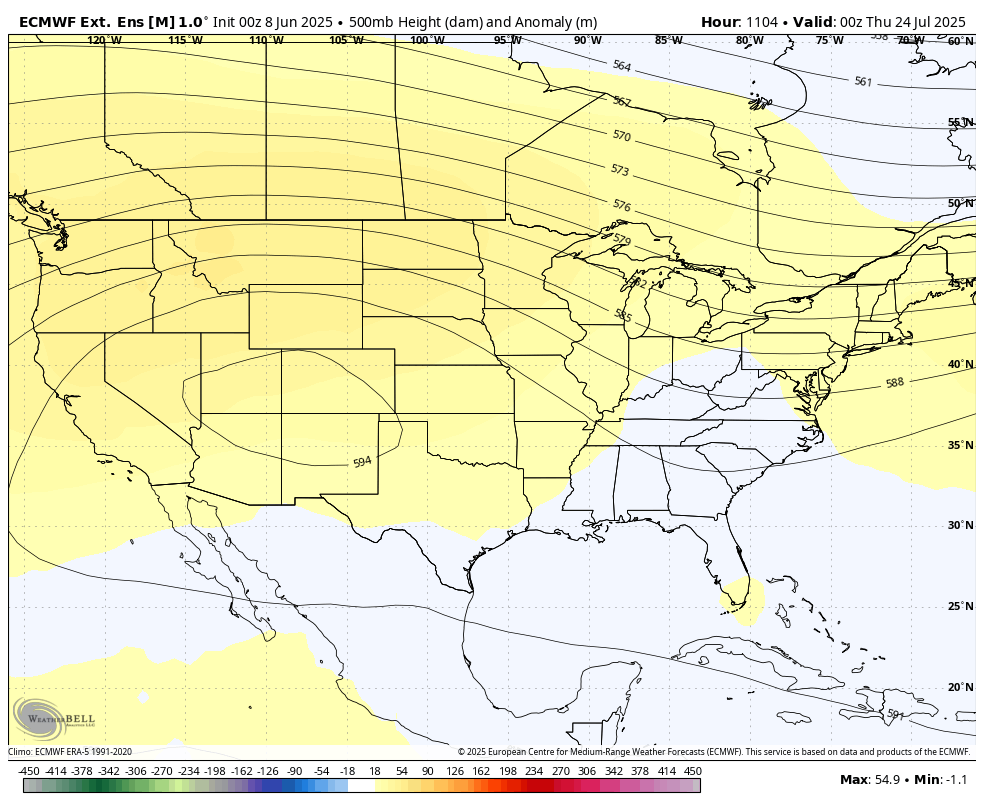
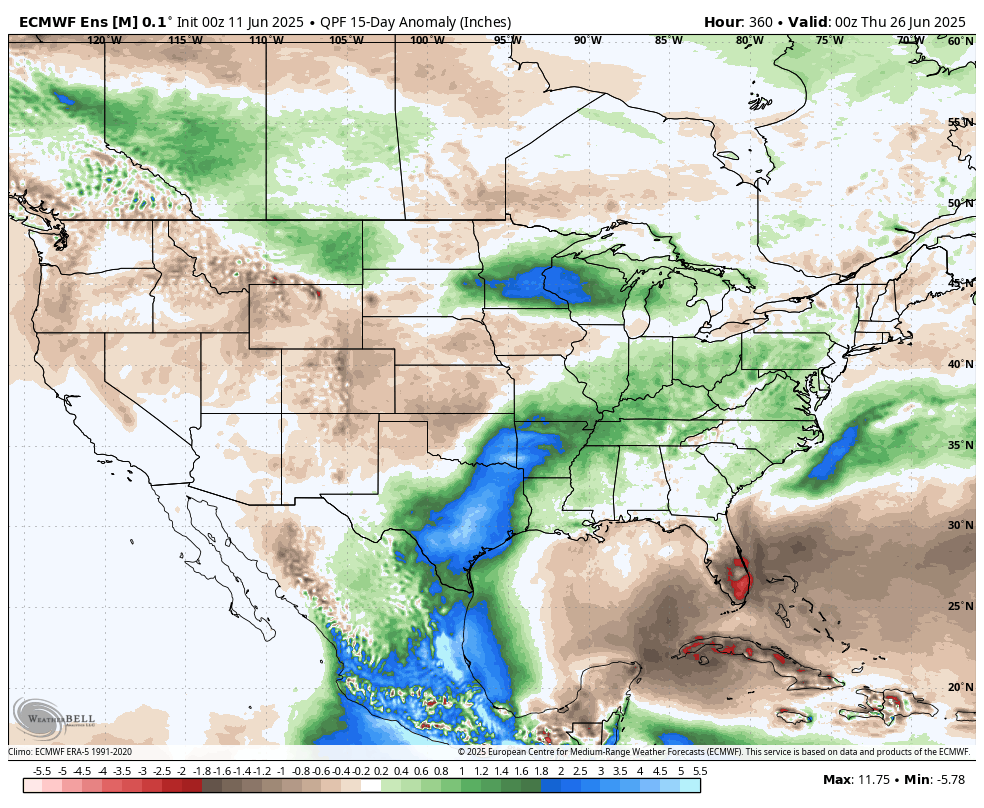
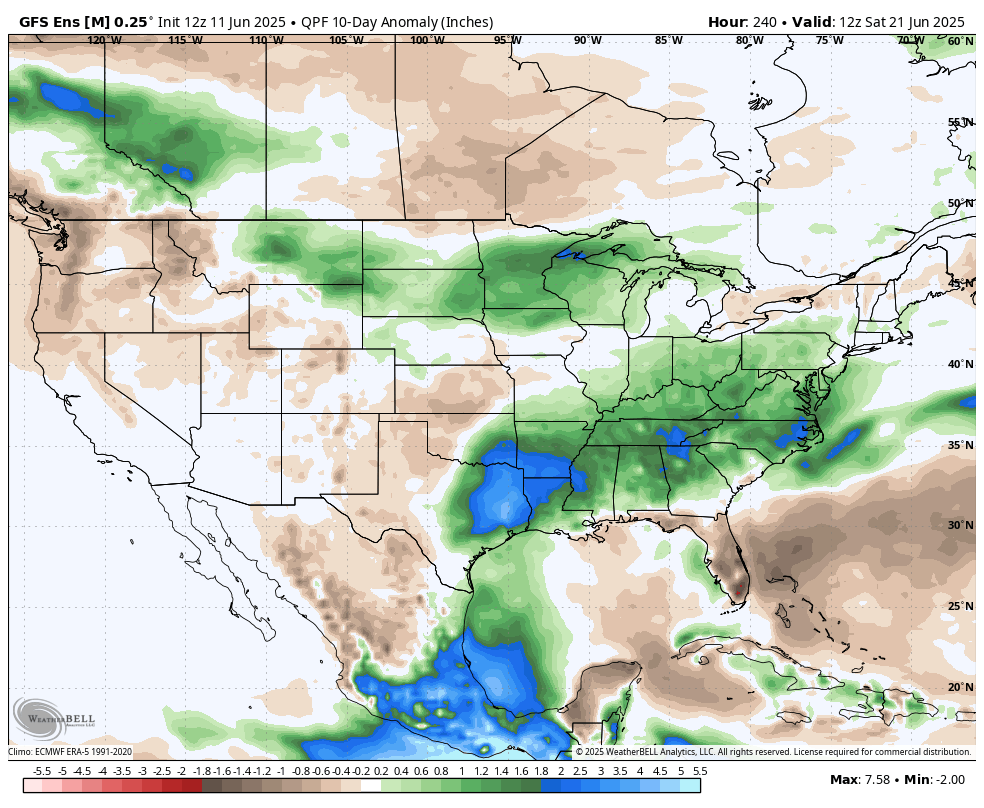
1. This was today's European model update for the 30 day rain anomalies, starting June 24.
2. Temperatures, departure from average for the same period
3. July 24th upper level map-500mb
Will this happen? Odds are better than 50% it will It if happens, the late June/July weather will be pretty bullish, with C and S prices going higher.
Would I trade on this?
Yes!............if/when it gets much closer or all that rain above comes out of the 2 week forecast. Until then, I'm flat and not leaning either way(or bearish on 2 week rains).
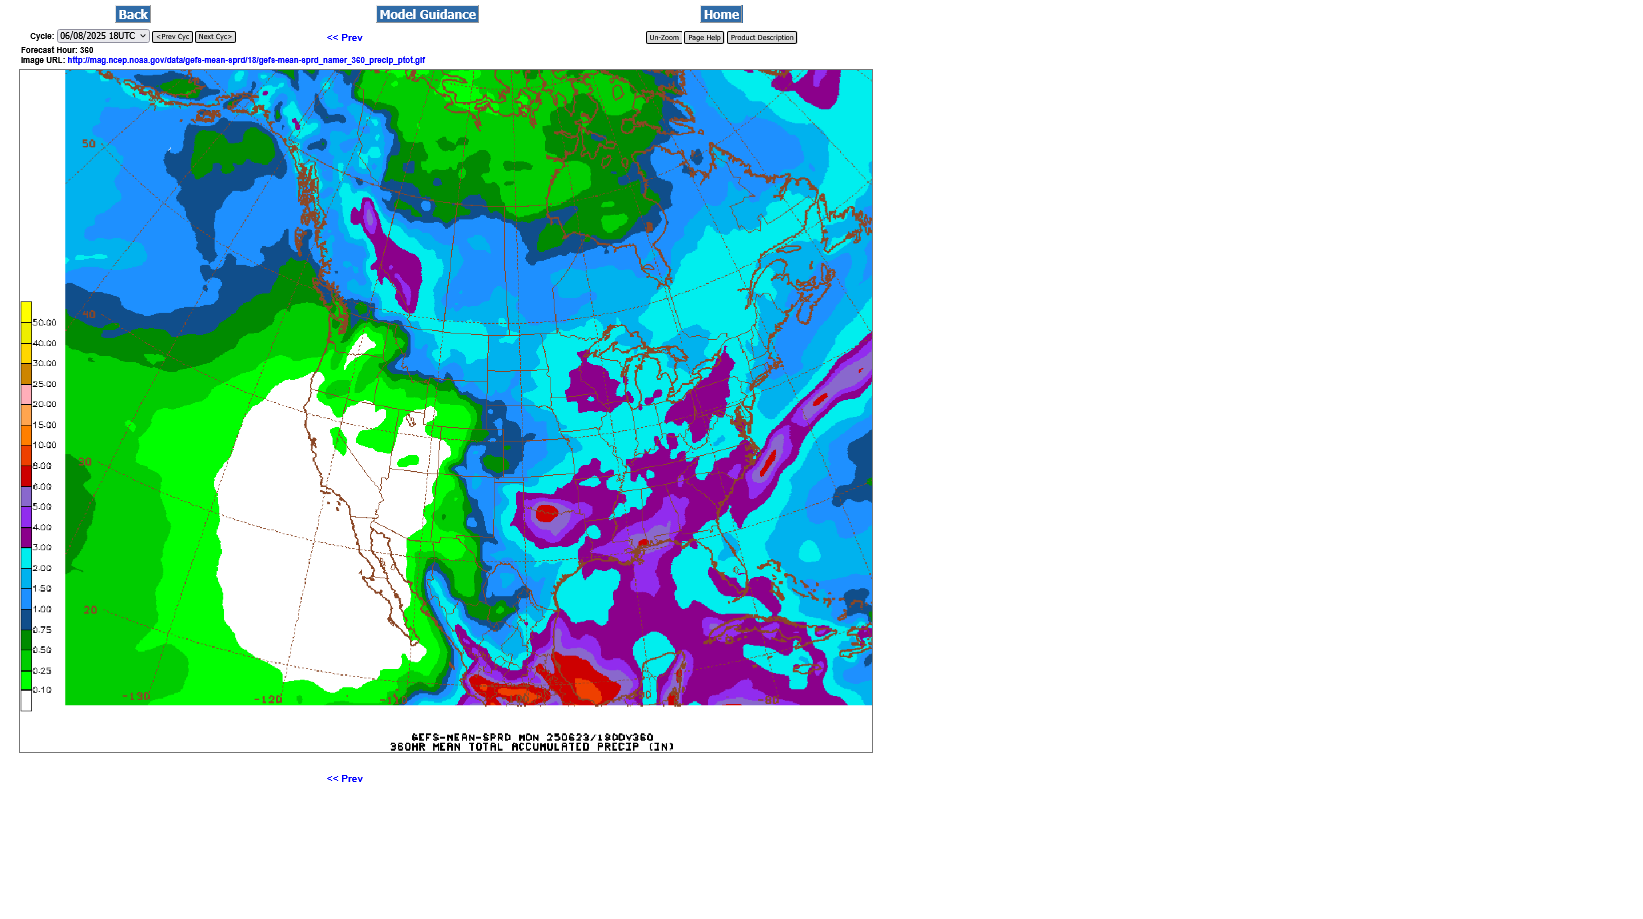
The amount of rain on the last 6z GEFS went UP(is even more bearish). 1st map below.
The purple color in IA is 3 inches of rain.
Almost the entire Cornbelt would receive 2+ inches of rain.
The same map we showed Sunday evening(above post) is below to compare. 2 inches in 384 hours is actually close to average. However, 3 inches is well above average and the corn is in the vegetative state right now and after a very cool May, will BENEFIT from more GDDs.
Seasonals turn sharply lower here in years without crop adversity. The main hope for the bulls is the dome of death finally coming..........but its turning into the meteorologists that cried DOME(Boy that cried Wolf).
Even considering that, I feel the chance that the dome DOES finally shift into the WCB in late June/July is better than 50%

U.S. corn and soybean export inspections topped expectations last week. No bean cargoes to China, and the bulk of last week's bean inspections were at the Gulf. Wheat inspections were on the lower end of expectations though the marketing year just began.
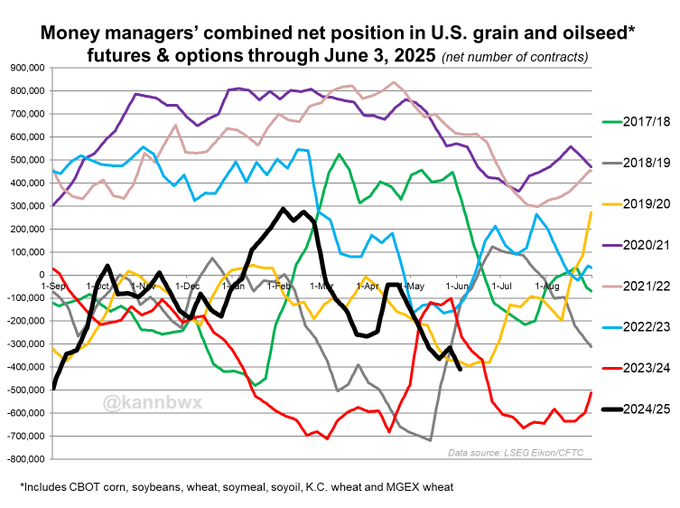
Money managers started off June on their most bearish note in 8 years across U.S. grains & oilseeds. This certainly leaves funds vulnerable to bouts of short covering as the U.S. growing season progresses, but any change in the market mood doesn't necessarily have to last.
++++++++++++++++
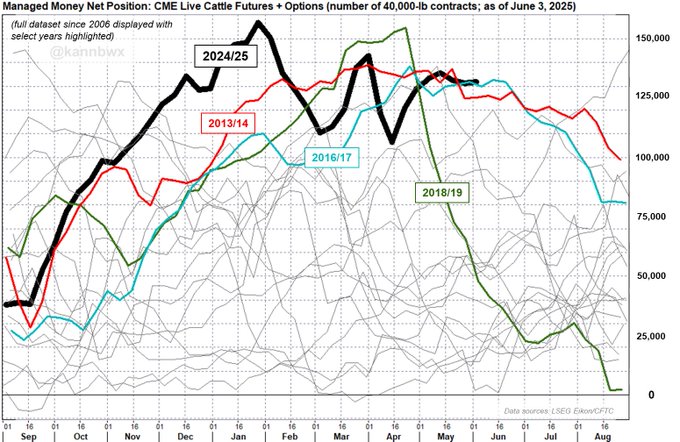
Check out feeder cattle.... in a new realm in 2025. Record net long as of the latest week (June 3) = 34.8k futures and options contracts.
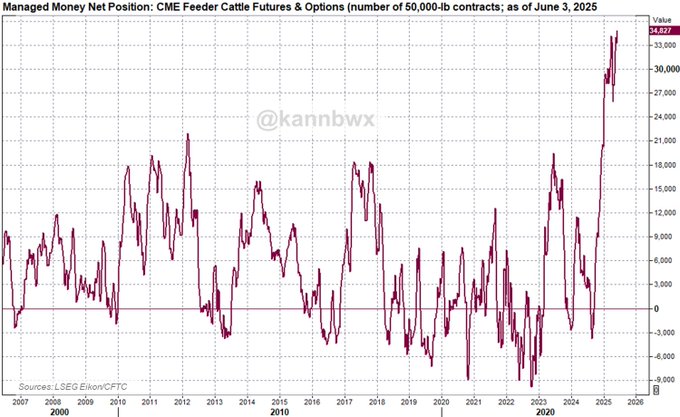
Funds have maintained super bullish bets in CME live #cattle for 6+ months now. Their early June position compares with both 2017 and 2014, both of which featured a steady decline in bullish sentiment throughout the summer. What is in store for 2025?
During the growing season, every day passed without adverse weather is 1 day closer to making the new crop. ...and often results in risk premium slowly eroding from the price, sometimes with spikes lower, then pauses.
Today is a spike lower for December corn because of so much rain in the 2 week forecast as we start the new week of trading and look out farther than last week.
Seasonals between now and harvest are extremely negative. Only a dome in late June, lasting into July will save the bullish case.
https://farms.extension.wisc.edu/articles/seasonal-grain-price-patterns/
U.S. corn & soybean conditions improved last week, as did those for both spring and winter wheat. However, winter wheat harvest barely advanced last week. Cotton planting is slightly behind the average pace.
Matt's weather today:
https://talk.newagtalk.com/forums/thread-view.asp?tid=1204280&mid=11255342#M11255342 record imports for China
Thanks, mcfarm!
Too bad more of those sales were not to the US but China needs to eat and their animals need to eat. I'lll have to check on the wx in china!
7 Day Total precipitation below:
http://www.wpc.ncep.noaa.govcdx /qpf/p168i.gif?1530796126
2 week rains from the last 0z European Ensemble model:
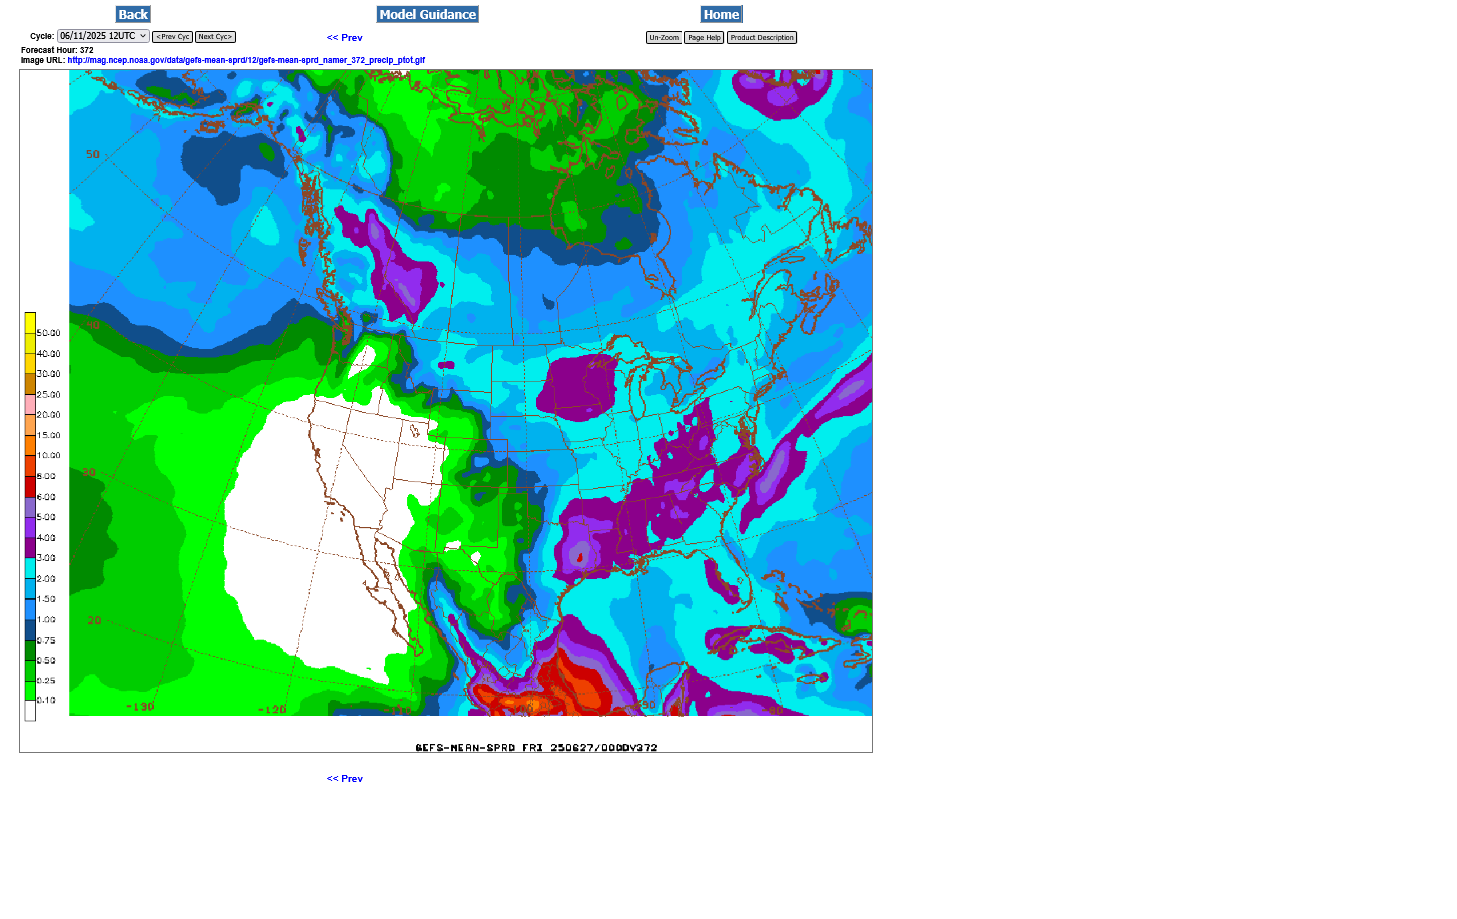
2 week rains from the last 6z GEFS model:
++++++++++++++++
Here's' the BULLISH part.
Upper level ridge on the last 0z European model. Widespread, significant heat that will dry things out quickly in areas that don't get much rain. The sun will be at its peak and the high angled sun will add to evaporation rates.
We need to take out rain i the forecast to turn bullish overall. In week 1, we basically have a ring of fire type pattern with perturbations in the fast flow around the periphery of the building heat ridge(1 big one later this week from the north and an upper level low from the southern stream hitting the southern Midwest) triggering widespread rain events.
It's possible that the weather forecast might start being bullish next week, enough for the grains to start going higher. Keep in mind that this is the time of year in which grains will almost never go up without new crop adversity as we gradually get closer to making the crop
+++++++++
I forgot to copy the ridge and will add that later today.
There is a chance that we are close to the lows, depending on the forecasts the next week.we MUST START TAKING OUT RAIN THOUGH!
The colors indicate the anomaly(height disparity from average). 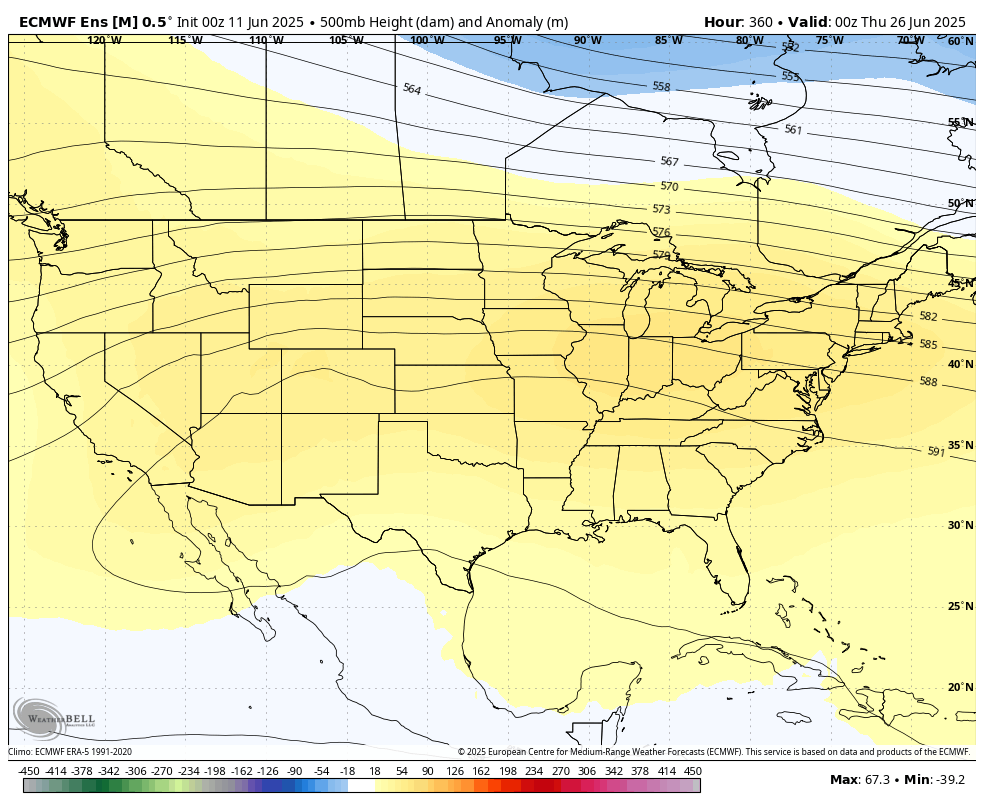
Temperature anomalies
Last total rain forecast for 15 days from the just out 12z GEFS. Still too much rain to be bullish.
Light blue is 2"+. Purple is 3"+.
We need those colors to go away over close to half the Cornbelt for this to really get bullish. Right now, only NE/KS will get less than 2".
7 Day Total precipitation below:
http://www.wpc.ncep.noaa.govcdx /qpf/p168i.gif?1530796126
Lastest 2 week rain anomalies for the last 12z models on June 12th.
1. GEFS
2. European Ensemble
++++++++++++++==
If/WHEN the grains start getting worried about stressful weather, this is the area that is likely to be of concern. NE/IA/n.IL. This is very productive, key growing area.
This is also the area with the least amount of rain in the forecast.
Should these upcoming heavy rains in MN, shift much farther south, then that area of concern will be diminished.


