Get all the comprehensive weather here:
https://www.marketforum.com/forum/topic/83844/
Week 1: Good weather IN SOME PLACE for drying out/warming up so that EARLY planting can proceed! The markets will likely be trading tariff news more than weather.
https://www.marketforum.com/forum/topic/83844/#83848
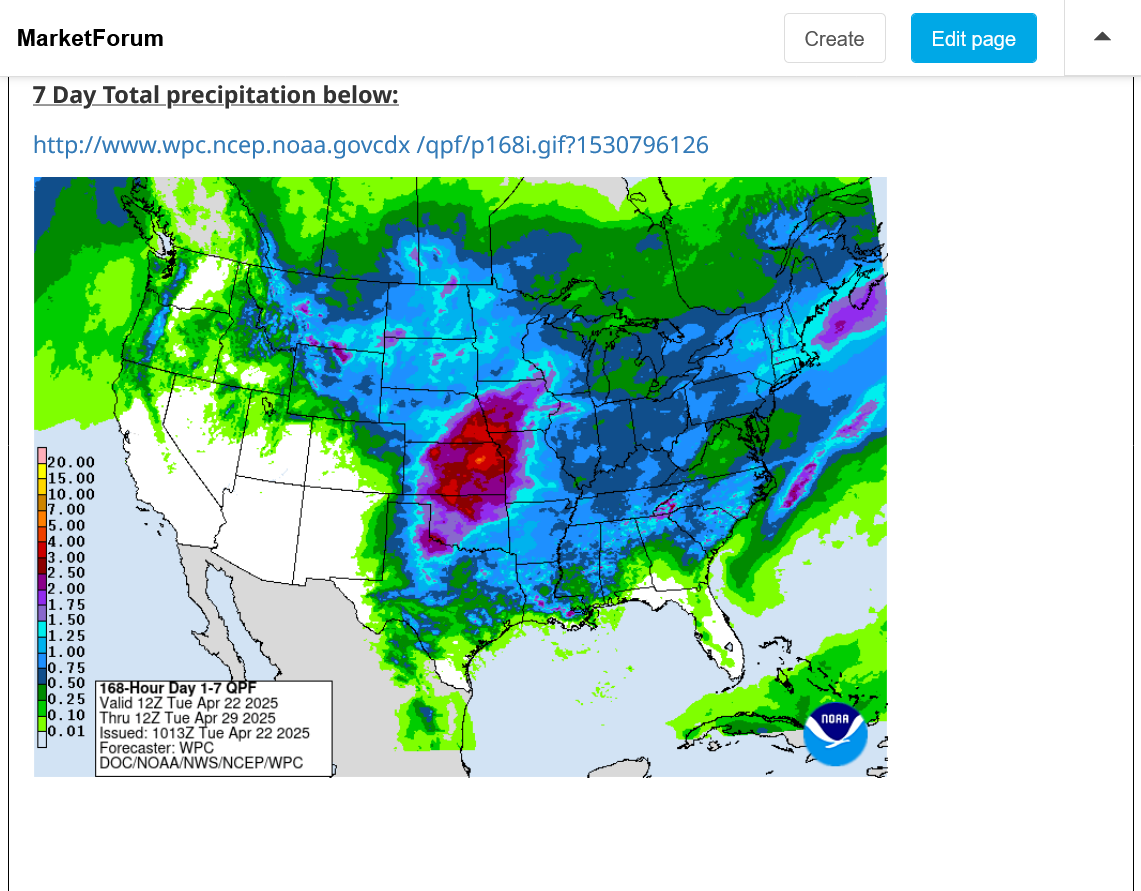
7 Day Total precipitation below:
http://www.wpc.ncep.noaa.govcdx /qpf/p168i.gif?1530796126

Turning wetter in week 2:
https://www.marketforum.com/forum/topic/83844/#83852
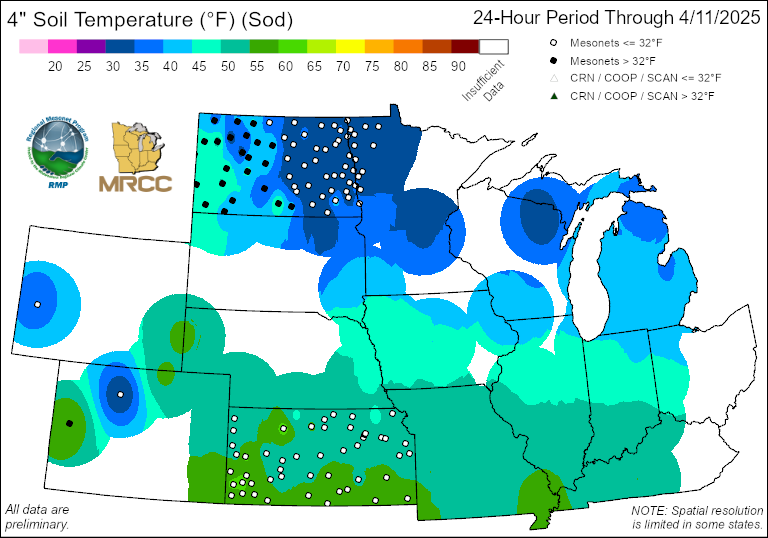
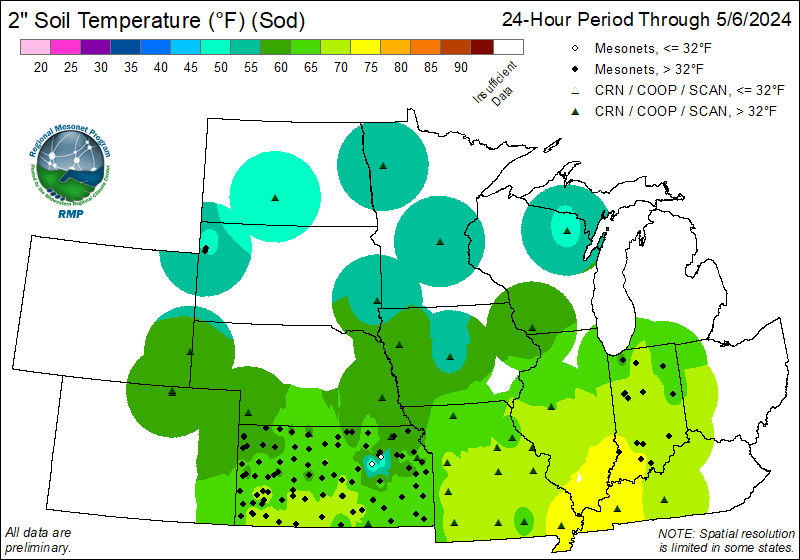
Corn planting/emergence:
https://www.marketforum.com/forum/topic/83844/#83880
https://mrcc.purdue.edu/files/MESONET/meso_d1_02in_Sd_central.png
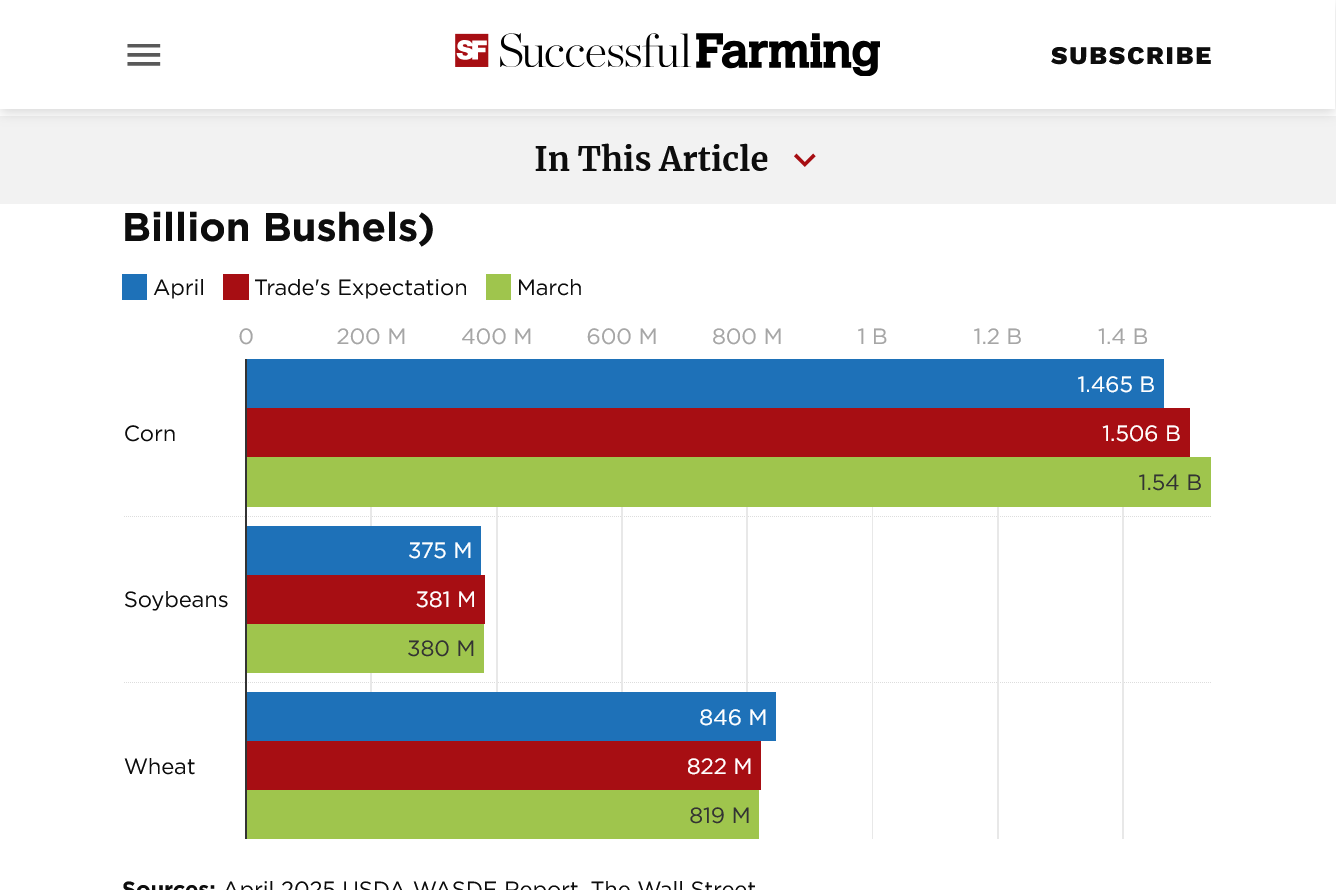
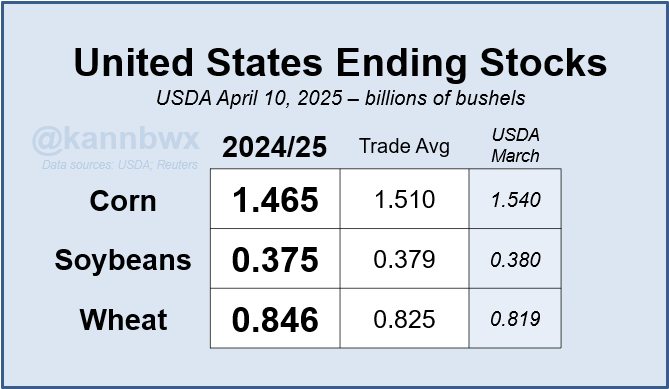
USDA was BULLISH for corn!
USDA cut U.S. corn ending stocks by more than expected due to a bump in exports. Soybeans come in close to expectations though wheat lands above them.
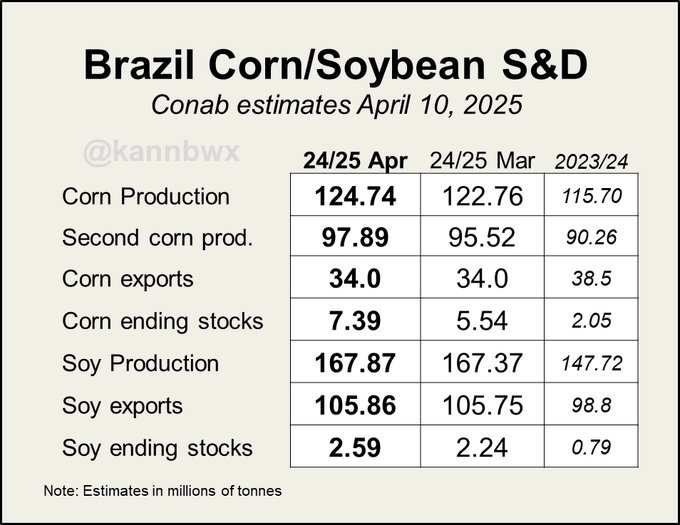
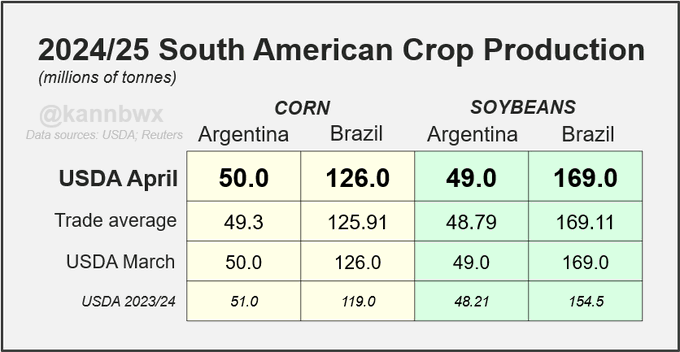
USDA leaves 2024/25 corn and soybean production in Brazil and Argentina unchanged from last month. But 2023/24 Brazilian soy production was increased by 1.5 million metric tons.
Global ending stocks come in near expectations. Highlights: China wheat imports slashed again (now 3.5 mmt, was 6.5 mmt). RU+UA wheat exports -0.5 mmt net. US corn exports up; AR, BR, UA corn exports unch. Bigger old-crop soy stocks in Brazil. China soy demand unch.
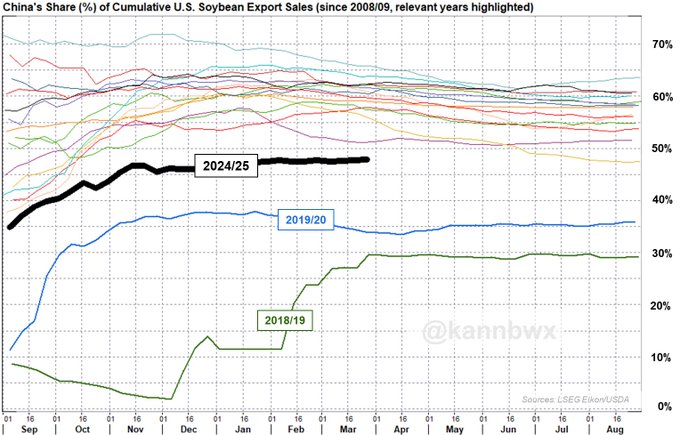
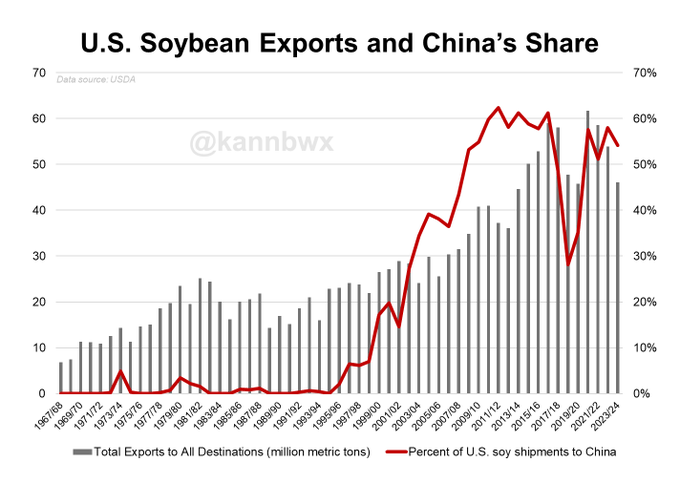
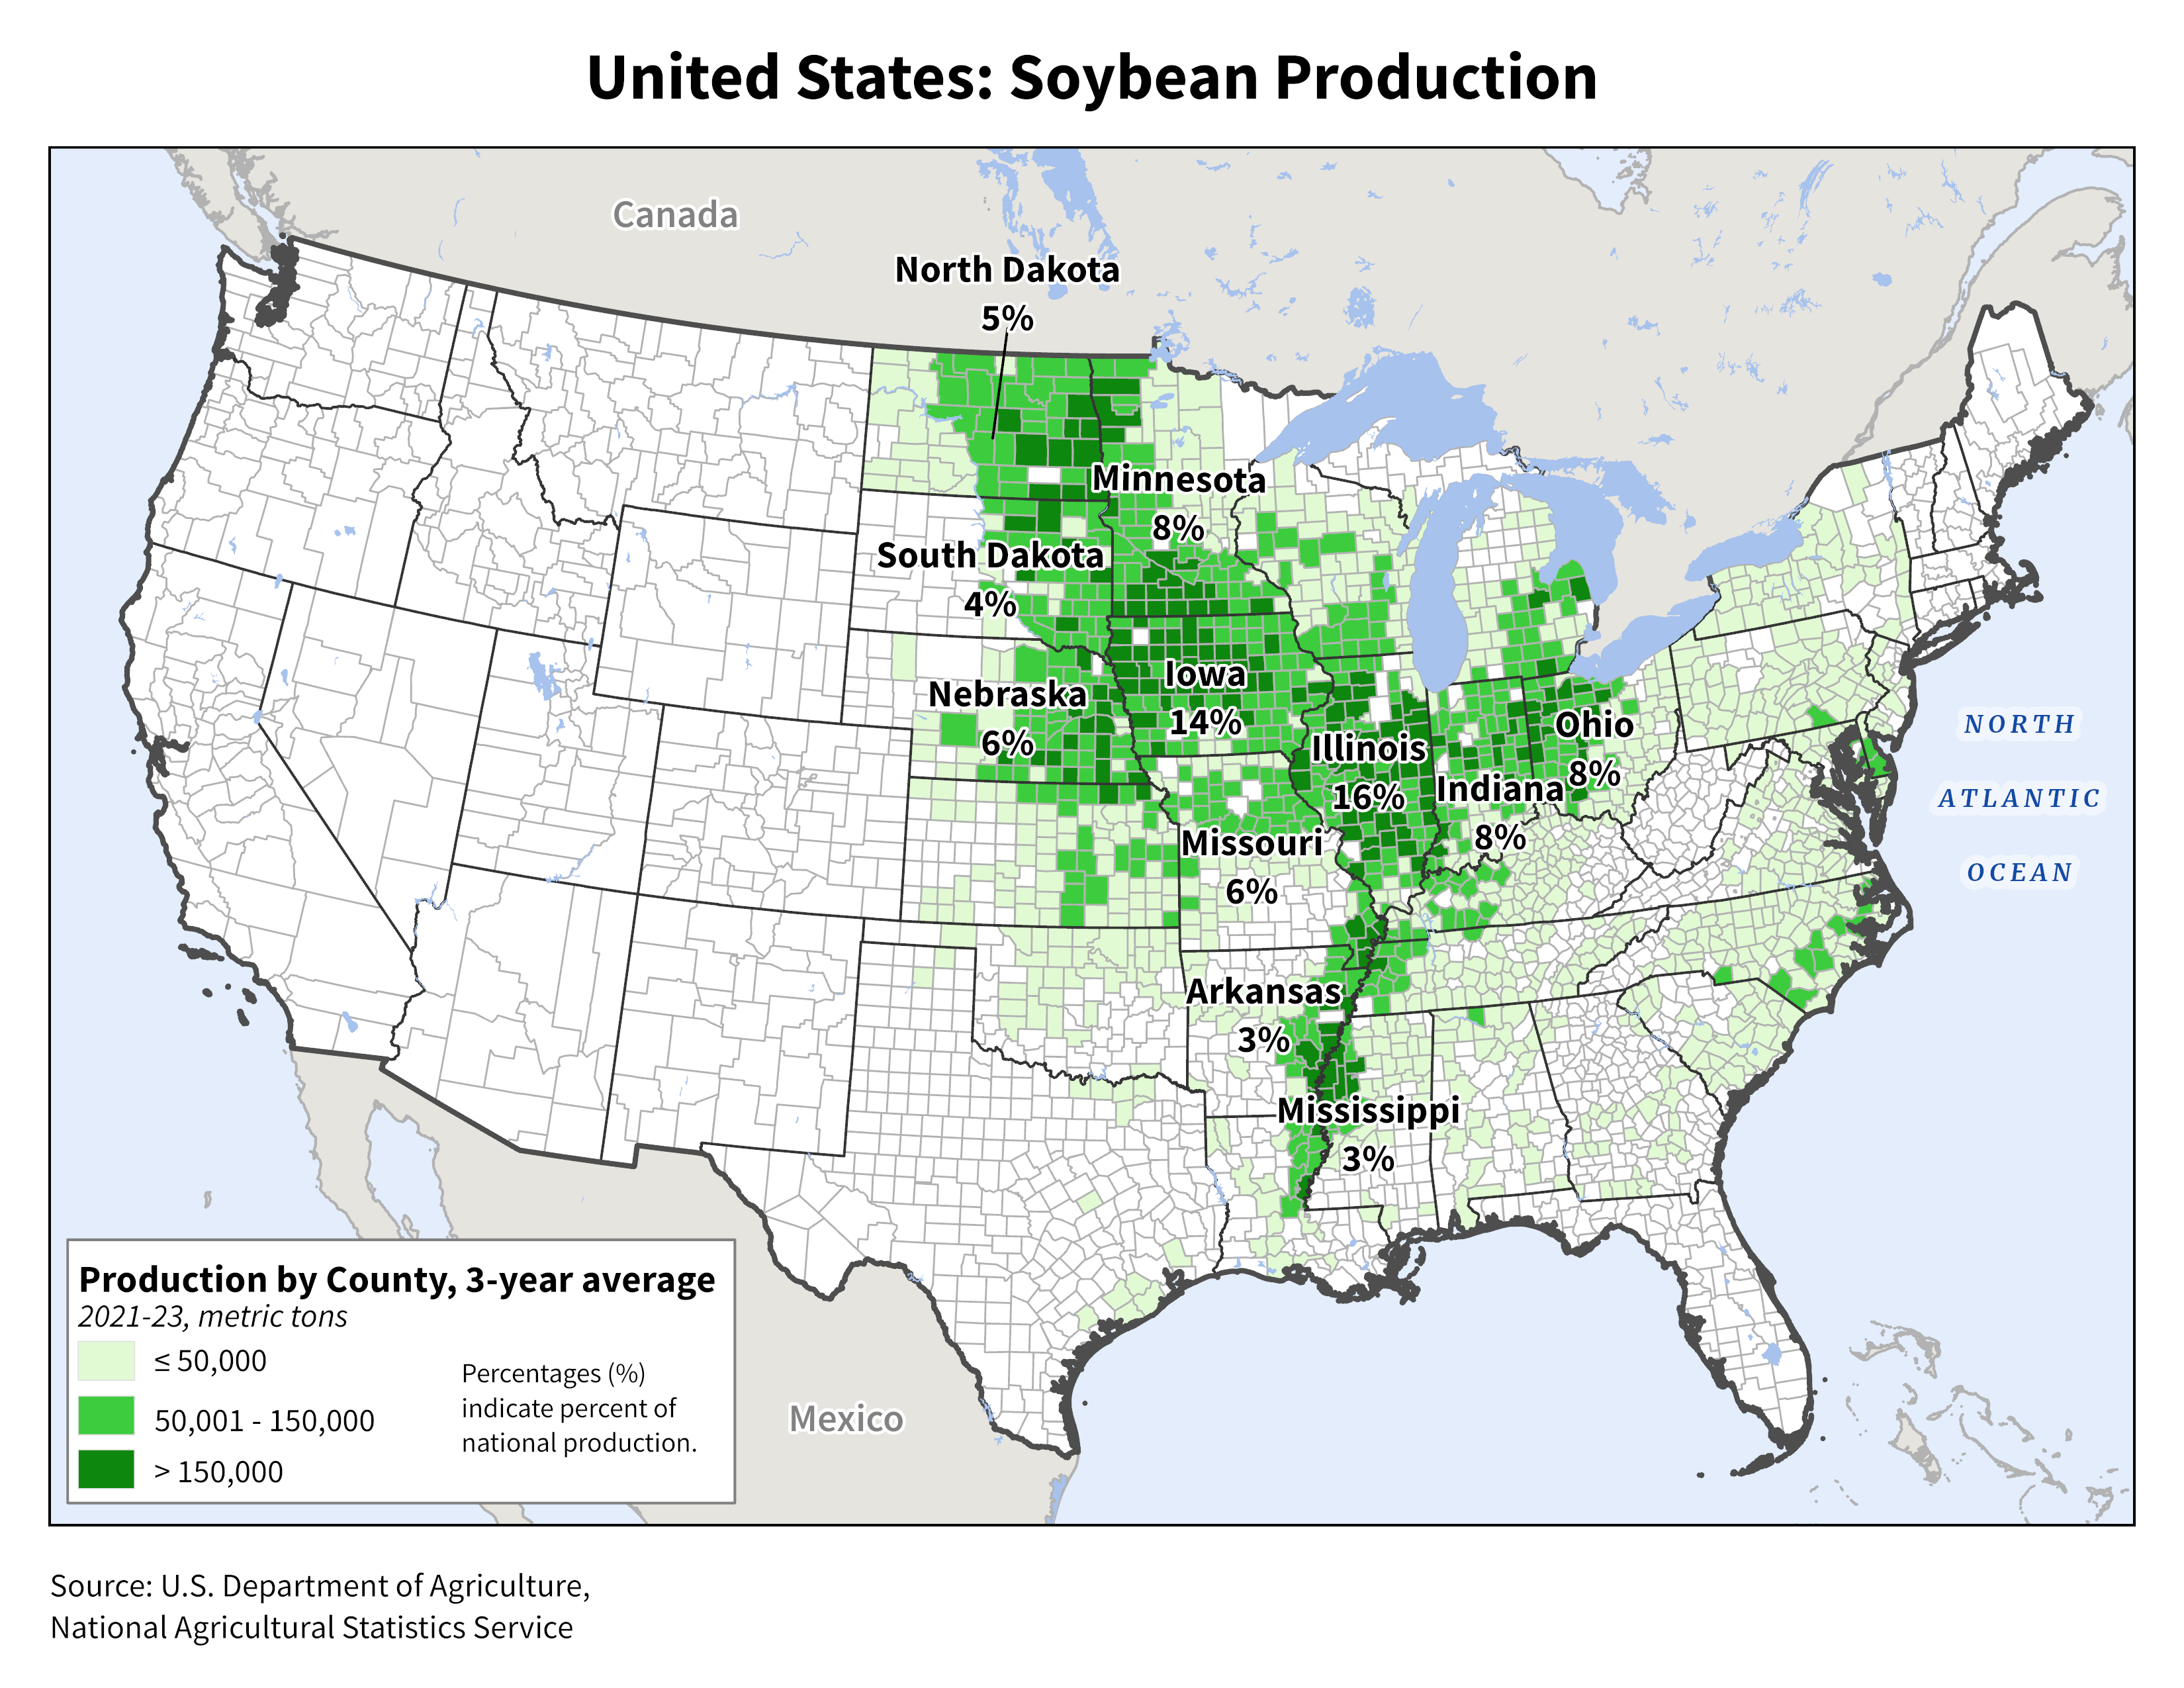
This chart is quite telling. #China currently accounts for 48% of U.S. soybean export sales for 2024/25, a 17-year low outside of the two trade war years (labeled). China has reduced reliance on U.S. #soybeans, but U.S. exporters still rely very heavily on China.
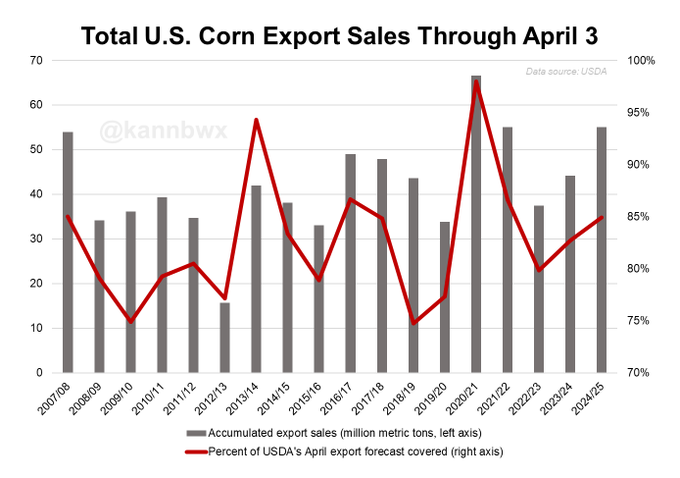
As of April 3, USA had sold 55 mln tonnes (2.17 bln bu) of #corn for export in 2024/25, the second most for the date in at least 25 years (ever?). That covers 85% of USDA's fresh full-year target of 2.55 bln bu, a little above the ten-year average of 83%.
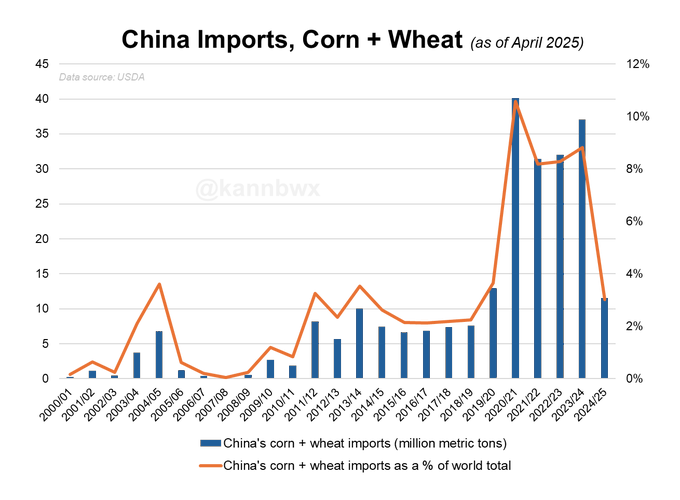
China's combined imports of #corn & #wheat in 2024/25 are seen plunging nearly 70% on the year, hitting six-year lows. Very sharp pullback from the previous four years, when China accounted for as much as 11% of global corn+wheat imports. Closer to its previous normal, though.
https://www.marketforum.com/forum/topic/83844/#83853
Soilmoisture anomaly:
These maps sometimes take a day to catch up to incorporate the latest data(the bottom map is only updated once a week).
https://www.cpc.ncep.noaa.gov/products/Soilmst_Monitoring/US/Soilmst/Soilmst.shtml#


++++++++++++++++++++++++++++
Updated daily below:
https://mrcc.purdue.edu/cliwatch/watch.htm#curMonths

NEW LINK:
https://www.drought.gov/current-conditions
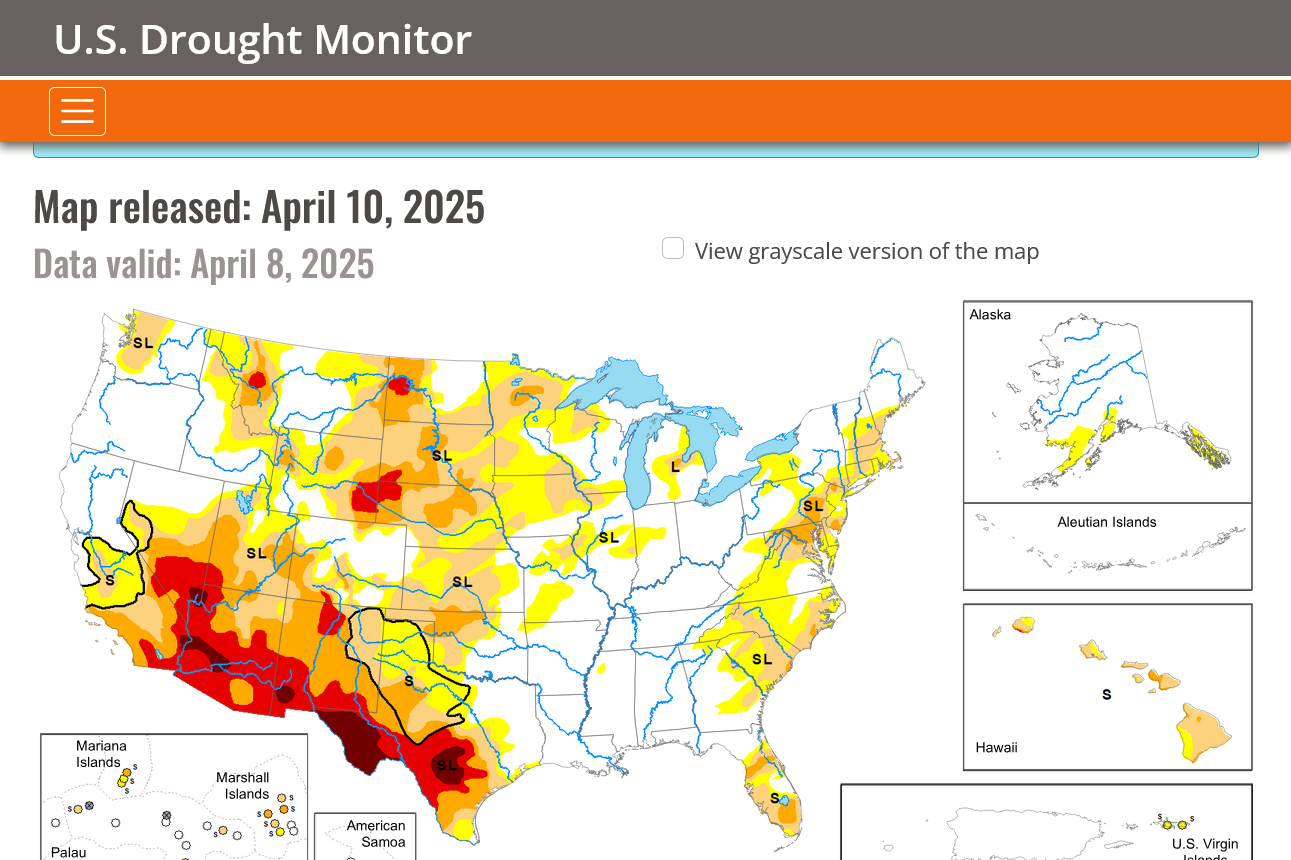
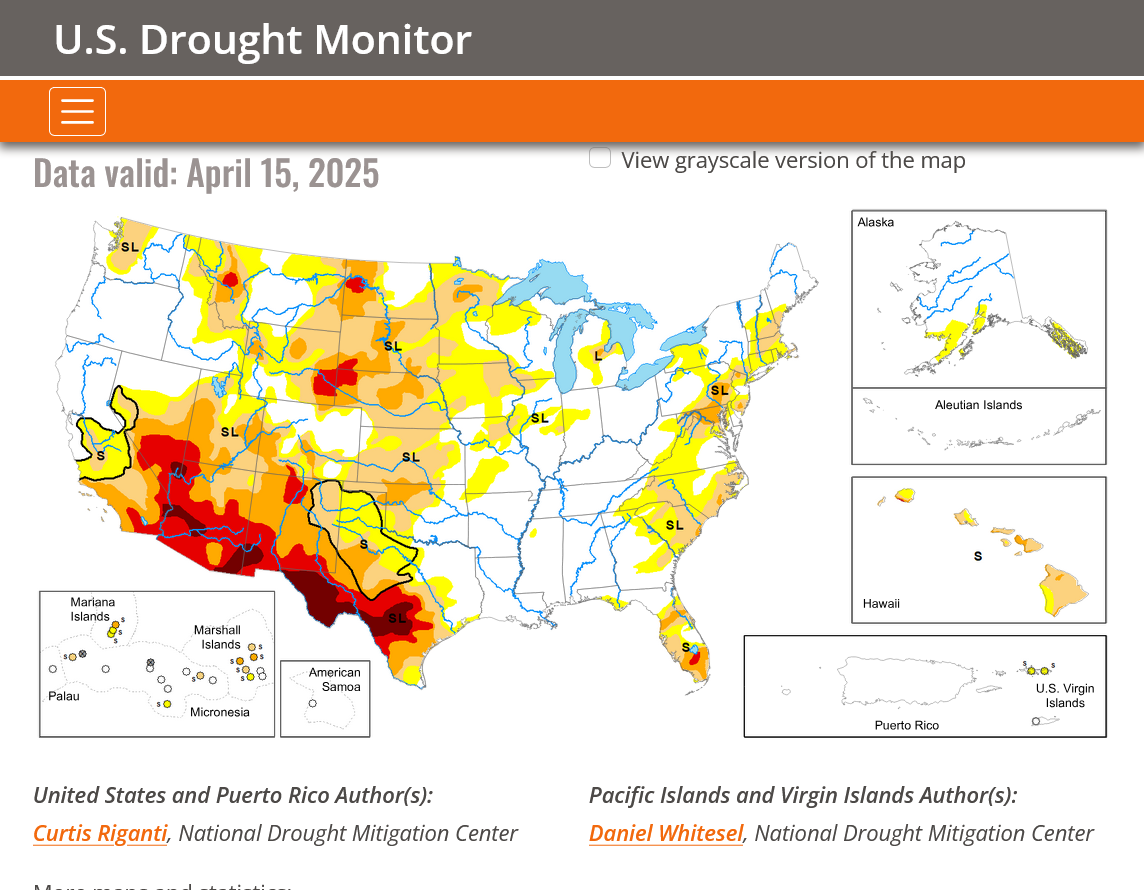
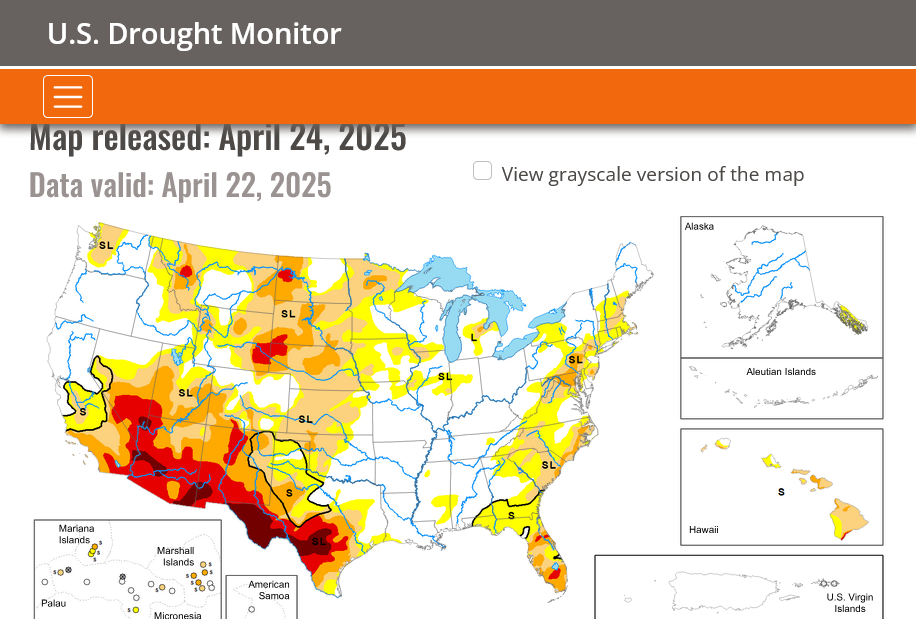
DROUGHT MONITOR
https://droughtmonitor.unl.edu/
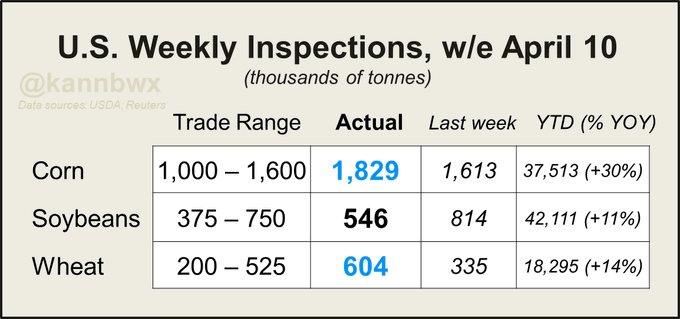
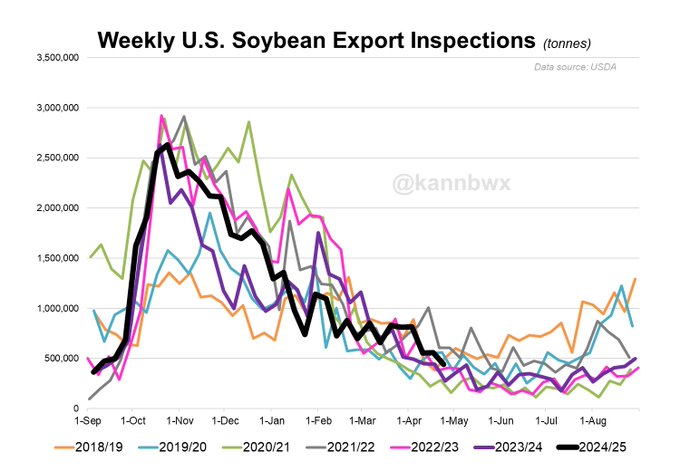
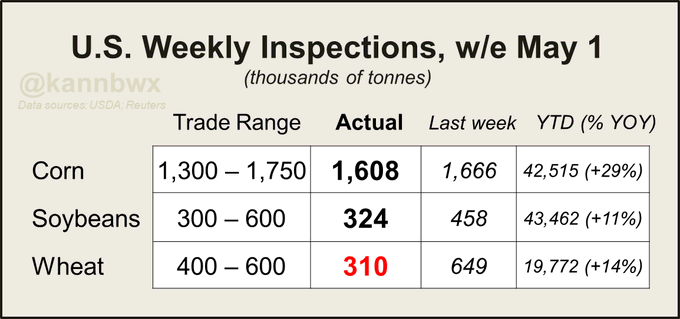
U.S. #corn export inspections once again cruised past trade expectations last week, as did #wheat. Typical destinations were involved. #Soybeans came in as expected (25% were to China, 23% were to Germany).
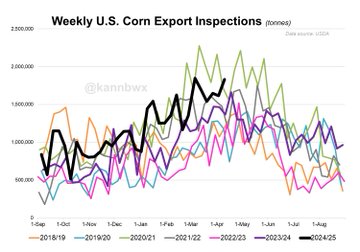
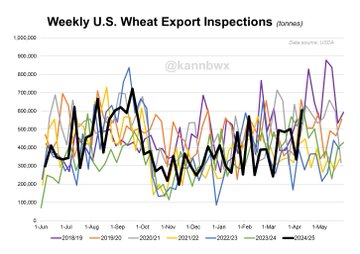
Soy inspections hit a multi-month low, though they were still respectable for the date. Corn last week challenged the first week of March for the best yet of the marketing year. Wheat inspections were the best for any week since September.
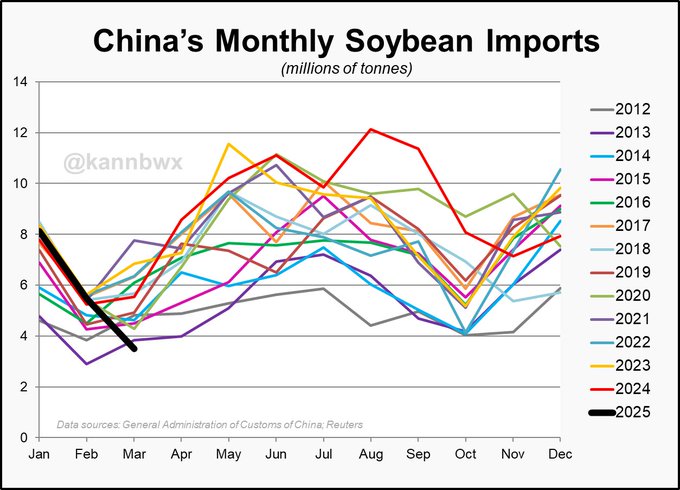
Some media is linking the low March Chinese imports w/ the U.S. tariffs. As you may know, I'm not a fan of that - data doesn't support it and it distracts from the main drivers, i.e. Brazil. Would this chart be any diff if Trump wasn't elected? I don't really think so.
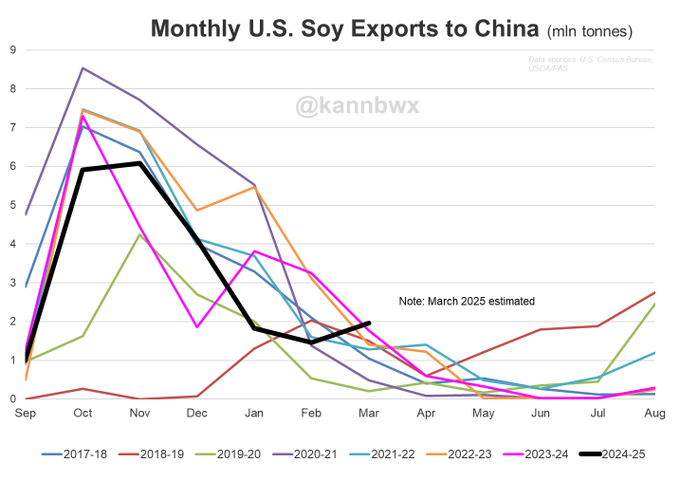
China imported 3.5 million metric tons of #soybeans in March, a 17-year low for the month and down 37% from last March. U.S. arrivals have slowed (which is typical) and Brazil didn't get a quick start on harvest. But BR's crop is on its way & China AMJ imports should be
Making this point CRYSTAL clear. U.S. #corn exports to non-China destinations likely surpassed 38 million tonnes (1.5 billion bushels) between Sept-March, easily a 17-year high for the period. U.S. corn exports to ALL destinations in Sep-Mar = ALSO challenging a 17-year high.
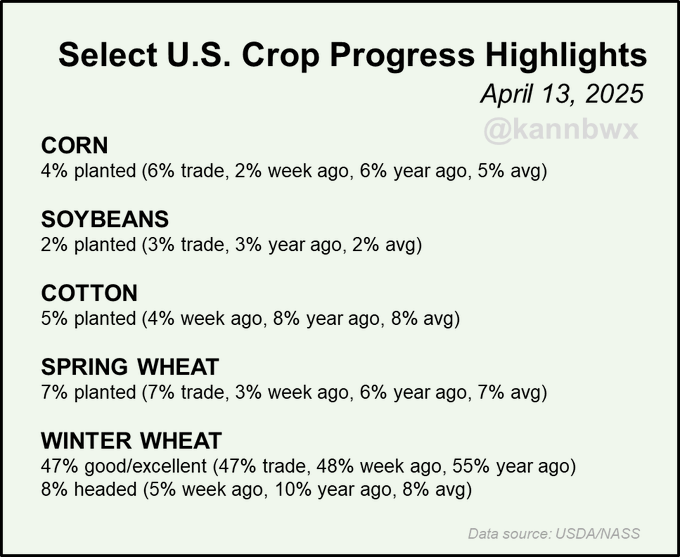
U.S. #corn planting delayed? Corn was 4% planted as of Sunday, below last year, the 5yr avg and trade expectations.... but it is still VERY early. So no, it's not delayed yet. The first half of May is often the busiest for corn planting. Warm/dryish weather is best for that.
Get all the weather here:
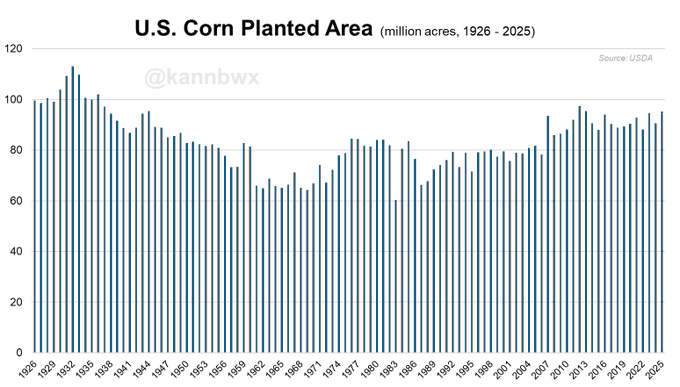
100 years of U.S. #corn planted acres Largest: 113M (1932) Smallest: 60.2M (1983) 2025: 95.3M (16th largest; 3rd largest since 1944)
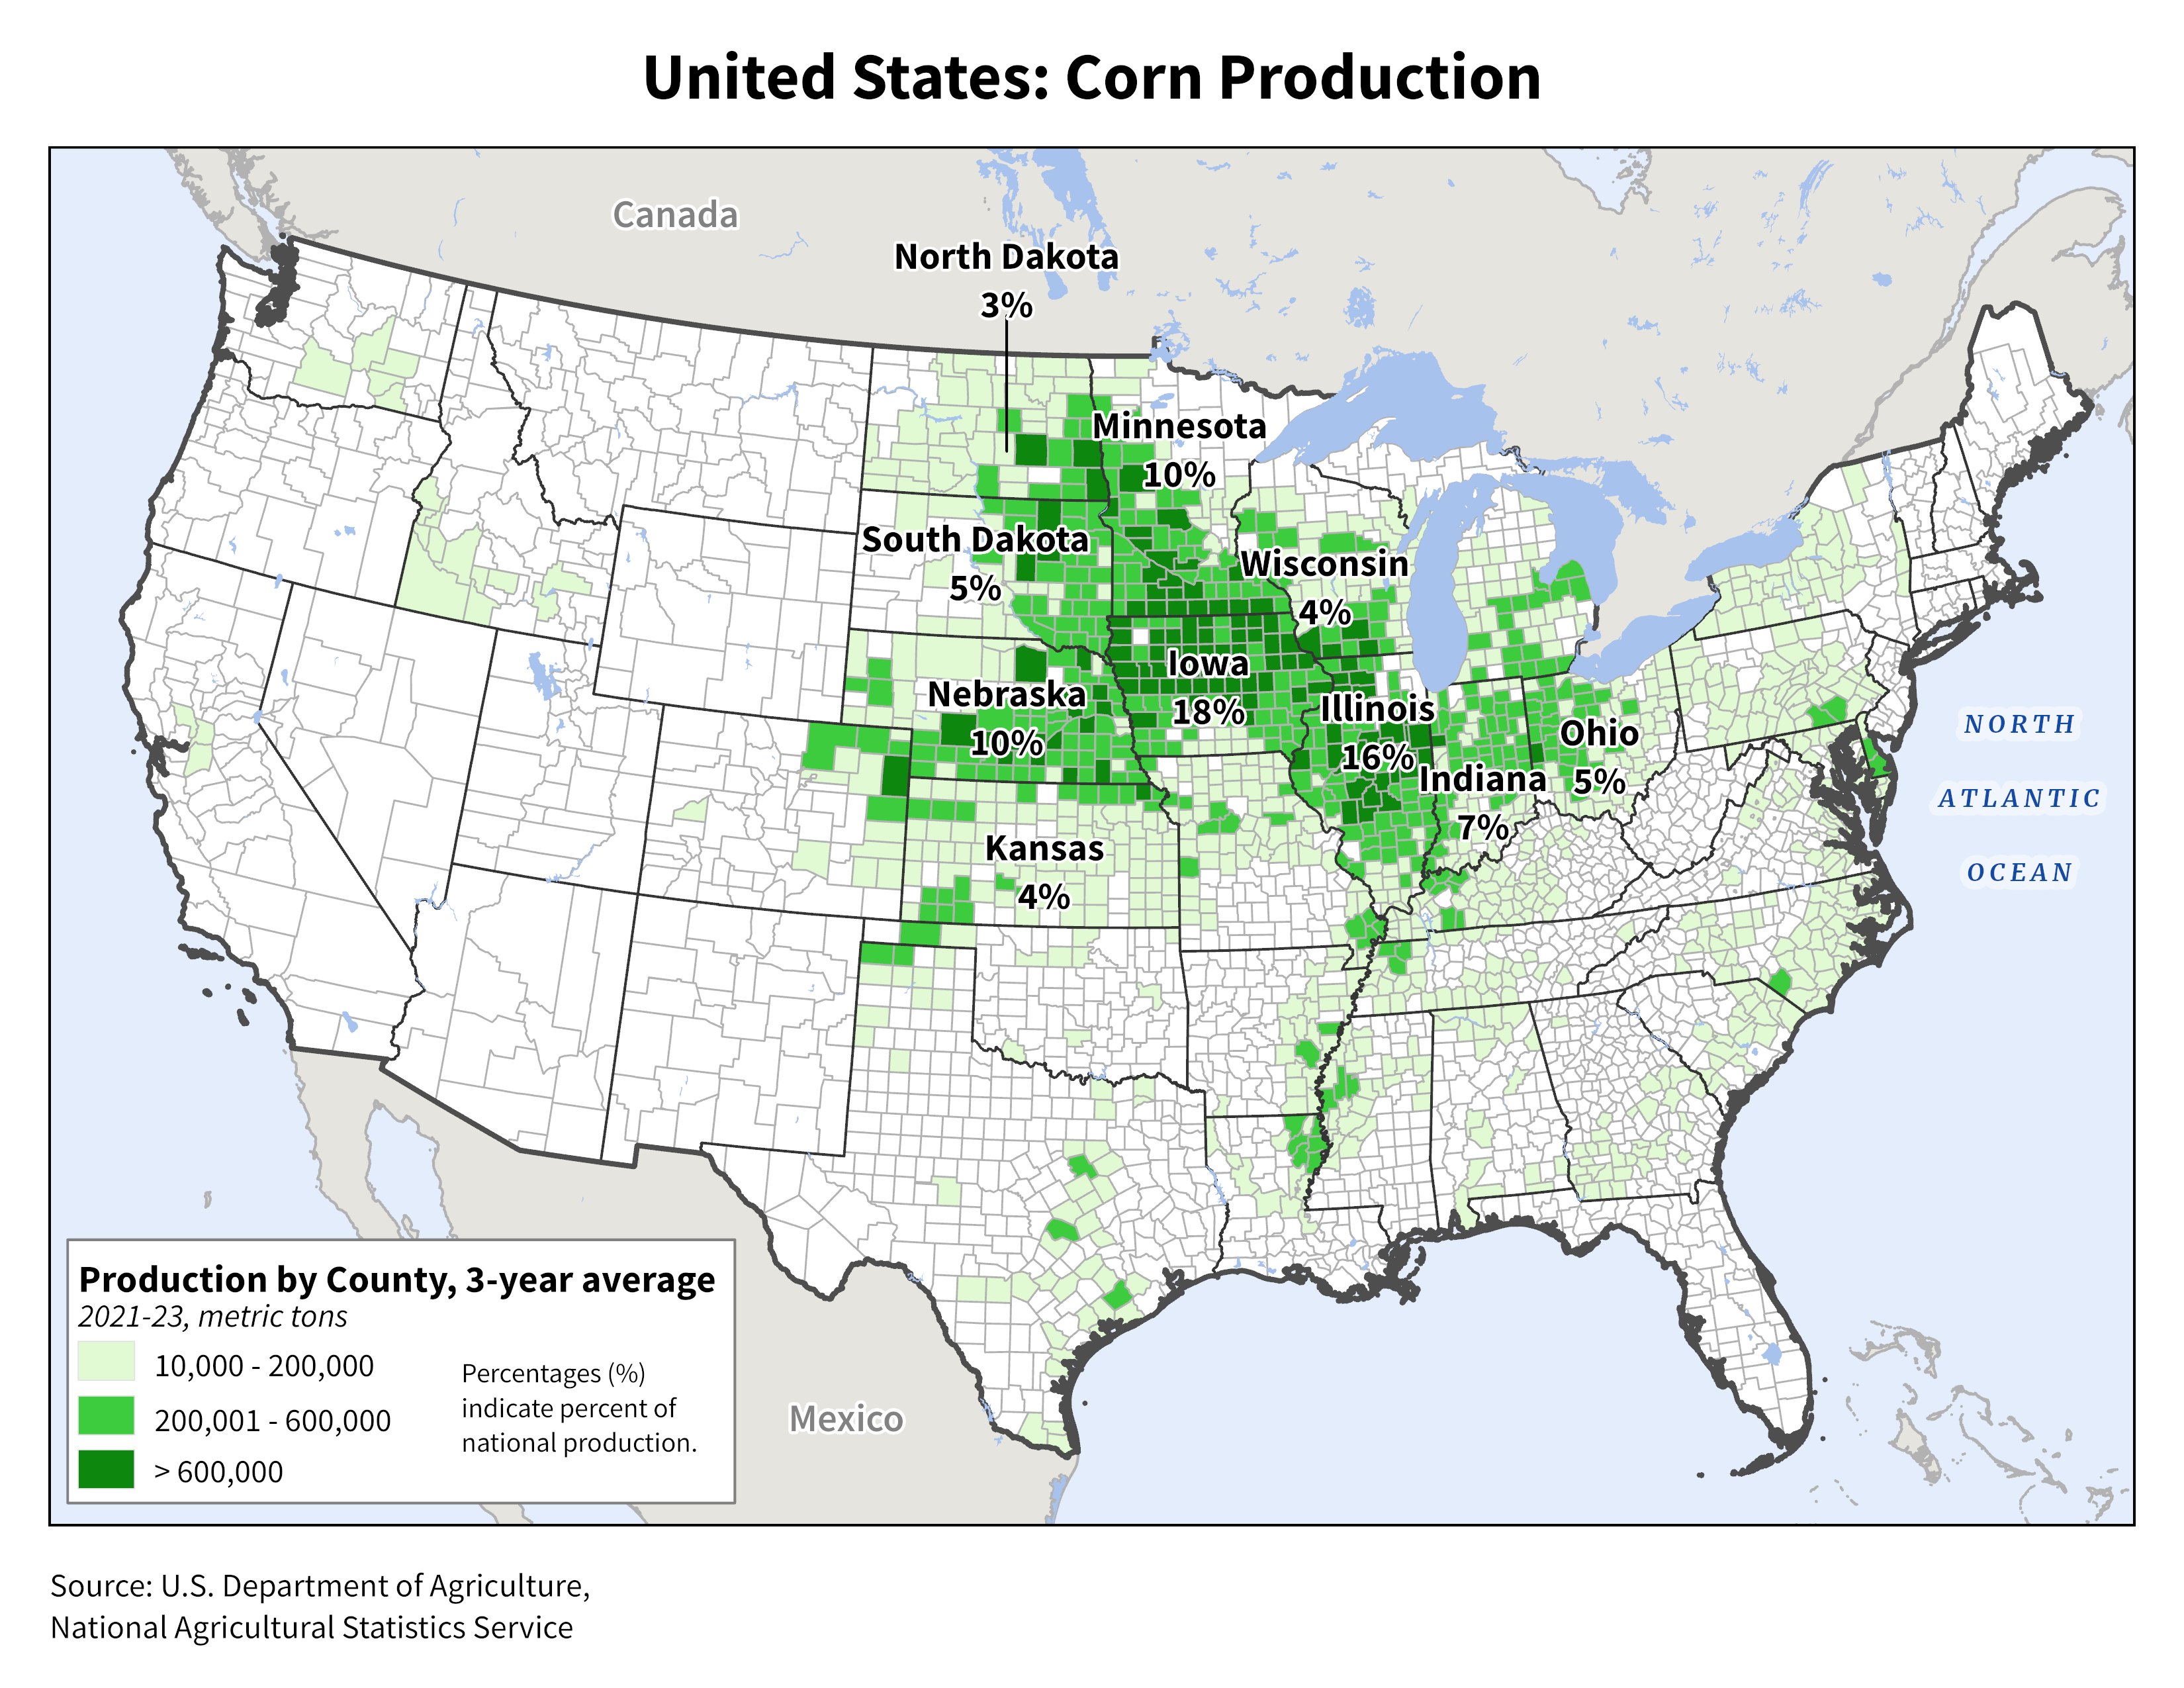
Who doesn't love these comparisons? In recent years, top U.S. #corn grower Iowa has produced more than 2x the corn volume that Ukraine produces, yet the latter remains vital for exports. Why? Ukraine exports more than 80% of its corn crop while the USA exports about 16%.
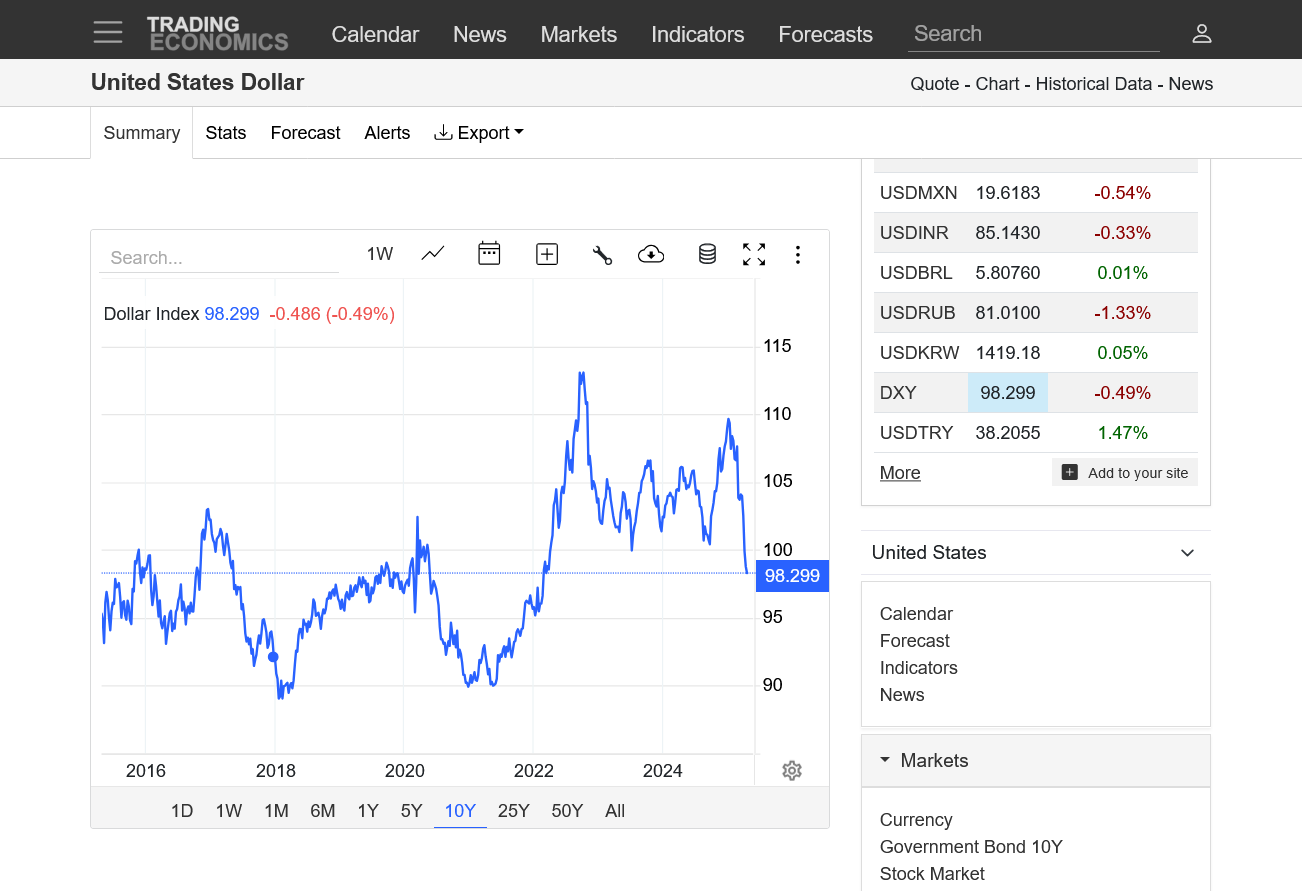
US dollar looks sick. Bear flag on the verge of a downside break out.
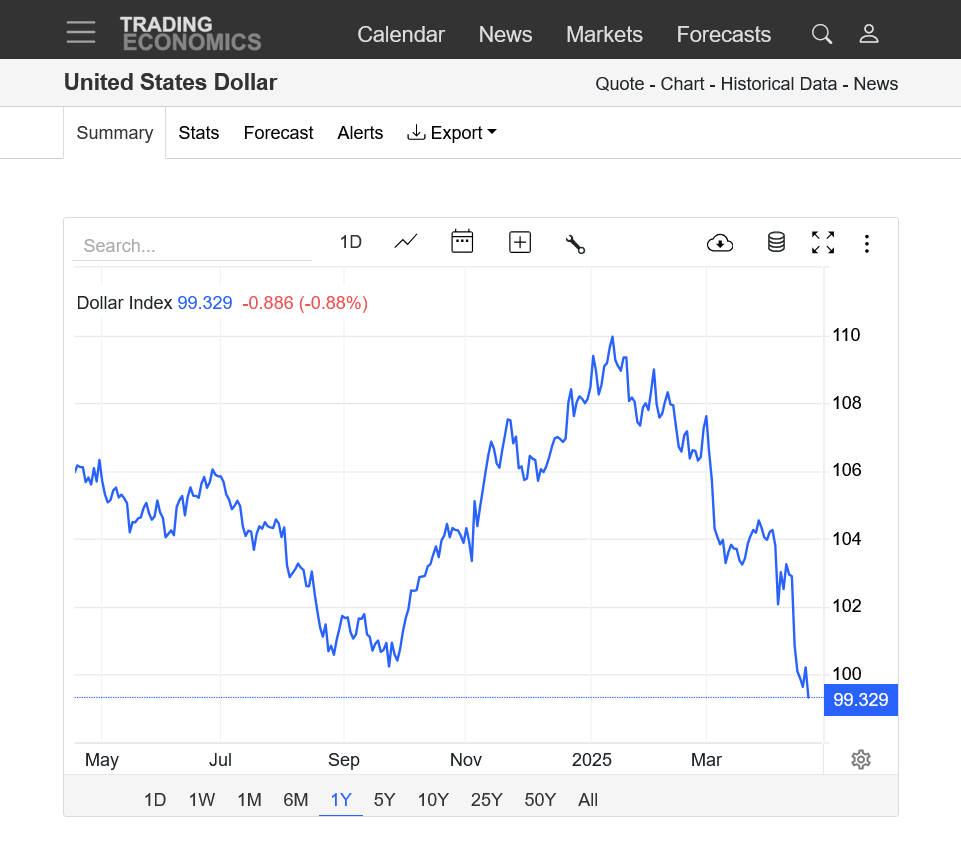
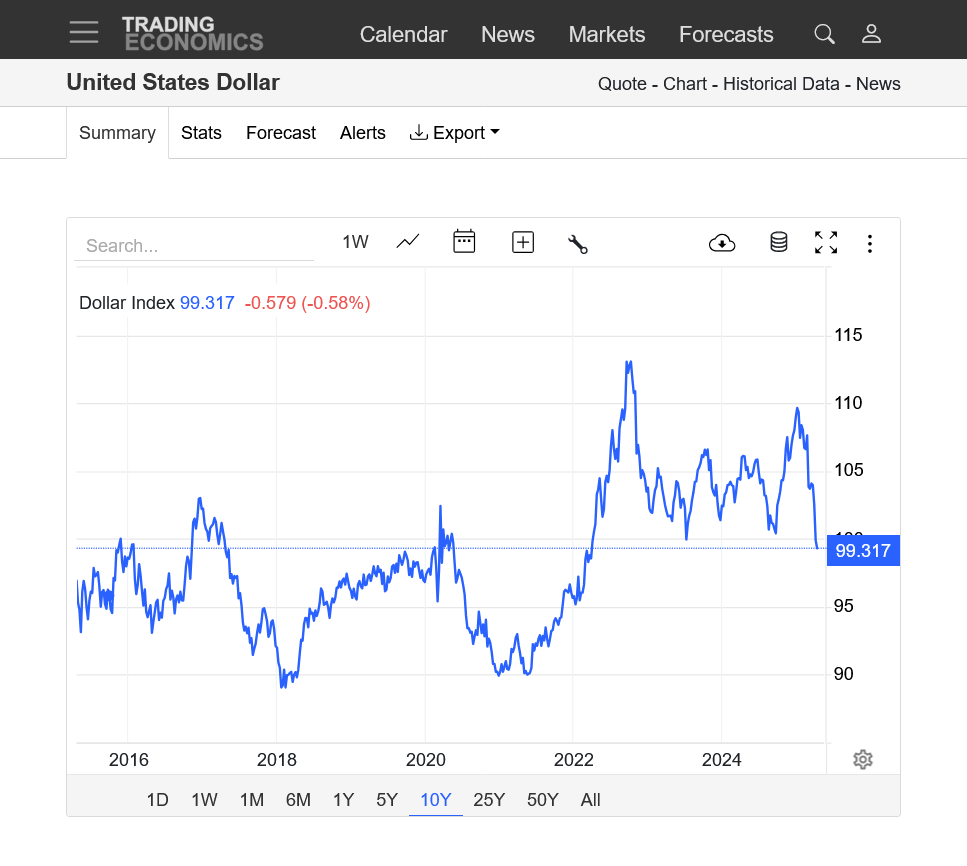
Actually, on the longer term charts it's ALREADY broken out to the downside in a big way!
This could be why the grains are rallying!
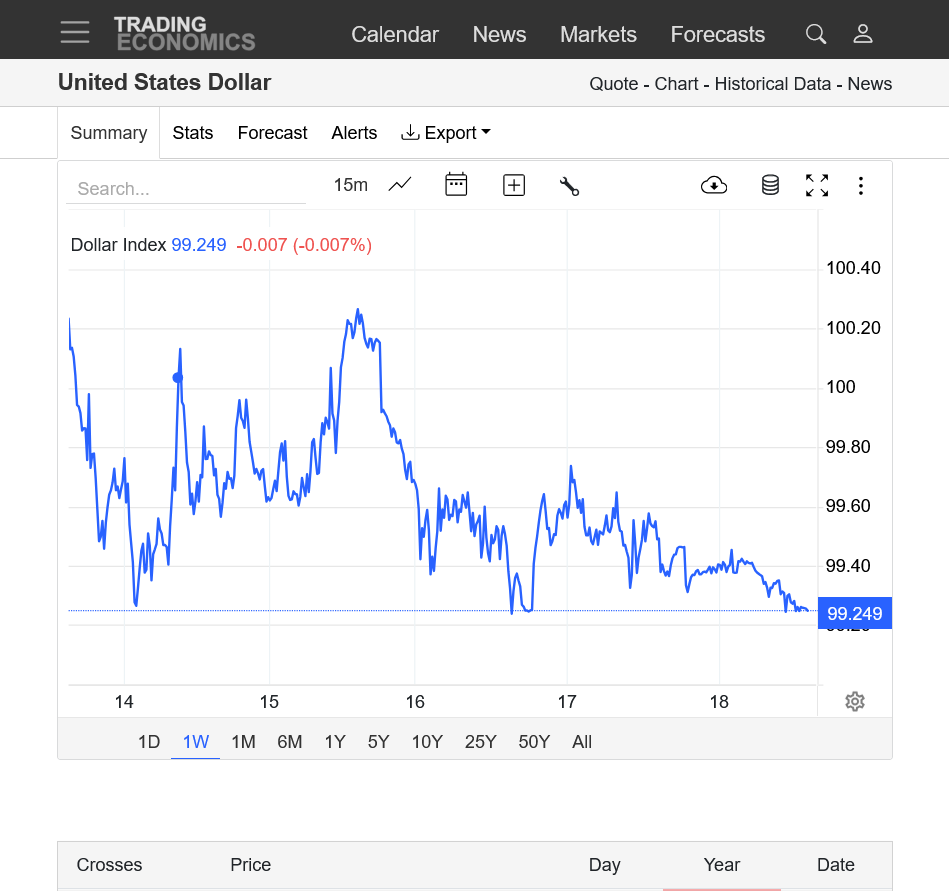
1. 1 month
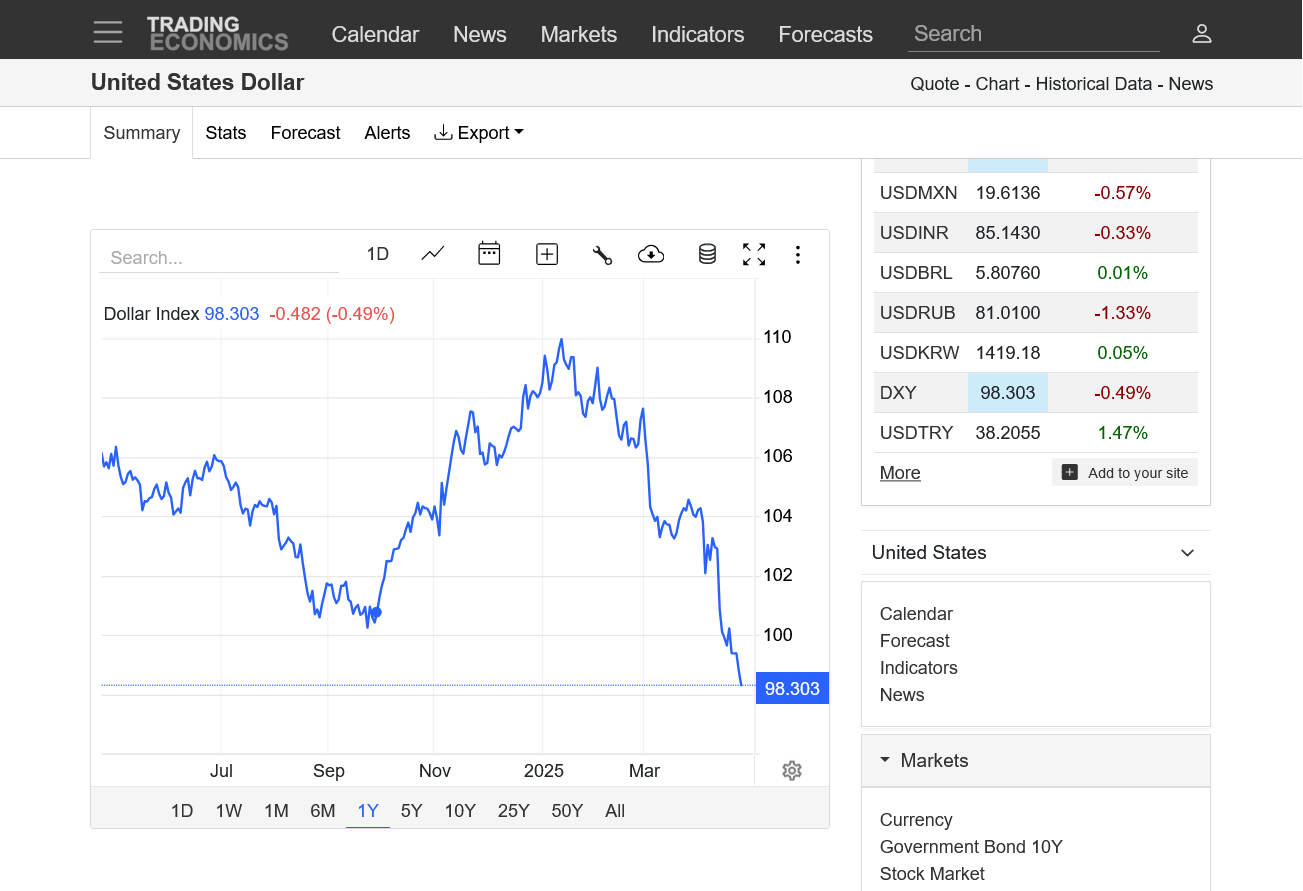
2. 1 year
3. 10 years
https://tradingeconomics.com/united-states/currency 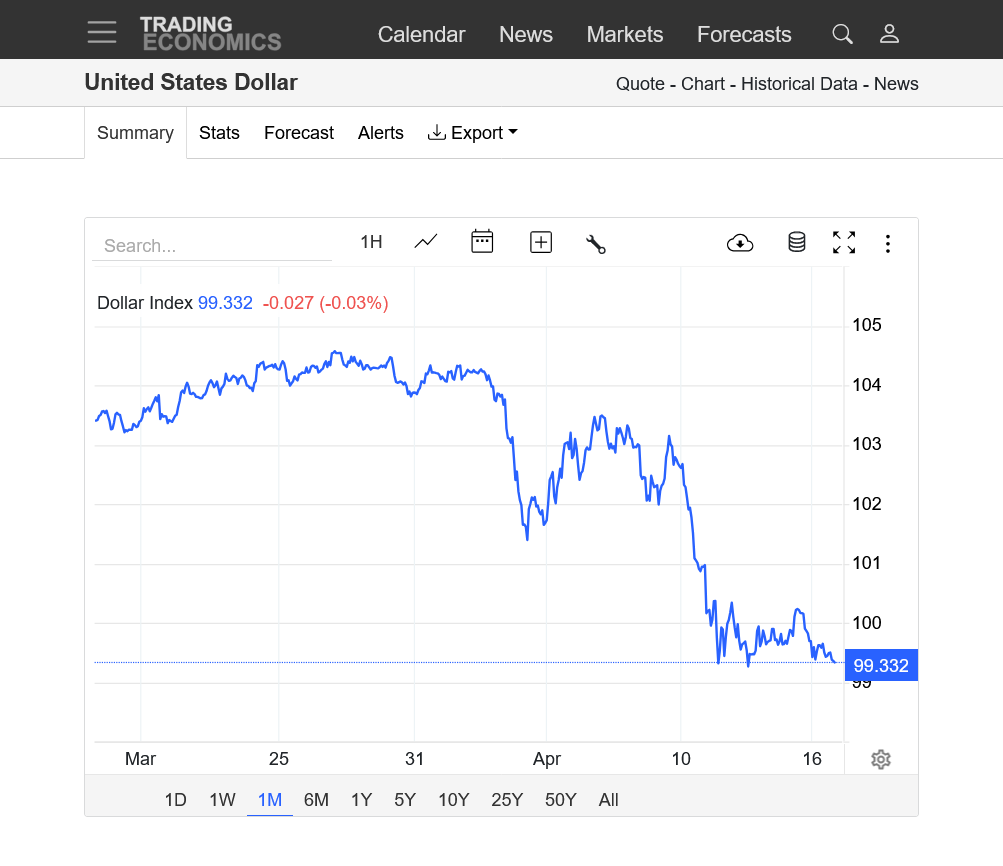
The dollar, which traded with low volume on Friday is at the lows of the week.
https://tradingeconomics.com/united-states/currency
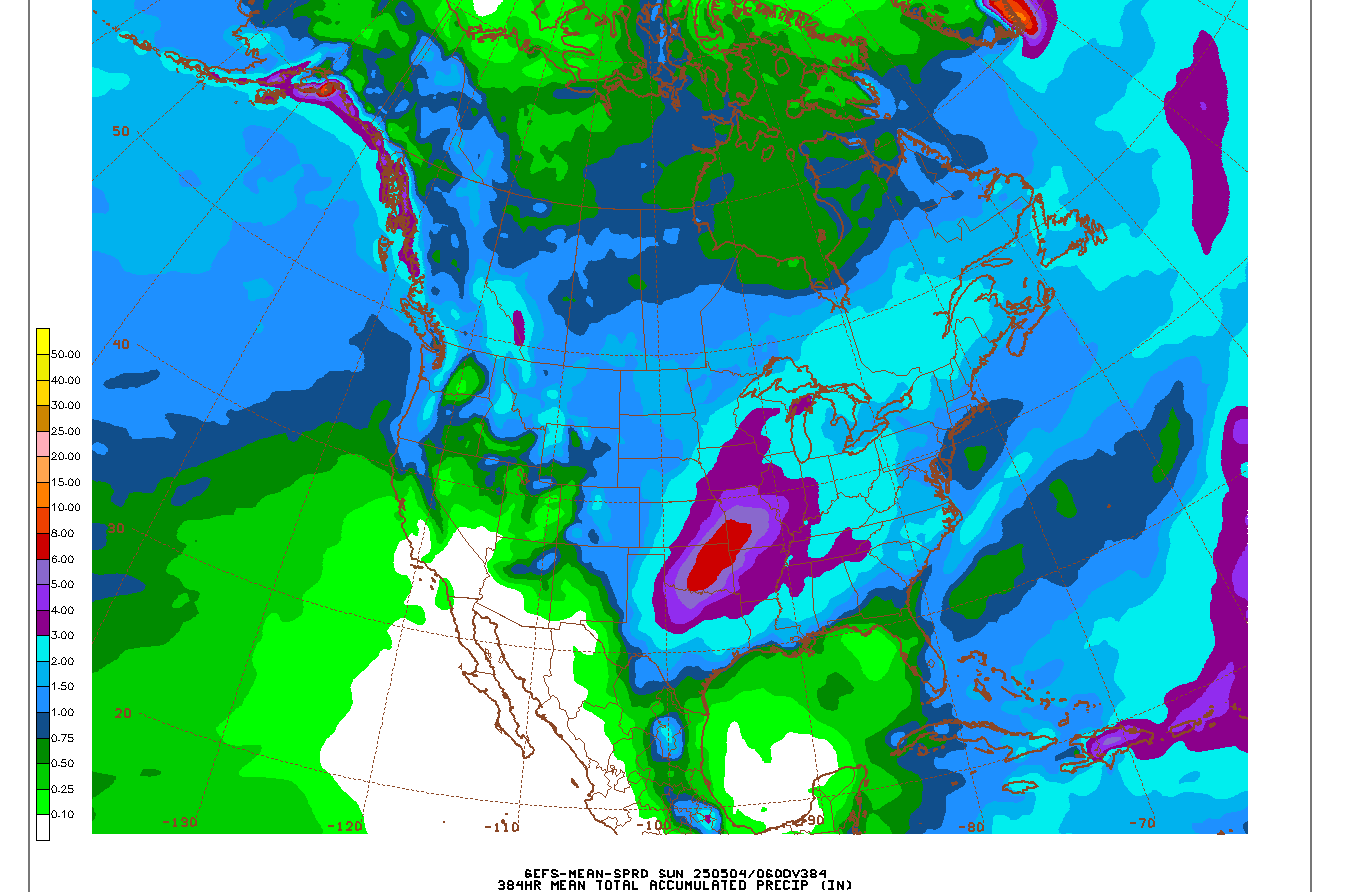
Some heavy rains the next 2 weeks will keep some producers out of the fields until May. It's still early, though.
The rains will also be falling in some dry areas to help replenish soil moisture ahead of the growing season.
https://www.marketforum.com/forum/topic/83844/
https://www.marketforum.com/forum/topic/83844/#83848
7 Day Total precipitation below:
http://www.wpc.ncep.noaa.govcdx /qpf/p168i.gif?1530796126
2 week rains from the 6z GEFS run below:
Re: Re: Re: Re: Re: Weather May 2022
Soilmoisture anomaly:
These maps sometimes take a day to catch up to incorporate the latest data(the bottom map is only updated once a week).
https://www.cpc.ncep.noaa.gov/products/Soilmst_Monitoring/US/Soilmst/Soilmst.shtml#
![]()
++++++++++++++++++++++++++++
Updated daily below:
https://mrcc.purdue.edu/cliwatch/watch.htm#curMonths
NEW LINK:
https://www.drought.gov/current-conditions
DROUGHT MONITOR
https://droughtmonitor.unl.edu/
The Dollar resumed it's Trump crash lower.
Clearly a downside break out at every time frame below.
1. 1 year
2. 10 years
This is probably supporting the grains with an expectation of increased exports with our products being cheaper because of the devalued currency.
https://tradingeconomics.com/united-states/currency
Rains this week will fall in some places that need it the most!
The markets could be trading tariff news more than weather.
All the weather here:
https://www.marketforum.com/forum/topic/83844/
https://www.marketforum.com/forum/topic/83844/#83848
7 Day Total precipitation below:
http://www.wpc.ncep.noaa.govcdx /qpf/p168i.gif?1530796126
Re: Re: Re: Re: Re: Weather May 2022
Soilmoisture anomaly:
These maps sometimes take a day to catch up to incorporate the latest data(the bottom map is only updated once a week).
https://www.cpc.ncep.noaa.gov/products/Soilmst_Monitoring/US/Soilmst/Soilmst.shtml#
![]()
++++++++++++++++++++++++++++
Updated daily below:
https://mrcc.purdue.edu/cliwatch/watch.htm#curMonths
Support for all MRCC-hosted products and services is currently suspended as of April 17, 2025, due to a lapse in federal funding from the Department of Commerce through NOAA.
NEW LINK:
https://www.drought.gov/current-conditions
DROUGHT MONITOR
https://droughtmonitor.unl.edu/
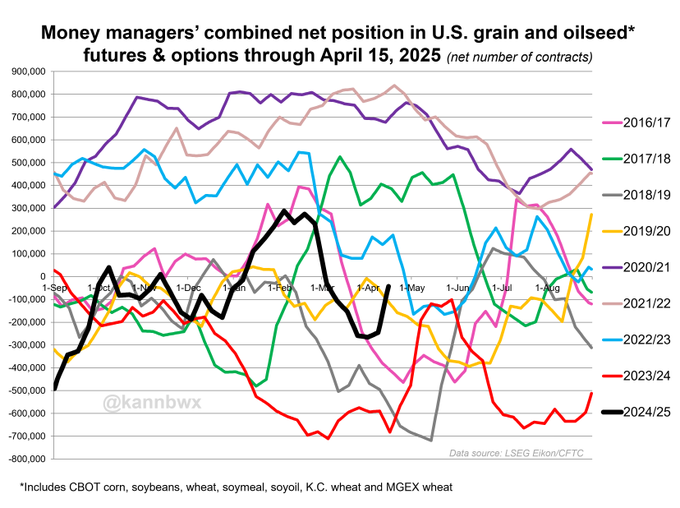
Here is THE reason for the recent strength in corn/beans. WOW!!
Are funds buying big because of the weaker dollar?
Is the buying AHEAD of the tariffs?
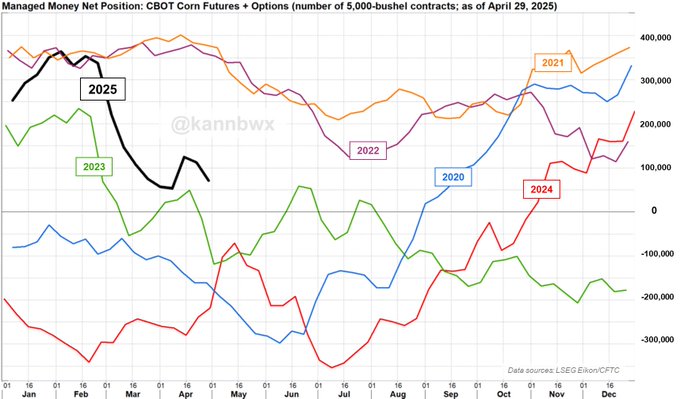
Money managers were net buyers across the board in US grain/oilseed futures & options in the week ended April 15. Weekly position changes: Corn +71k contracts Beans +77k Meal +28k Soyoil +11k CBOT wheat +5.7k KC wheat +2.5k Min wheat +7.7k
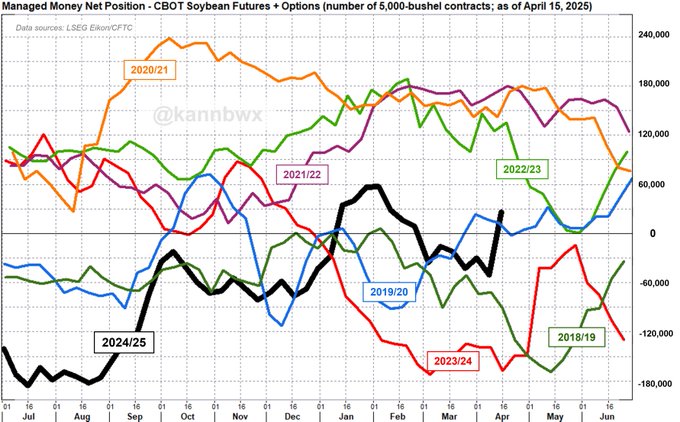
Managed money, week ended April 15, CBOT futures & options:#Corn: net long of 124,573 contracts (+71k on the week)#Soybeans: net LONG of 26,169 contracts (+76.6k on the week) Both moves incorporated new longs and short covering.
Is this AHEAD of the tariffs and also taking advantage of the lower dollar?
The world is low on corn and animals need to eat.
Last week's U.S. #corn & #wheat export inspections top trade expectations for a second straight week, while #soybeans come in mid-range. Just one bean cargo was destined for China. Mexico, Japan & S Korea were the top corn destinations and Vietnam was #1 for wheat.
https://www.agriculture.com/april-usda-wasde-report-11712631
https://en.macromicro.me/collections/53/agri-corn/758/global-corn-stock-to-demand-ratio-monthly
%20Corn%20Collection%20MacroMicro.png)
+++++++++++++++
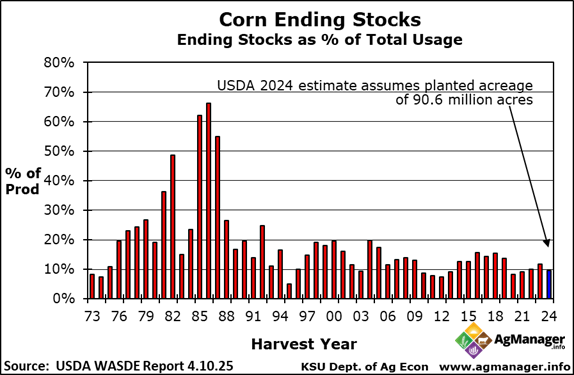
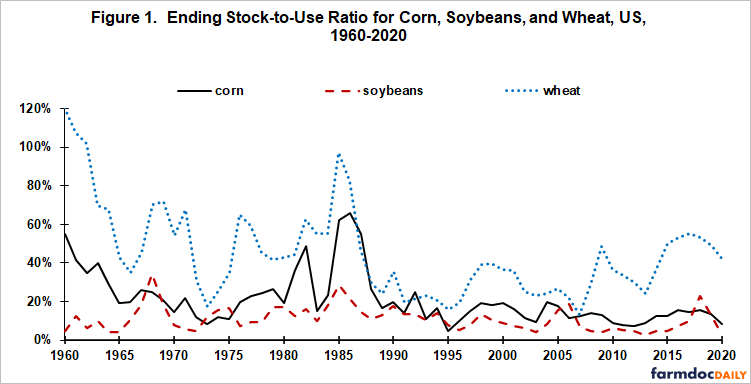
You can see at the chart below what happened in the 1980's during the Reagan years. Massive surplus built up thru the mid 1980's with rock bottom prices that bankrupted an enormous number of mainly small farms. There were other factors, including farms financed in the 1970s, paying EXTREMELY HIGH interest rates.
This was DESPITE there being major droughts in 1980, 1983 and 1988 (before climate change protected our crops-with only 1 major, widespread drought-2012 since them).
For some farms, it was a 1-2-3 punch.
1. High interest rates to finance their property
2. Extremely low crop prices
3. Droughts
Farming is near the top for risky professions and this was the perfect storm to demonstrate that!
A big part of it was the US Dollar at record highs for this period!
https://www.statista.com/statistics/1404145/us-dollar-index-historical-chart/
%20historical%20data%201973-2025%20Statista.png)
IT WAS BAAAAD! And Reagan turned his back on the farming community!
https://en.wikipedia.org/wiki/1980s_farm_crisis
https://www.iowapbs.org/iowapathways/mypath/2422/farm-crisis-1980s
"It's the same old story—Reagan helps the rich, and Lord help the rest of us."
https://barnraisingmedia.com/jim-hightower-confronts-the-1980s-farm-crisis-reagan/
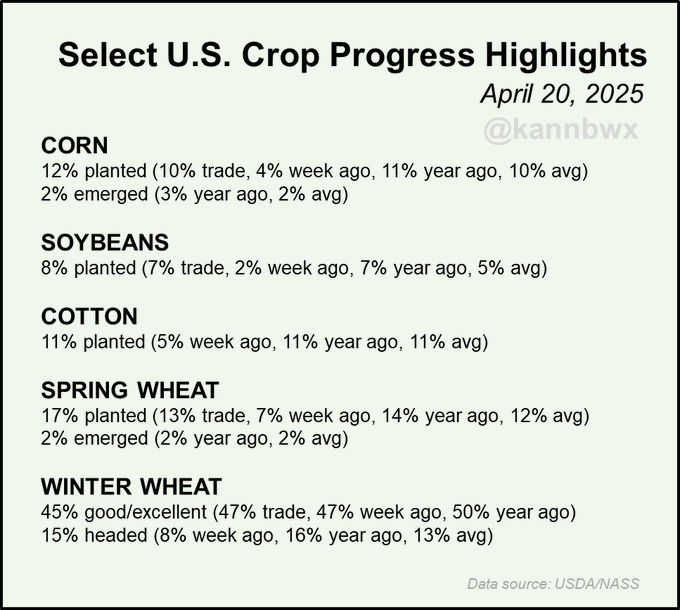
U.S. corn was 12% planted as of Sunday, slightly ahead of the average and trade expectations. Soybeans, spring wheat and cotton planting are all at or ahead of their normal planting paces at this early stage.
This report is a tad bearish and the weather is very bearish but the funds have been buying like crazy and pumping up the price.
The heaviest rains will be falling exactly where they are needed most in the Cornbelt to replenish soil moisture ahead of the growing season!
It's too early to worry about planting delays, especially with planting a bit ahead of the average pace.
1. Freeze frame forecast early Tuesday.
2. Constant update with link
3. Drought Monitor-next update Thursday
4. All the comprehensive weather
+++++++++++++++
+++++++++++++++++++++++
7 Day Total precipitation below:
http://www.wpc.ncep.noaa.govcdx /qpf/p168i.gif?1530796126
https://www.marketforum.com/forum/topic/83844/#83853

Get all the comprehensive weather here:
Best weather on the internet, Eric is back!!!
Interesting read from the archives. In March 2011, agronomists worried U.S. #corn yields may not grow quickly enough to meet rising global demand. Record then was 164 bu/acre (179 now). Monsanto in 2008 pledged to double yields by 2030 (against 2000 base - so 274 bpa by 2030).
+++++++++++++++++
USDA's longterm projections in 2011 put 2020/21 US corn yield at 180 bpa. This year, 2034/35 yield was slated at 200 bpa. Does U.S. #corn yield need to keep rising? Maybe to meet production costs, but to feed the world?
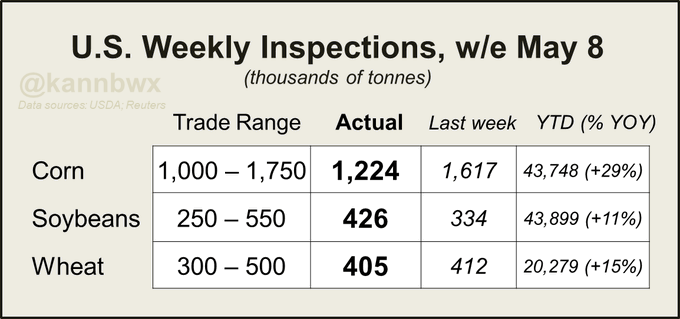
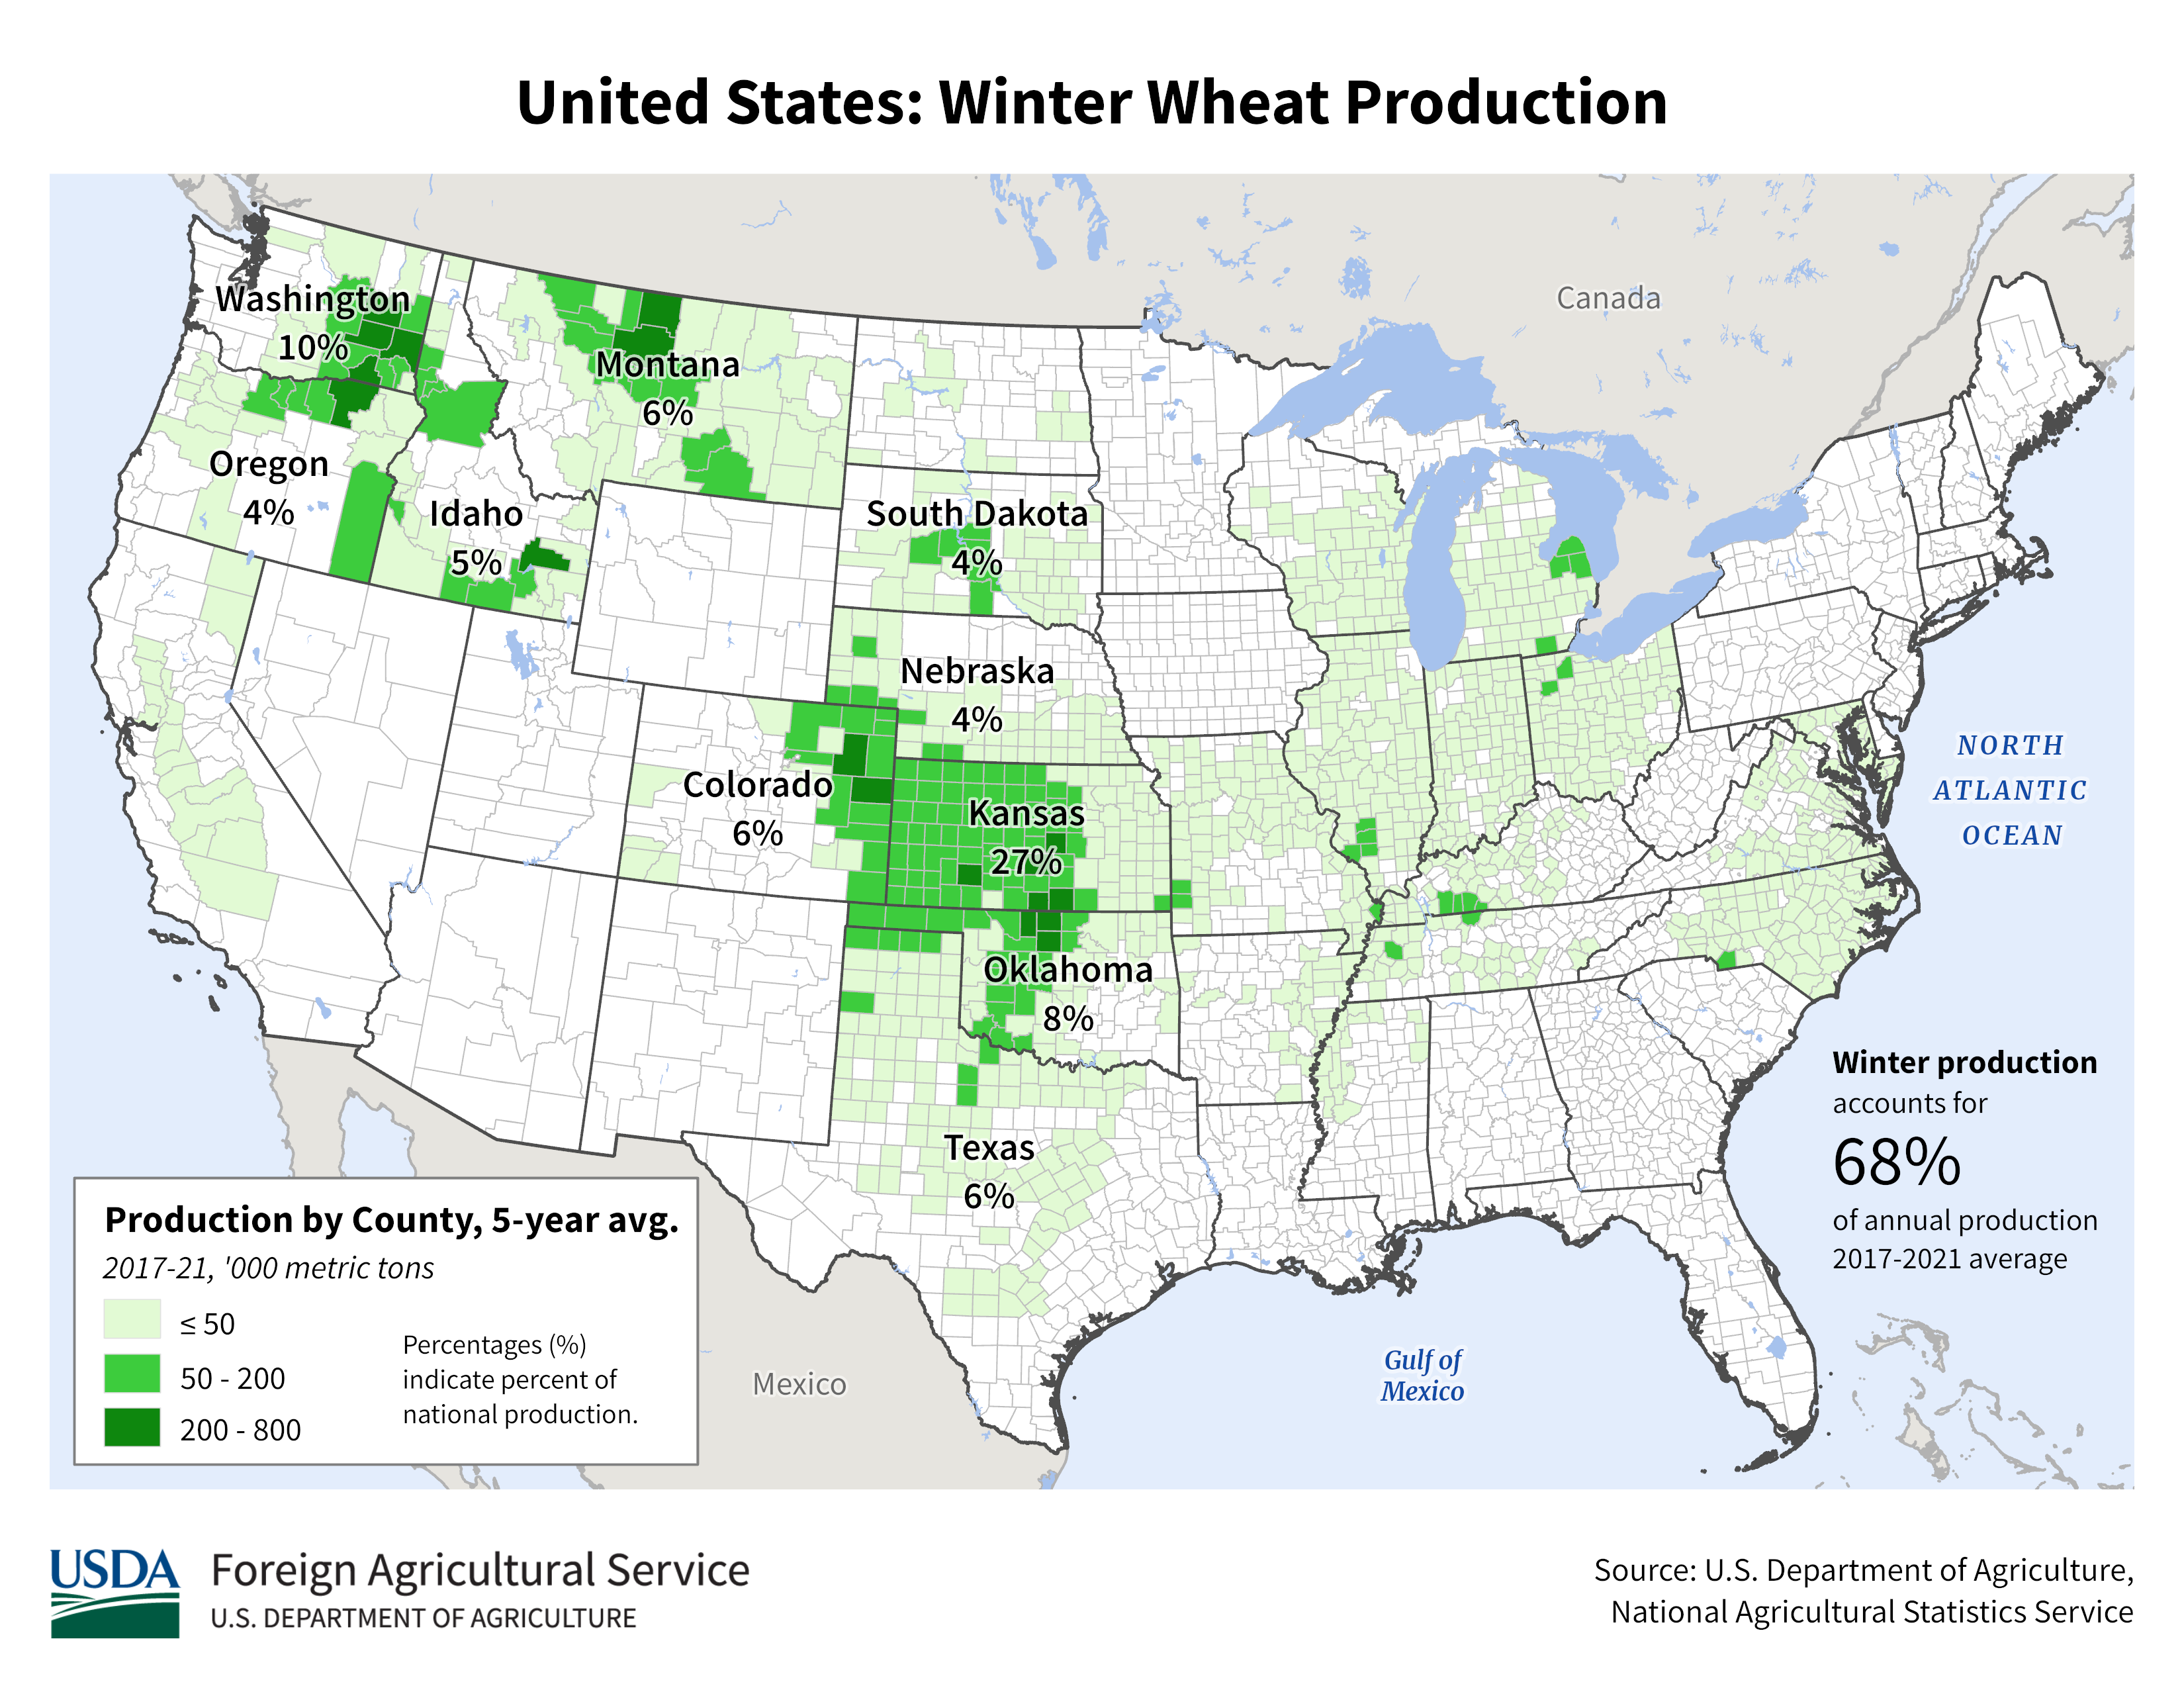
U.S. #wheat export inspections last week hit a 7-month high, exceeding trade estimates for a 2nd consec week. Destinations were diverse. #Corn inspections landed at the top end of the range while #soybeans - although the lowest since start of MY - were avg for date.
It has been more than 2 months since weekly soybean inspections could be considered "poor" - they are holding up well through this period. Corn continues to understand the assignment - volumes have been above avg for most of the MY. Wheat finishing 24/25 on a strong note.
Money managers were net buyers of CME live #cattle fut&opt in the week ended April 22, lifting their net long to 120k contracts - representing strongly bullish sentiment. Only time funds were more bullish cattle in April was 2019. June futures hit contract highs on Wed.
++++++++++++++++
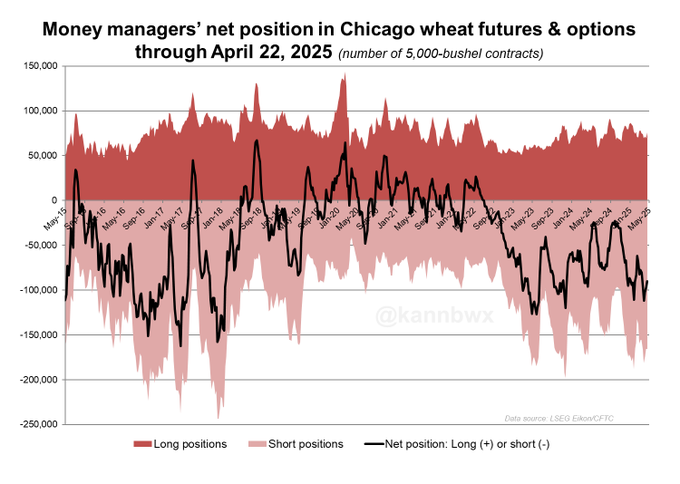
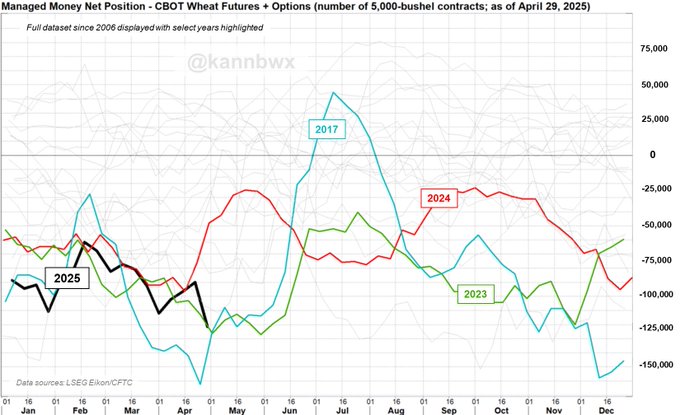
Funds have held a net short in CBOT #wheat futures & options for a record 147 weeks (since June 2022). The prior record (since 2006) was 100 weeks between mid-2015 and mid-2017. Their net short was at 90k contracts as of April 22, marking a 3rd straight week of mild net buying.
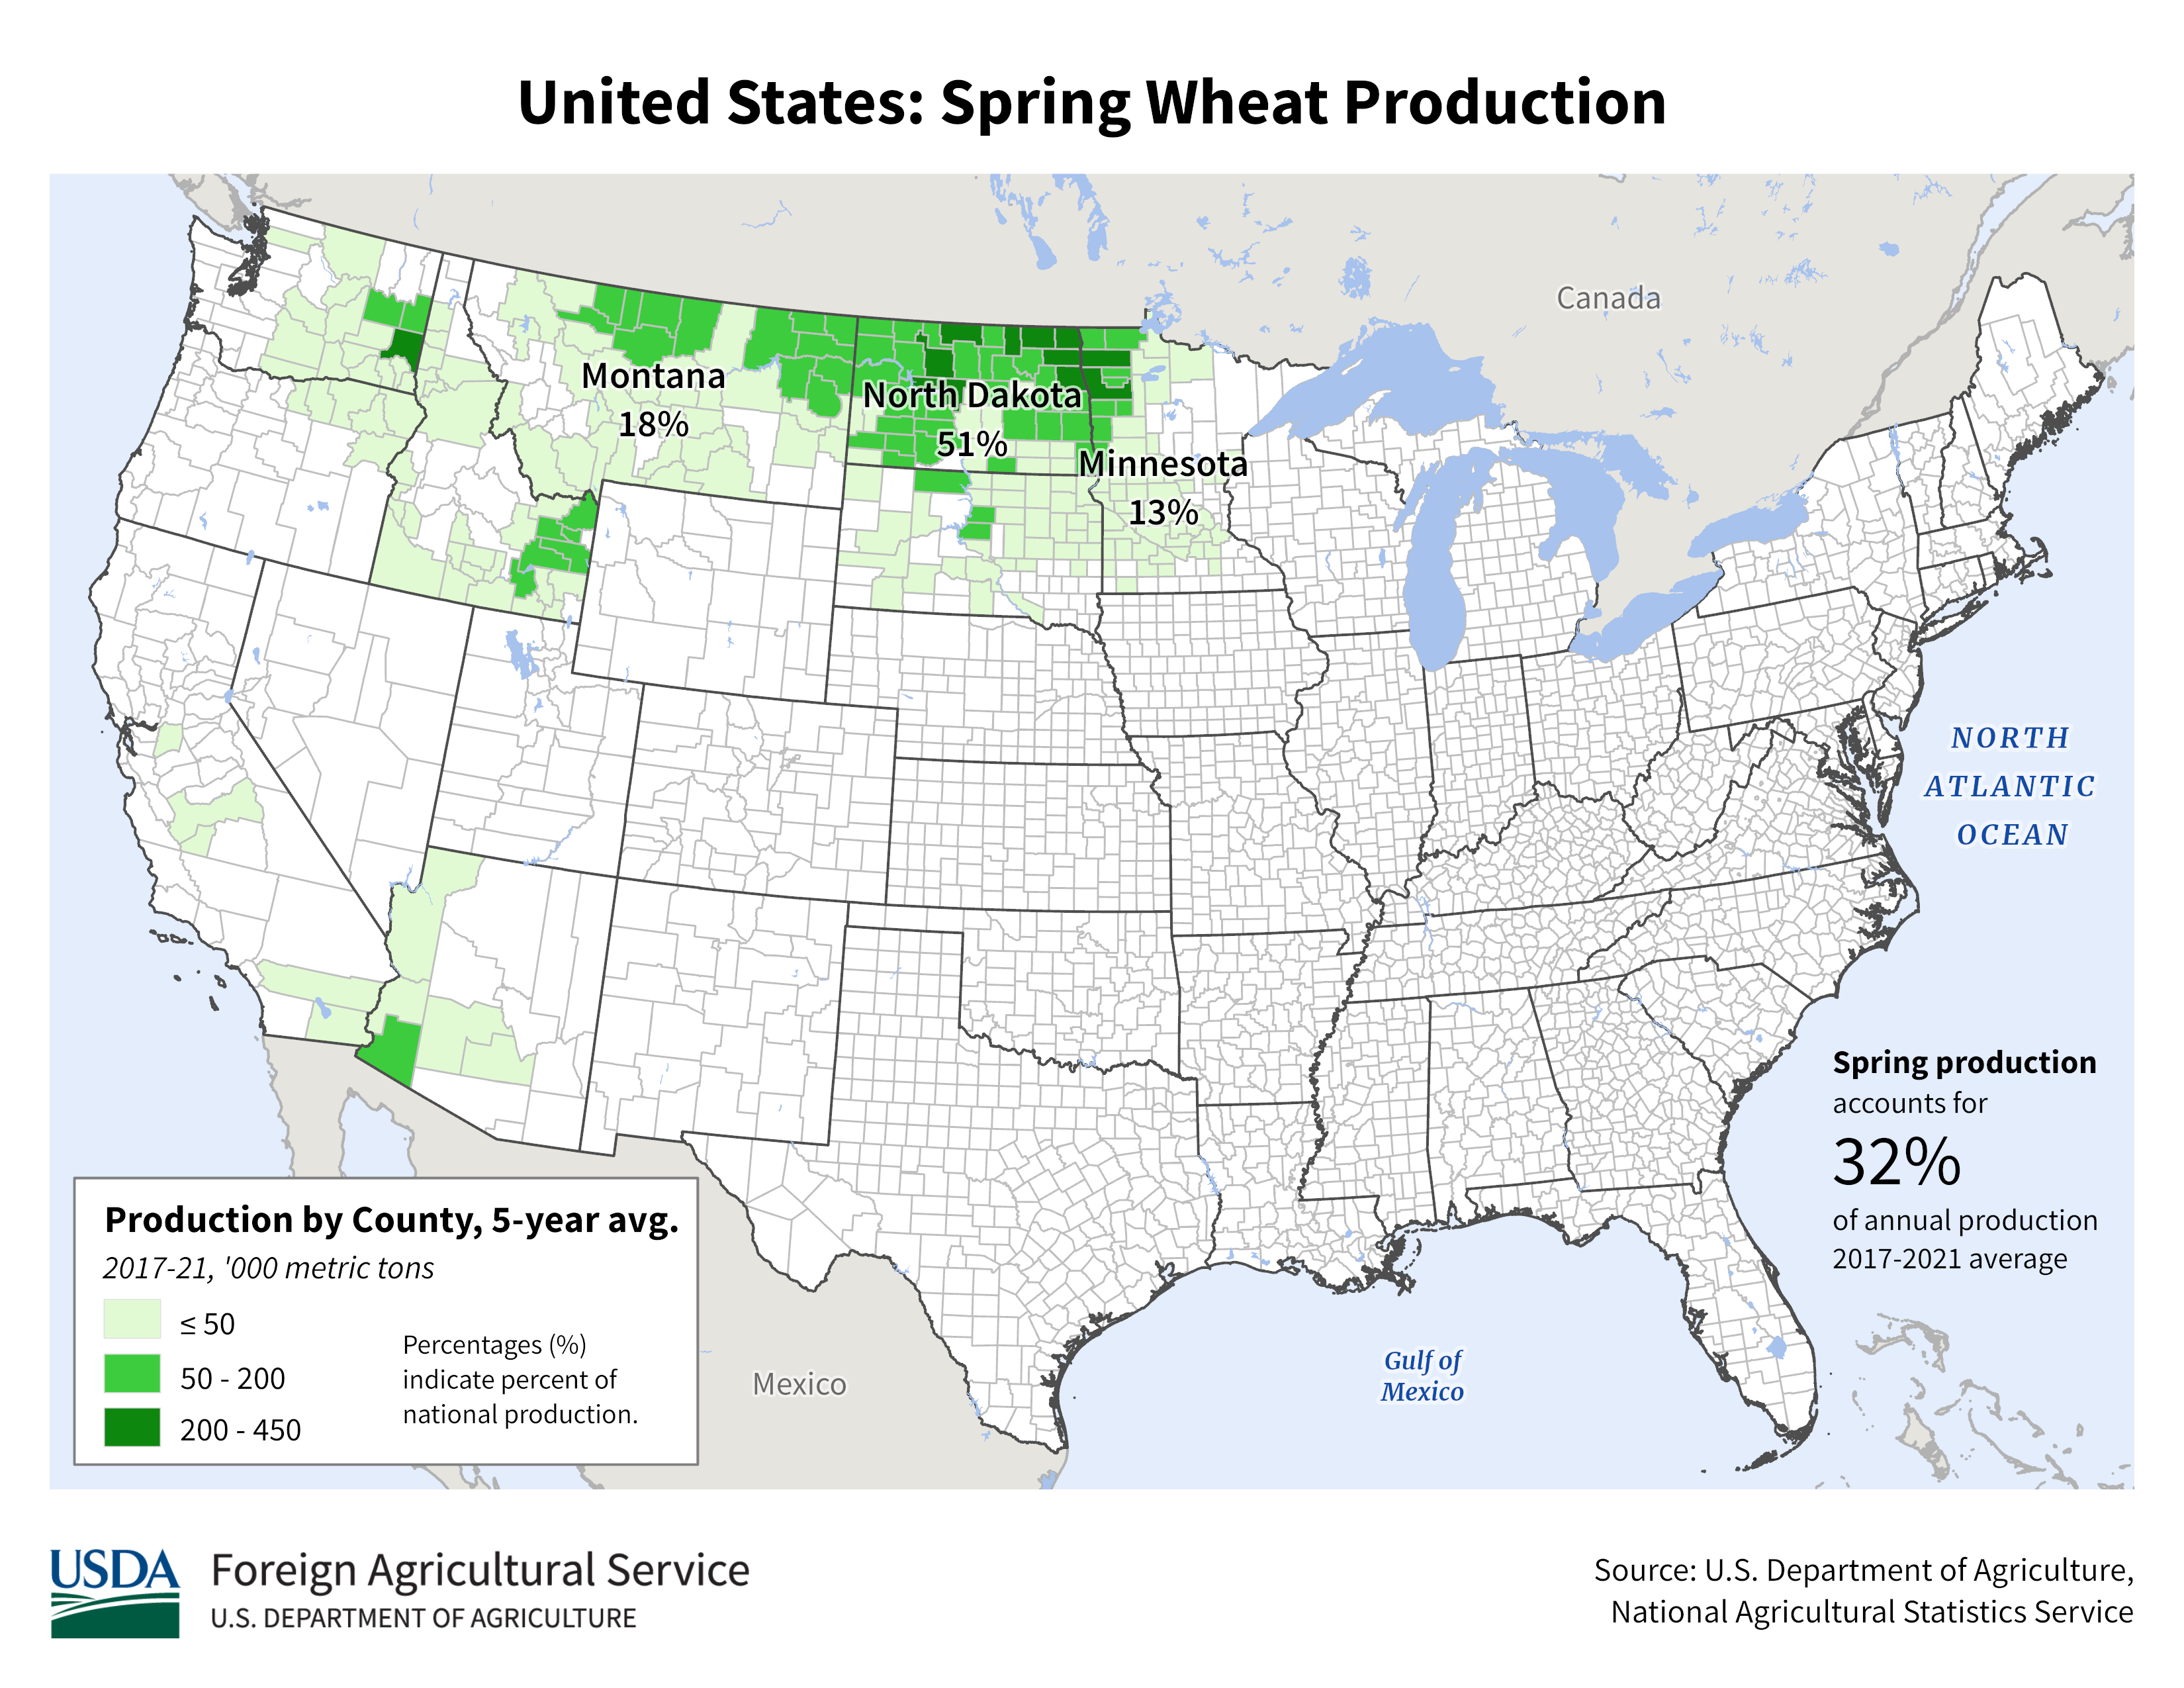
U.S. spring planting is moving at a quicker-than-average pace and very similar to the year-ago pace. #Corn is 24% planted, though a couple states are behind due to recent rains. Winter #wheat conditions jumped - they are now equal to a year ago.
#Corn planting at 24% complete isn't fast or slow - very normal for the date (considering recent years). In fact, it might be fair to say that NEITHER corn nor beans are on an unusual planting pace - both what you would expect given recent weather, planting trends and technology.
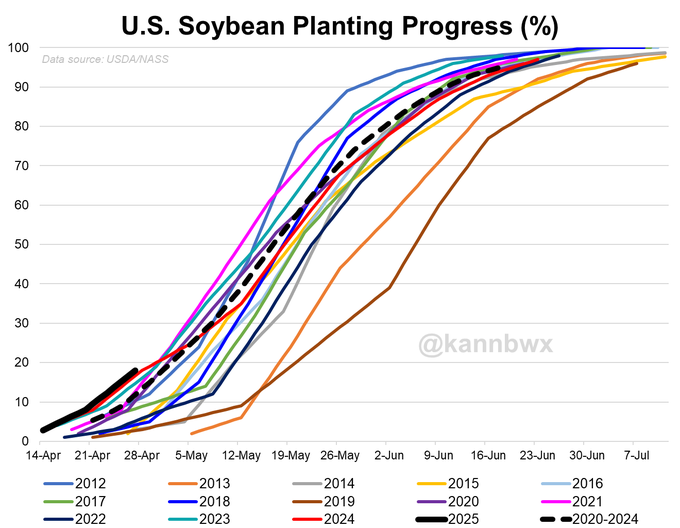
RECORD-FAST planting of U.S. #soybeans in 2025: 18% done as of April 27. Both 2023 & 2024 set record paces by this date, too. This is most likely due to U.S. farmers planting beans earlier & earlier - even before #corn. That trend has really picked up in the last few years.
Eric's awesome weather:
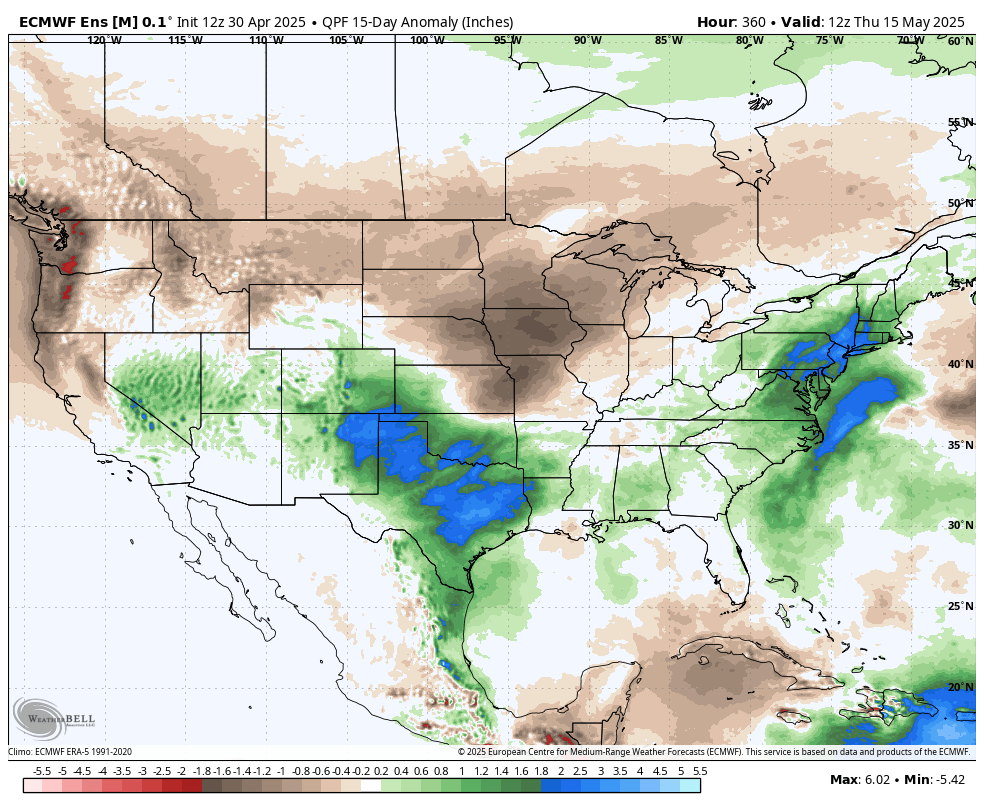
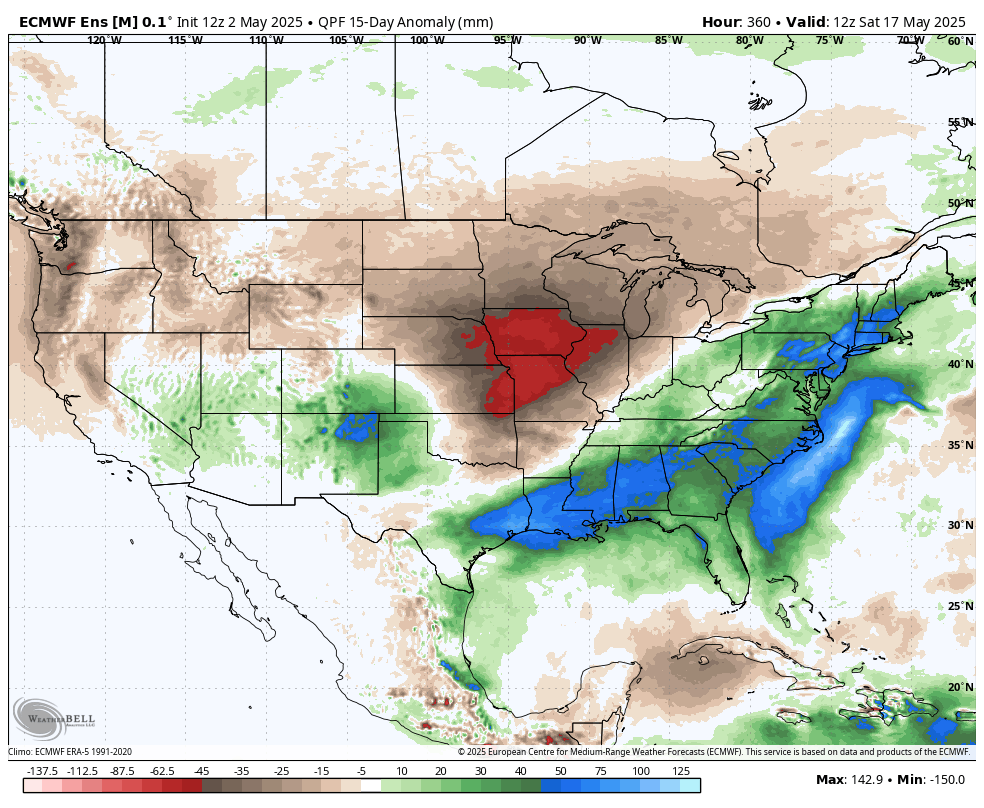
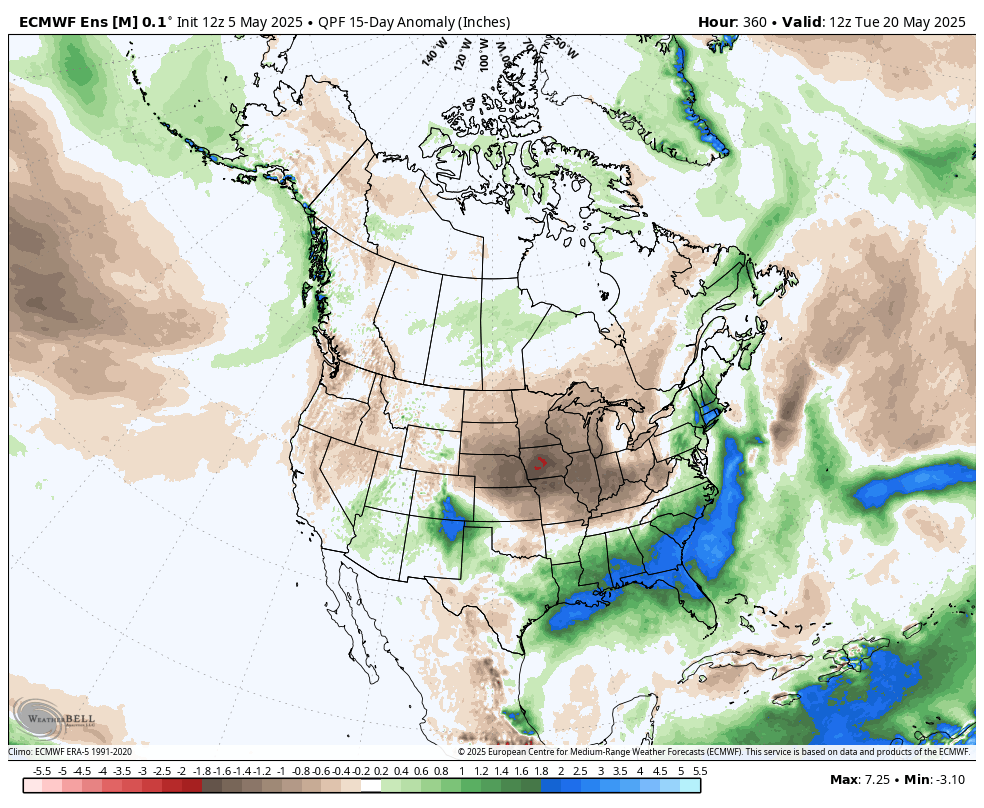
We have a major drying pattern for the first 2 weeks of May in the Midwest. These are the 15 day precip anomalies from this last 12z European Ensemble model.
In the Summer, this would be VERY bullish. In early May? Perfect for timely planting but still a bullish element because much of that area is dry right now AND that same area has a higher risk for a hot/dry Summer.
Note that the key state of Iowa is at the epicenter of the upcoming 2 week dry pattern. Some very warm temps will elevate evaporation rates.
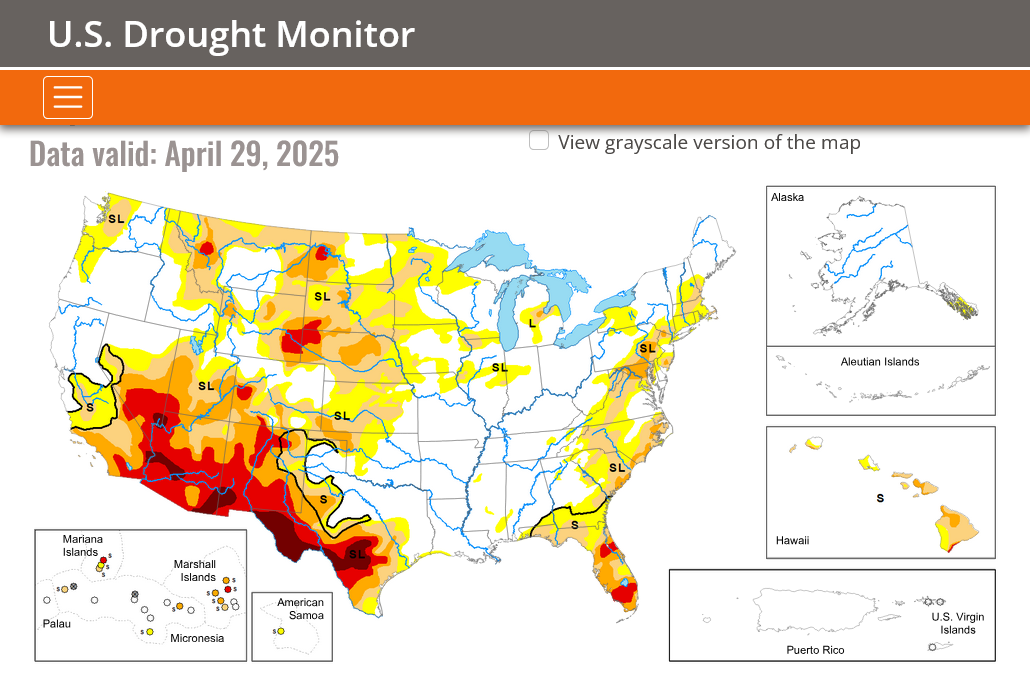
This will EXPAND the current drought and elevate the level in those areas (further deplete low soil moisture reserves in the drier spots)
DROUGHT MONITOR
https://droughtmonitor.unl.edu/
++++++++++++
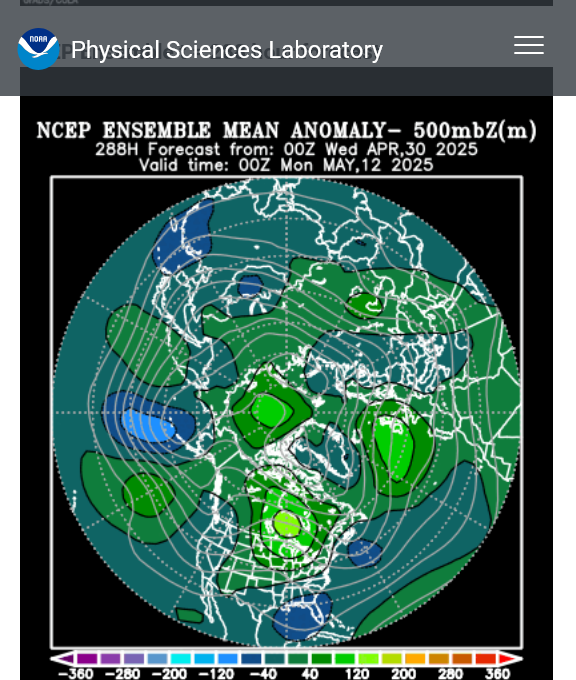
How long with this positive upper level anomaly last? Models break it down late in week 2 but if it continues beyond that, it will turn the weather pretty bullish from an early drought scare:
https://www.psl.noaa.gov/map/images/ens/z500anom_nh_alltimes.html
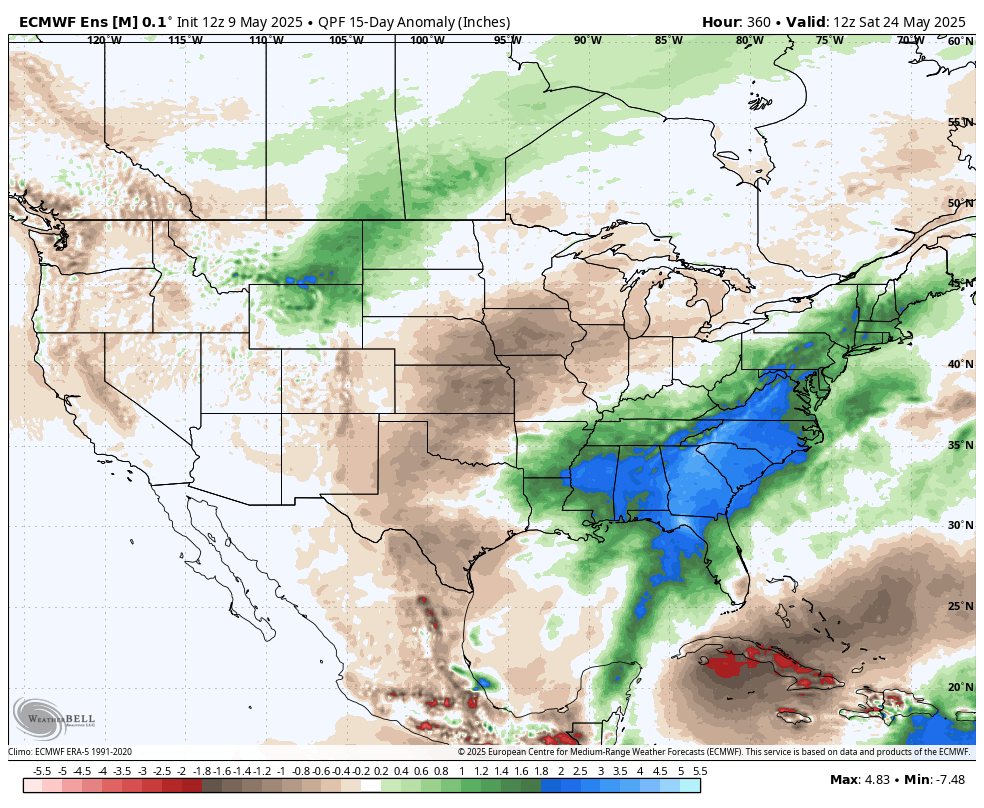
2 week rain anomalies for the just out 12z European Ensemble model.
No rain in the Midwest.
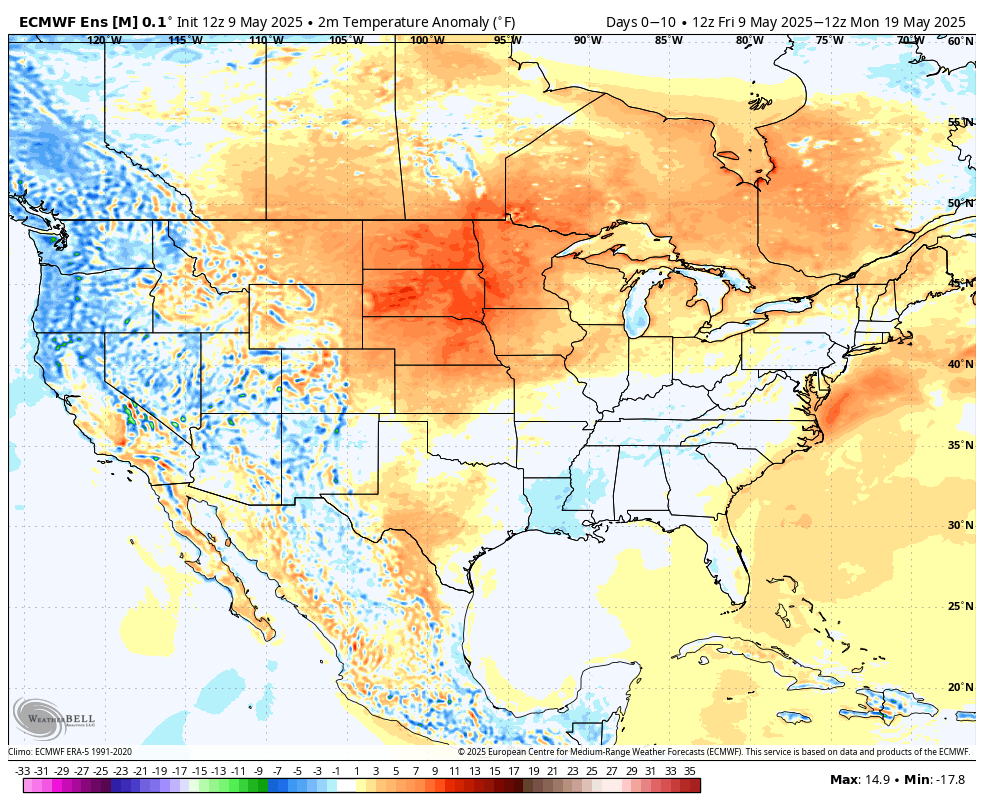
2 week temperature anomalies:
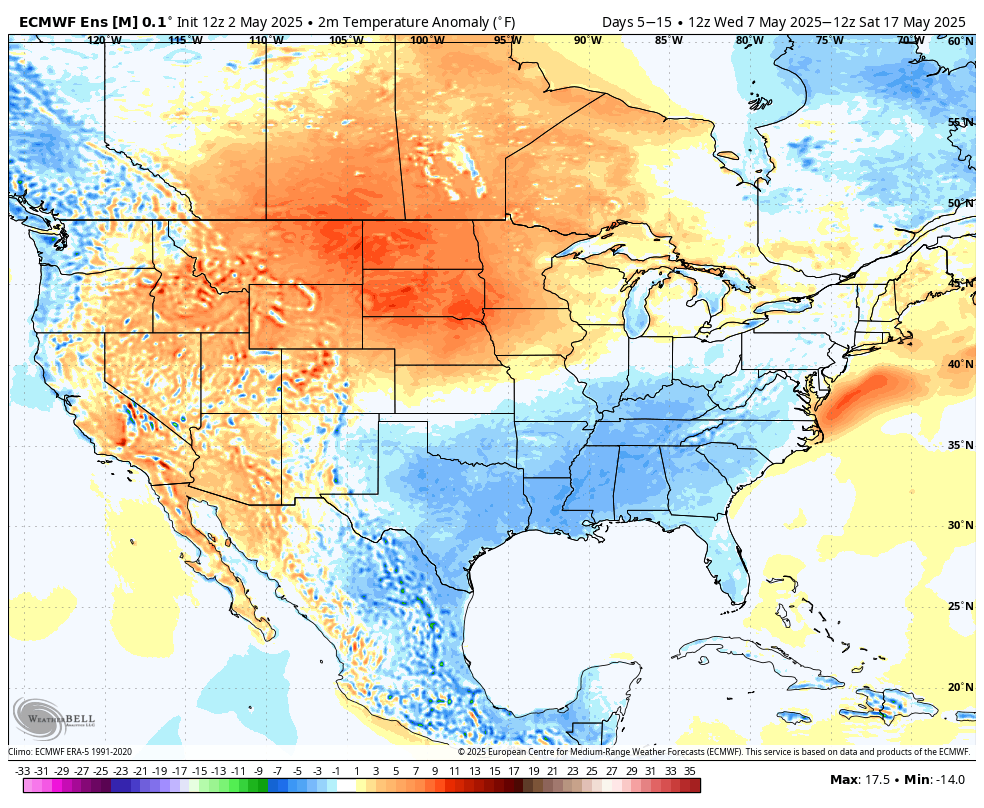
Drought WILL BE expanding in the Midwest to the C/N Plains!
Thanks, cutworm!
That didn't copy but I'll be more than happy to do that for you with thanks for pointing us to such a wonderful source!
Funds sold CBOT #corn fut&opt in the week ended April 29. Net long dropped to 71k contracts, down about 41k on the week. Pattern looking a bit like 2023 so far, though different forces have been at play. July corn ended at $4.69/bu on Friday. Same date in 2023 = $5.80.
Money managers sharply sold CBOT #wheat futures & options in the week ended April 29. The resulting net short of 121k contracts is their largest in two years. CBOT wheat bounced more than 3% Wed-Fri, settling at $5.43 per bushel on Friday. That's the date's lowest since 2020.
+++++++++++++++++++++
China first became the top destination for U.S. #soybeans in 1999/00. It has remained on top ever since even though its share of total U.S. bean exports has declined in recent years. Before 1999/00, Japan & the Netherlands went back and forth as the #1 U.S. soy destination.
2024/25 export sales of U.S. #soybeans are up 13% from a year ago, but sales to top buyer China are down 6%. Trends are mixed among these top destinations, which account for 86% of total 2024/25 sales.
May 1
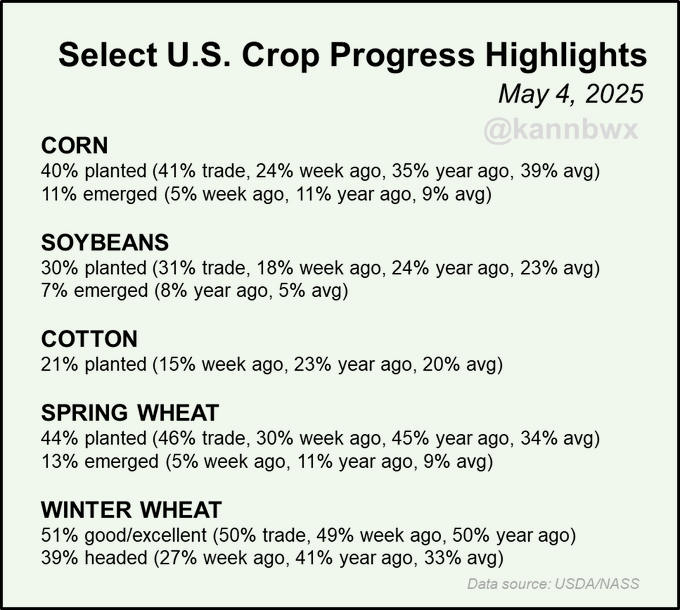
The planting paces of U.S. #corn & #soybeans are above average, but both made slightly less progress last week than analysts expected (add spring #wheat to that, too). Winter wheat conditions improved again and are very similar with the year-ago ones.
+++++++++++++++++++
Entire report here:
Oats planting 71% done vs 64% average
Cotton 21% complete vs 20% average
15 day rainfall anomaly from the last 12z European Ensemble:
Very wet deep south, dry Northern Plains to entire Midwest.
The most awesome weather on the internet.
Heeere's Eric:
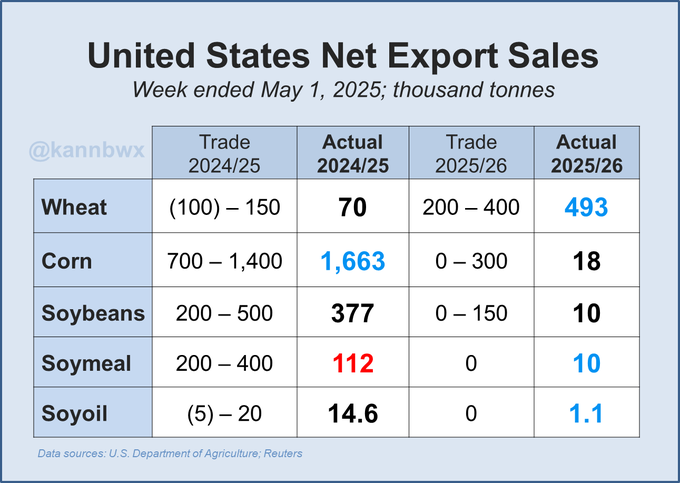
Old-crop U.S. corn export sales beat expectations last week with a lot of the usual destinations involved. Old-crop net soybean sales hanging in there too - Mexico and unknown topped the list. New-crop wheat sales exceeded trade estimates, led by unknown and South Korea.
This is the largest (& first) daily sale of U.S. #soybeans to Pakistan since June 2022. Another tidbit: So far in 2025, Pakistan is the #5 destination for Brazilian beans. Some 1.9% of Brazil's 2025 soy exports have been destined for Pakistan (above the recent average).
@kannbwx
USDA confirms the following U.S. export sales:205,000 tonnes of #corn to Mexico (40kt for 2024/25, 165kt for 25/26)15,000 tonnes of corn to unknown in 2024/25225,000 tonnes of #soybeans to Pakistan in 2025/26
Great planting for many areas. At some point very warm/dry will turn bullish.
2 week rain deviation from average from the last 12z European Ensemble model:
10 day temperature deviation from average:
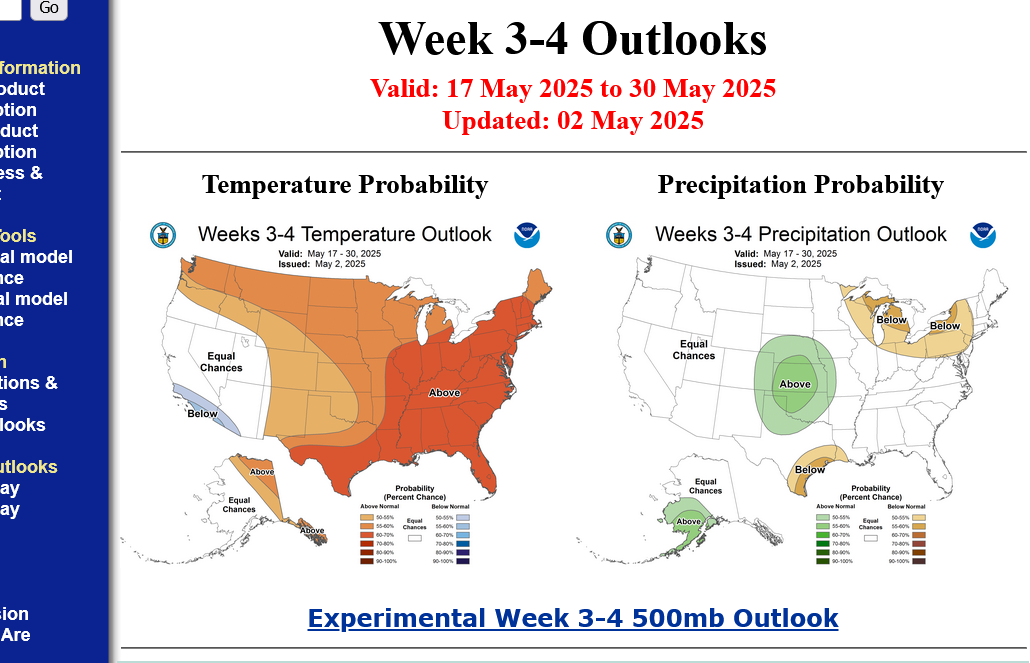
Low skill time frame below and this one is even LOWER than average:
https://www.cpc.ncep.noaa.gov/products/predictions/WK34/
| Week 3-4 Outlooks | |
| Valid: 24 May 2025 to 06 Jun 2025 Updated: 09 May 2025 | |
Temperature Probability | Precipitation Probability |
++++++++++
7 Day Total precipitation below:
http://www.wpc.ncep.noaa.govcdx /qpf/p168i.gif?1530796126
Turning much wetter week 2????
https://www.youtube.com/watch?v=6aYDQT6ymfk
+++++++++++++++++=
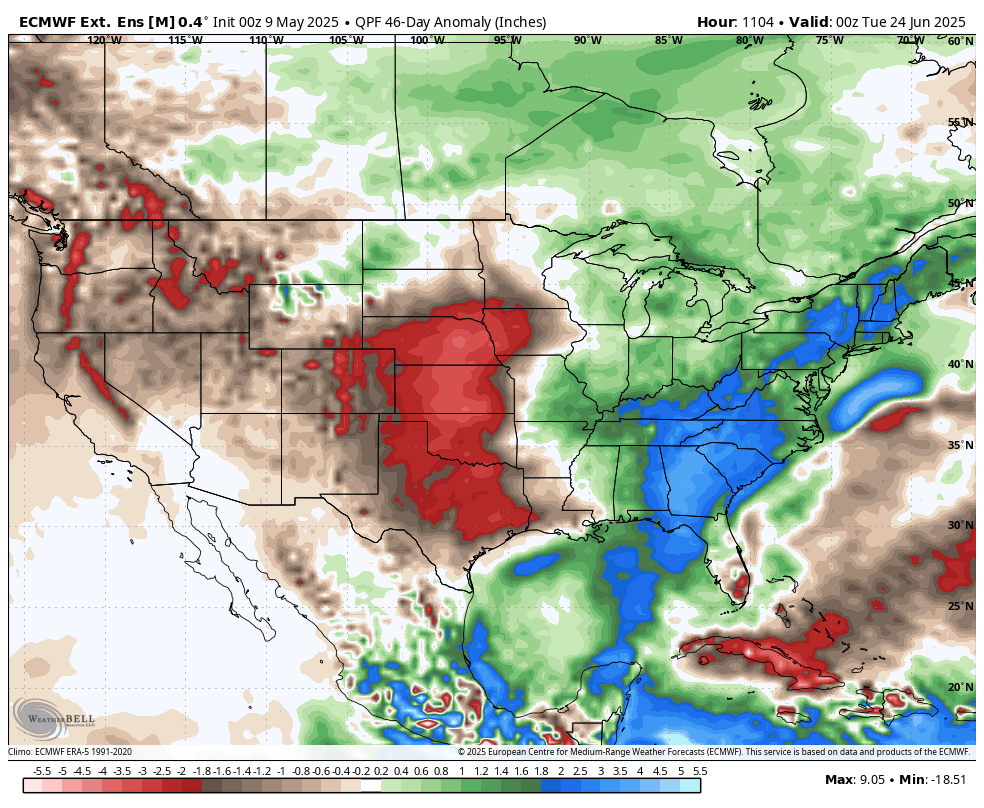
1. European model 46 day rain anomaly. From this mornings 0z run.
2. European model 46 day temp anomaly.
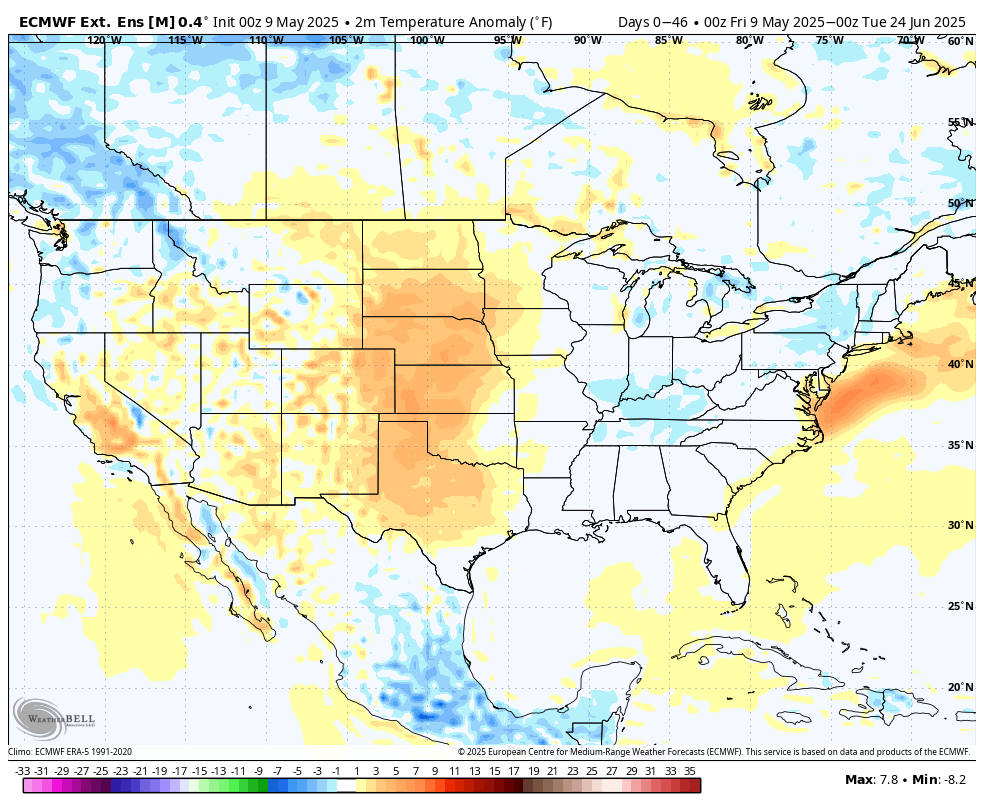
Ryan Hall Y'all: May, 10, 2025
Nov Beans up 20 on China trade deal news
Thanks, cutworm!
Couldn't hold those gains ahead of the USDA report in 14 minutes.
Last week's U.S. export inspections were well aligned with trade expectations. No grains or oilseeds were inspected for export to China, though.


