Actually, I’ve been following RONI since 2023:
https://twitter.com/BenNollWeather/status/1793235394219434190
“In a warming world, it's becoming increasingly difficult to disentangle El Niño events from the climate change signal. In other words, when the entire equatorial Pacific Ocean is anomalously warm -like it was in recent months- it can be hard to distinguish the signal from the noise!
The Relative Niño 3.4 Index is calculated by subtracting the tropical mean sea surface temperature anomaly (20˚N-20˚S) from the Niño 3.4 Index and multiplying by a scaling factor.This is distinctly different from the traditional Niño 3.4 Index, which is a difference from a 30-year long-term average.
The relative index describes the onset of convection better, is not contaminated by global warming, and can be monitored and forecast in real-time. The relative index also demonstrates reduced sensitivity to climate change and multidecadal variability.
This suggests that La Niña-like atmospheric patterns may build in the months ahead, likely starting before an official La Niña event is classified by most international centers. This is of significance to hurricane season in the Atlantic Ocean and weather patterns across the planet.”
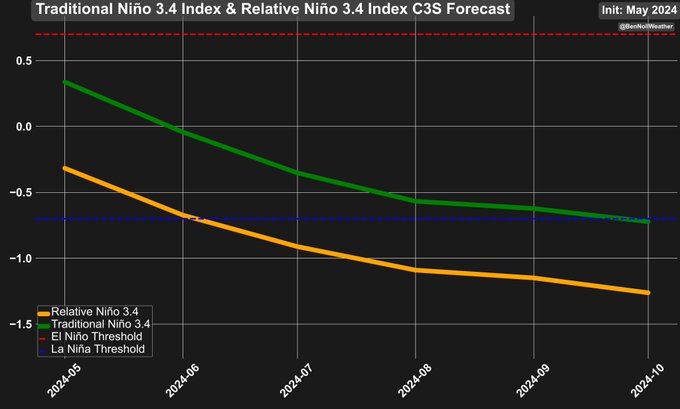
Although I’ve been following RONI data since 2023, the image that in the post above this (from Ben Noll’s tweet) is the first time I’ve ever seen a model prog for RONI! It is the C3S, an average of most of the major models of the world (see image below). It’s showing RONI-ONI to be -0.67 in May (near what it was FMA) and -0.55 in Oct. Based on this graph, it’s showing a prog of ASO ONI to be ~-0.60 (weak La Niña) but ASO RONI to be ~-1.15 (moderate La Niña), a truer reflection of the predicted strength of La Niña since it is negating the surrounding tropical waters’ warming.
RONI has been retrospectively calculated back to 1950 (I discovered this link last year):
Larry, thanks for this very profound contribution.
I need to study this a lot to learn more and it will be a labor of love.
My thoughts on the ocean temperature/atmosphere connection from ENSO events is that they still respond to the temperature differential dynamics in similar fashion, even if you raise up the ranges by 1 degree C everywhere.
Coldest La Nina's and warmest El Nino's are the same.........except 1 deg. C warmer that before climate change/global warming.
The circulation patterns are not caused by the absolute temperatures but instead by the temperatures relative to the temperatures of surrounding areas.
However, at 1 degree warmer overall, I can see where there could be differences, possibly significant that I'm ignorant about because of this assumption.
The graph that you should certainly suggests that!
Mike said:
“The circulation patterns are not caused by the absolute temperatures but instead by the temperatures relative to the temperatures of surrounding areas.”
———————-
Hey Mike,
Exactly! That’s why the RONI was created in recent years. It is a better measure of the relative temps in Nino 3.4 vs using the straight temps, which have warmed regardless of ENSO phase due to GW.
ENSO: Recent Evolution,
Current Status and Predictions
Update prepared by:
Climate Prediction Center / NCEP
20 May 2024
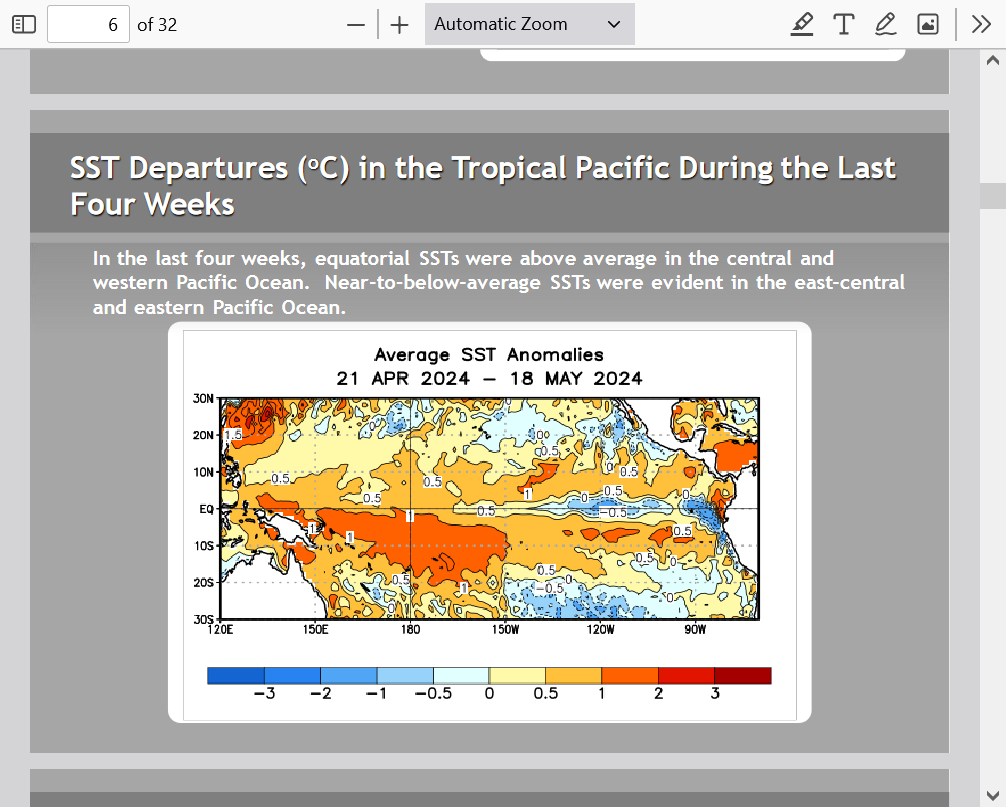
Blues show the cooling along the equatorial Pacific.
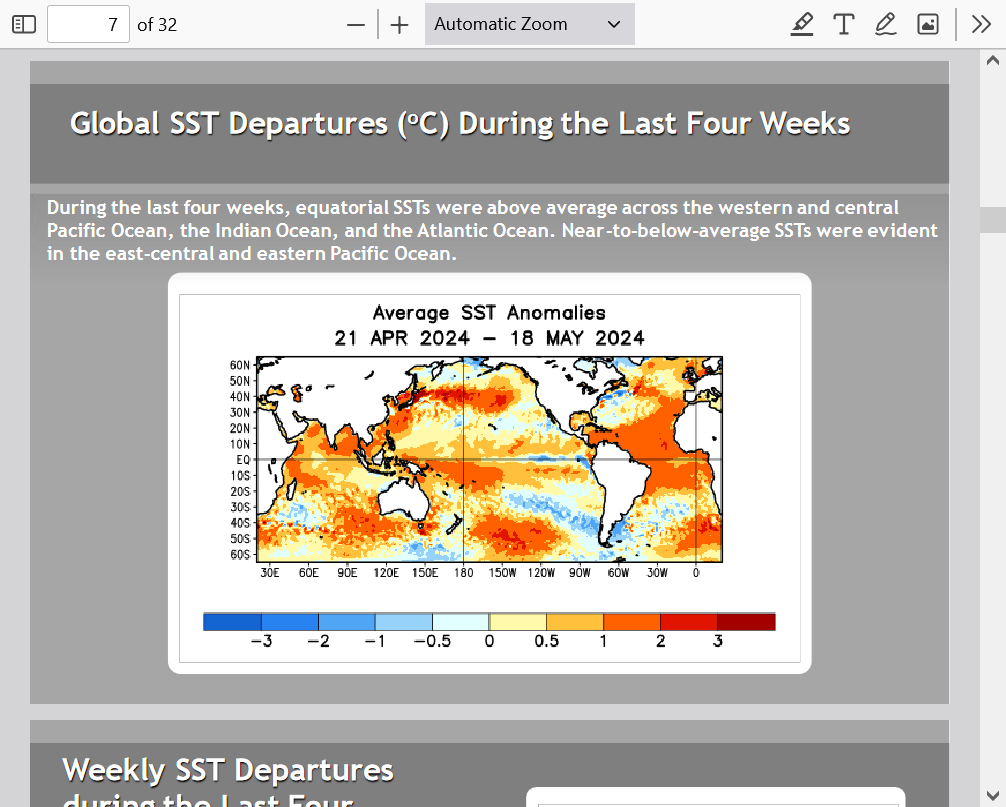
Note the REALLY WARM waters in the Tropical Atlantic below, right now. Take that and the rapidly developing La NIna and we have the recipe for a record breaking Atlantic hurricane season this year.
Blues below show cooling but the Tropical Atlantic actually got even warmer vs average.
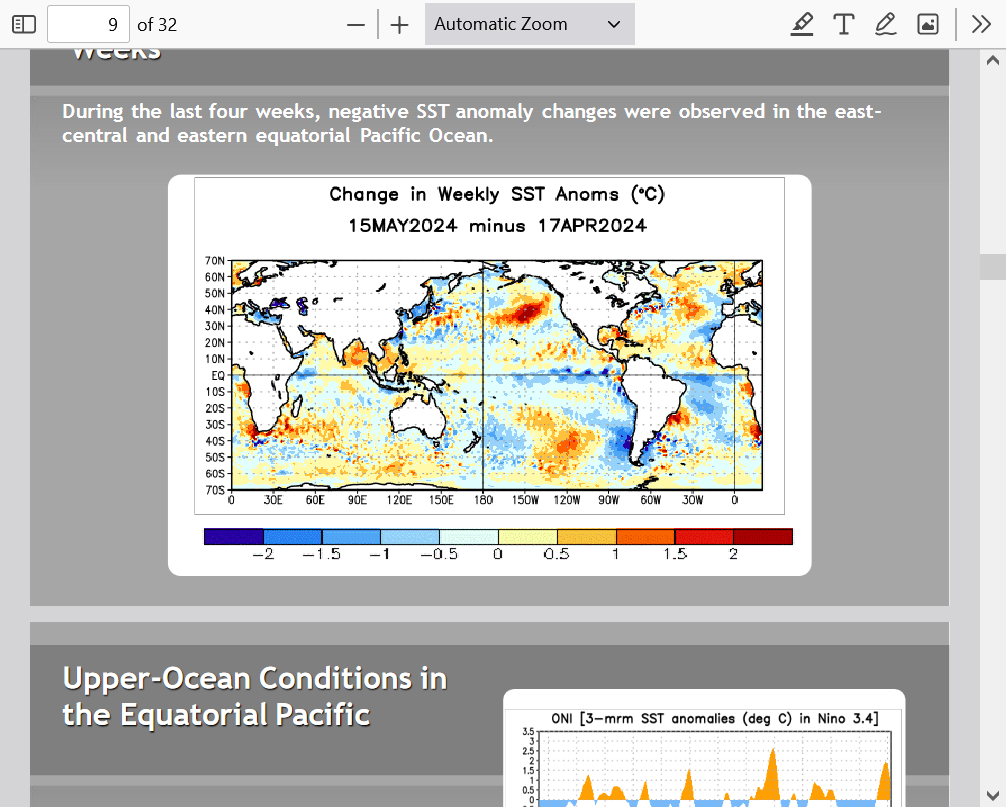
Pretty obvious and extremely rapid change in water temps. 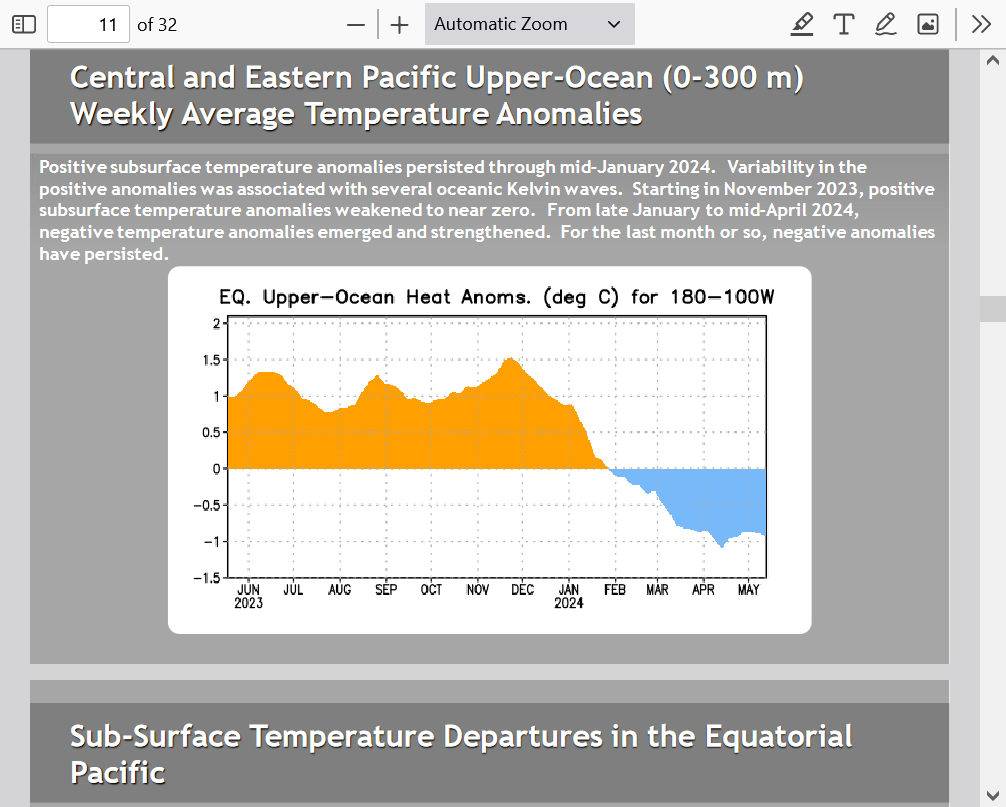
Massive cooling below will work its way to the surface in the east, then track westward at the surface (where it makes contact with the atmosphere and impacts the weather) thanks to the westerly current to the Nino 3.4 region.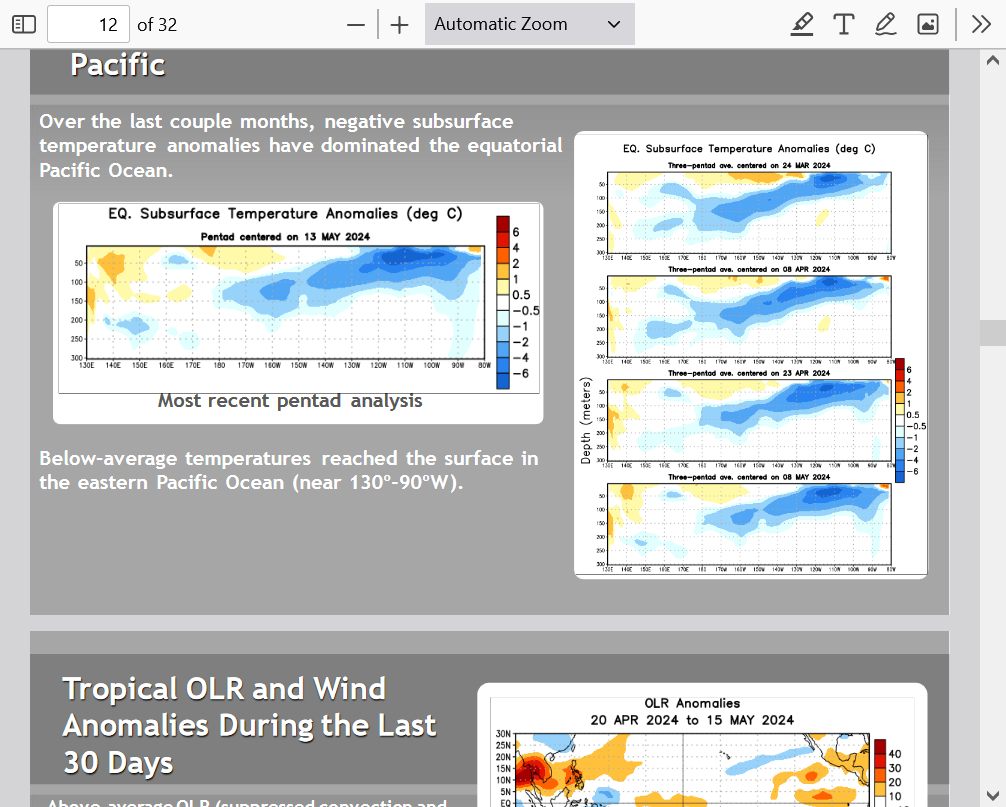
Strengthening La Nino on most models. 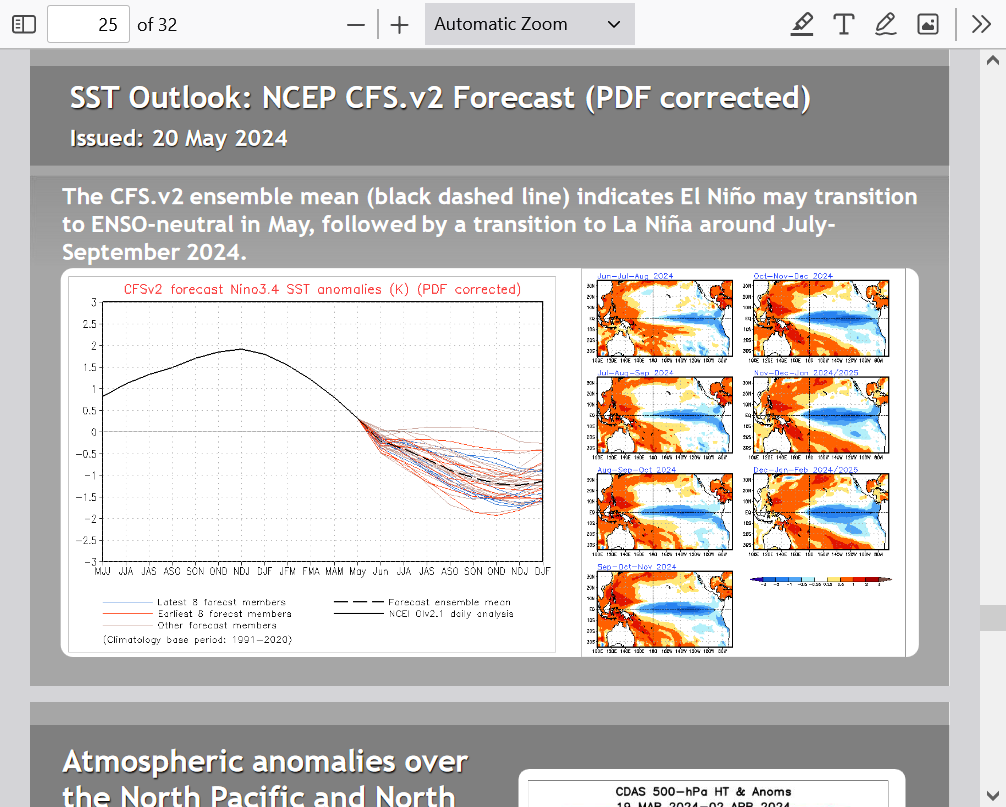
Whereas the Nino 3.4 SST anomaly is currently near +0.1C, it is already near -0.5 once the near record warmth of the global tropical waters (mainly due to GW) is accounted for. In other words, the CONTRAST between Nino 3.4 and the overall very warm global tropics is near the typical level of contrast present when Nino 3.4 is approaching La Niña territory. This is the general idea behind the concept of RONI.
Thanks much, Larry!
The all important RONI ONI difference for MAM is out: -0.64.
RONI +0.11
ONI +0.75
RONI ONI difference:
DJF: -0.58
JFM: -0.63
FMA: -0.66 (record low; records back to 1950)
MAM: -0.64
So, the difference is holding as we go toward La Niña. That’s why I’ve been saying that the equivalent RONI weeklies recently likely had already gotten to ~-0.5. Based on the dailies bouncing back slightly in recent days, I’d guess the equivalent RONI dailies have probably bounced back to the -0.4 to -0.3 vicinity.
RONI: https://www.cpc.ncep.noaa.gov/data/indices/RONI.ascii.txt
ONI: https://www.cpc.ncep.noaa.gov/data/indices/oni.ascii.txt