Previous thread:
Natural Gas 3-7-24
26 responses |
Started by metmike - March 7, 2024, 3:37 p.m.
https://www.marketforum.com/forum/topic/102558/
++++++++++++
By metmike - April 22, 2024, 11:40 a.m.
Nothing big going on in the natural gas market. Late April weather is usually not a huge factor.
however, we have some early season warmth on the way!
Natural gas futures nudged higher early Monday as near-term heating demand and soft springtime production offered support for prices. The May Nymex contract was up 2.1 cents to $1.773/MMBtu at around 8:45 a.m. ET. June was up 2.5 cents to $2.013. Updated estimates Monday showed domestic production remaining steady at sub-100 Bcf/d levels. Bloomberg data…
+++++++++++++++++++
"cool temps"?
Seriously? NO WAY!
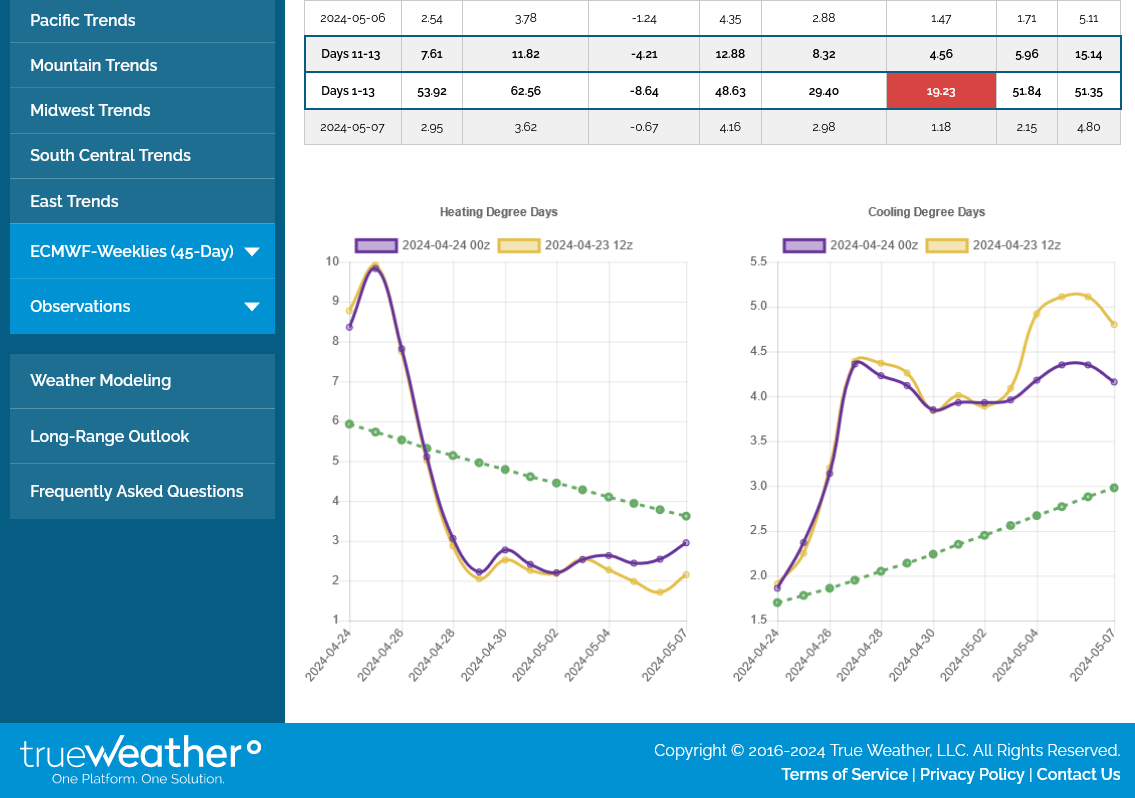
Starting April 28th/this Sunday, CDDs will be GREATER than HDDs(and stay that way, maybe until the Fall)!
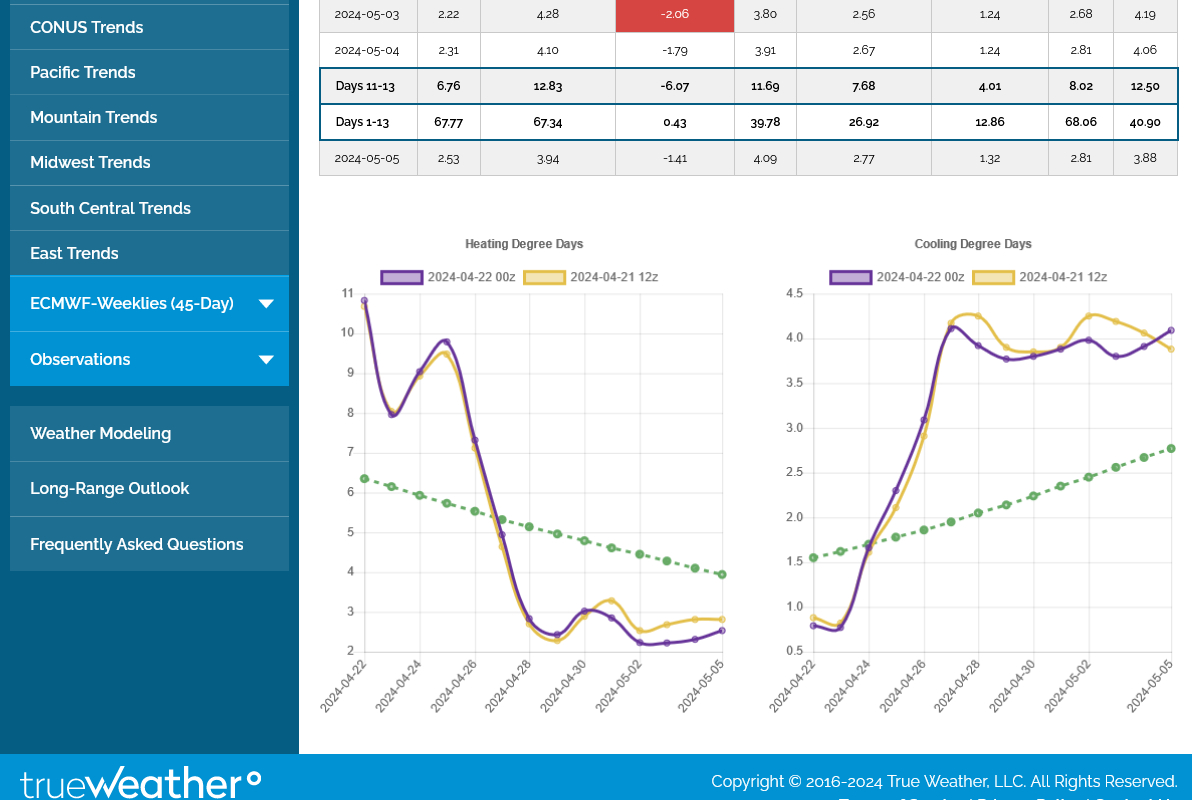
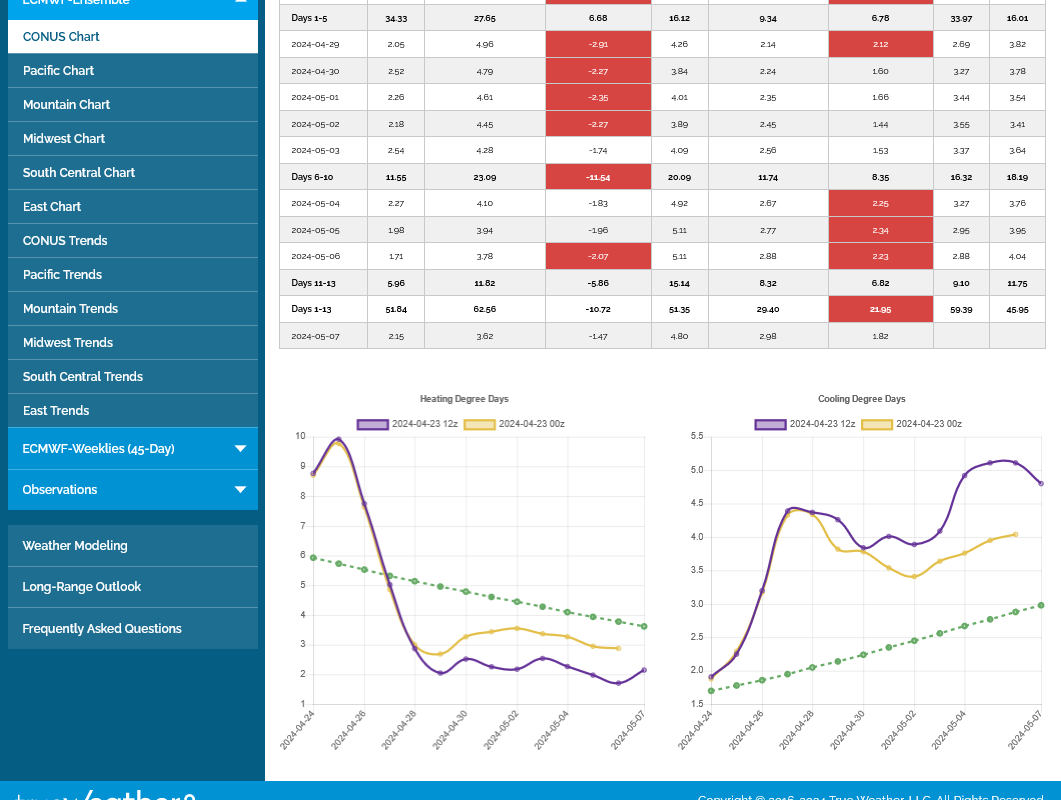
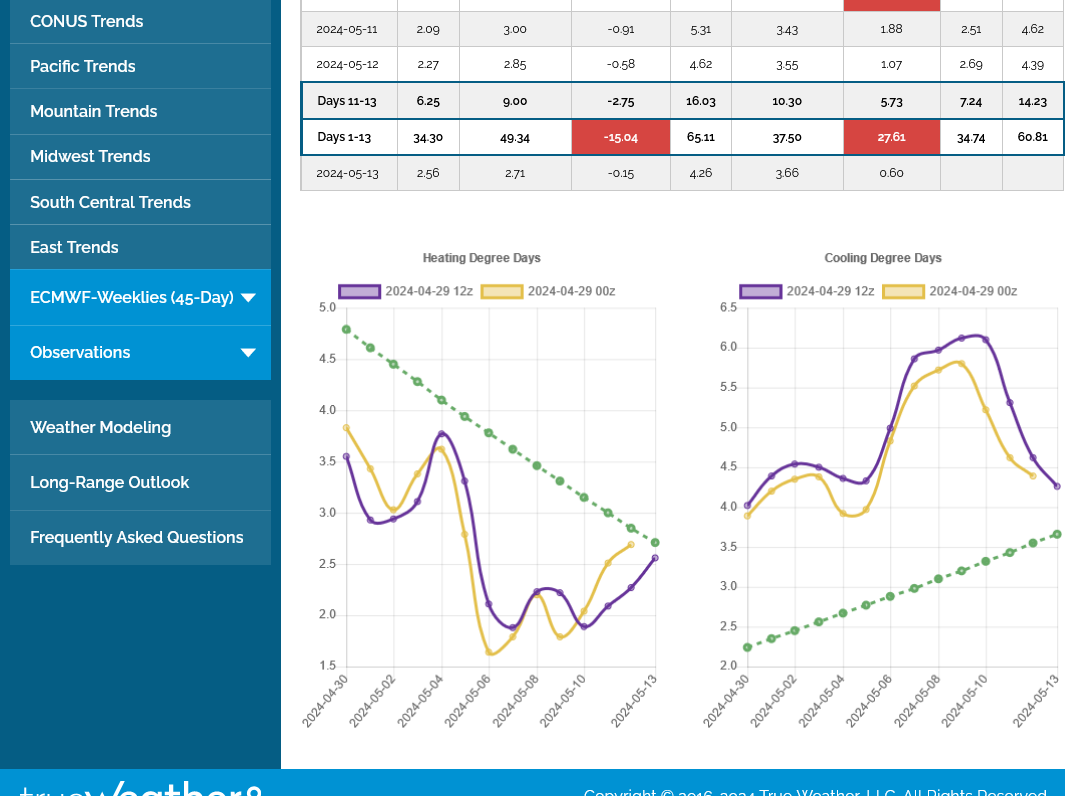
The purple lines below were from the last 0z run of the European model ensemble. On the left are HDDs(mostly for residential heating) on the right are CDDs(mostly for residential cooling) for the next 2 weeks.
Note the HDDS on the left dropping off a cliff this week and the CDDs on the right jumping to mid-May type levels.
VERY mild temps for this weeks EIA report. Should be another robust injection for this time of year.
https://www.cpc.ncep.noaa.gov/products/tanal/temp_analyses.php
+++++++++++++++
Previous EIA report: Note the blue line. Storage is still much higher than its ever been at this time of year. Supplies are gushing in and temperatures were very mild this past Winter
https://www.marketforum.com/forum/topic/102558/#103278
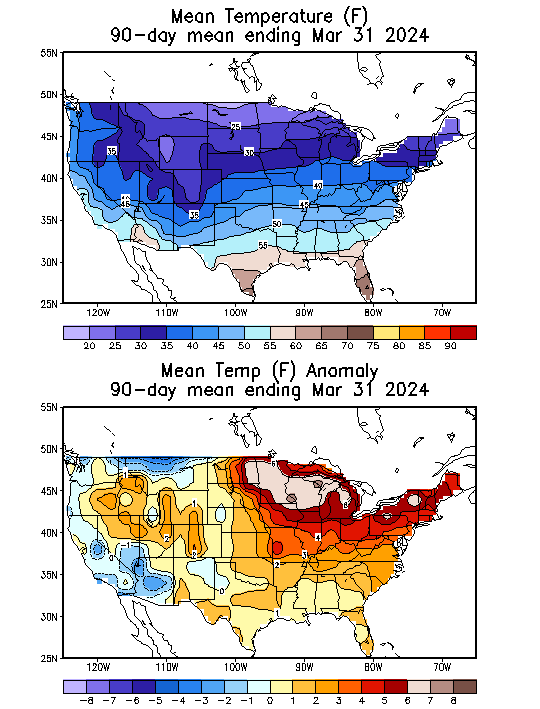
Temperatures this past Winter:
90 day periods-going backward
1. Jan-Feb-Mar
2. Dec-Jan-Feb
3. Nov-Dec-Jan
++++++++++
30 day periods-going forward
4. Nov 2023
5. Dec 2023
6. Jan 2024-only month to feature major cold
7. Feb 2024
8. March 2024
https://www.cpc.ncep.noaa.gov/products/tanal/temp_analyses.php
90 day periods
+++++++++++++++++++++++++++++++++++++++++++++++++++++++
30 day periods
https://wattsupwiththat.com/2024/04/18/the-incredible-dumbness-of-bidens-war-on-lng-part-deux/
Biden’s pause of new LNG export permits is truly a “stupid and futile gesture“…
APRIL 17, 2024
U.S. natural gas trade will continue to grow with the startup of new LNG export projects
Data source: U.S. Energy Information Administration, Short-Term Energy Outlook (STEO)
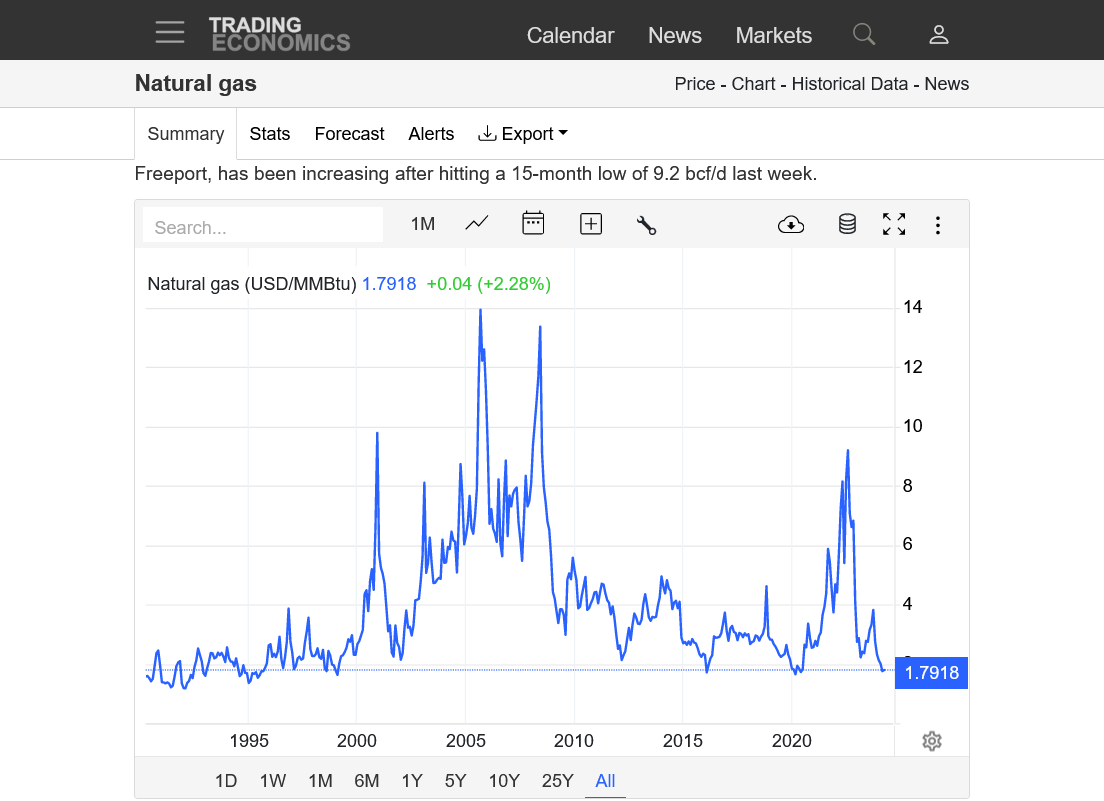
Natural gas price charts:
1. 1 week
2. 1 month
3. 1 year
4. 10 years
5. 35 years
https://tradingeconomics.com/commodity/natural-gas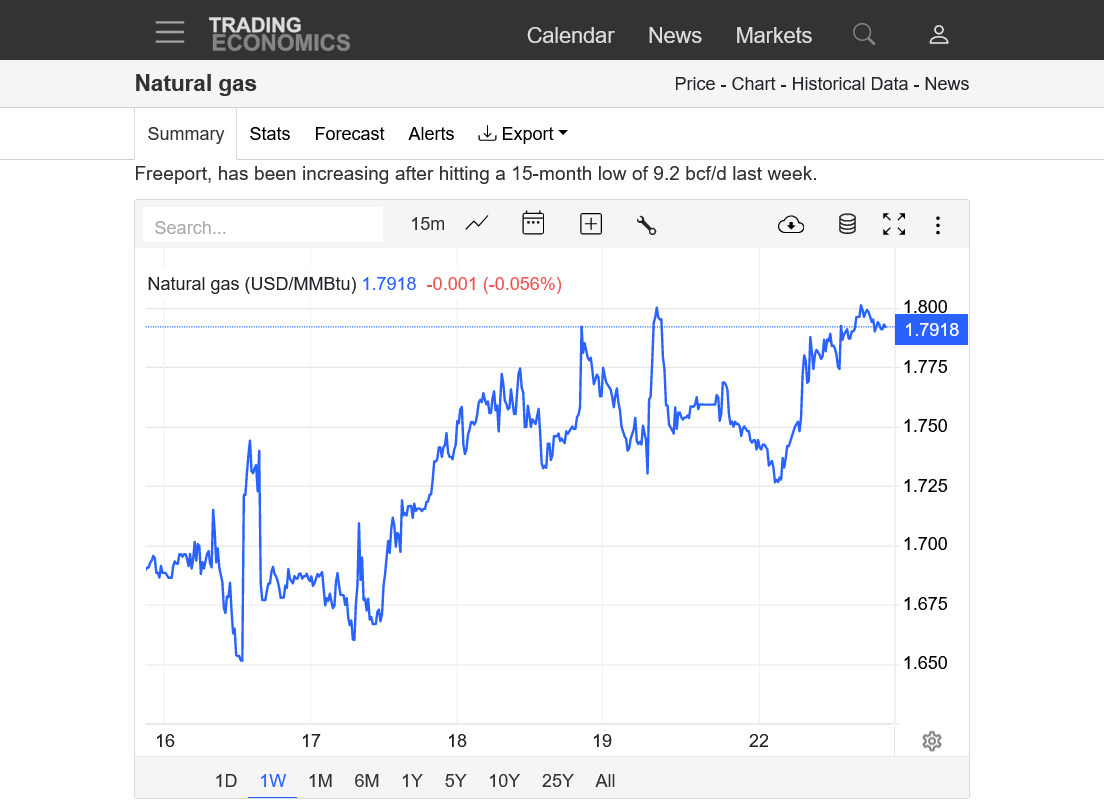
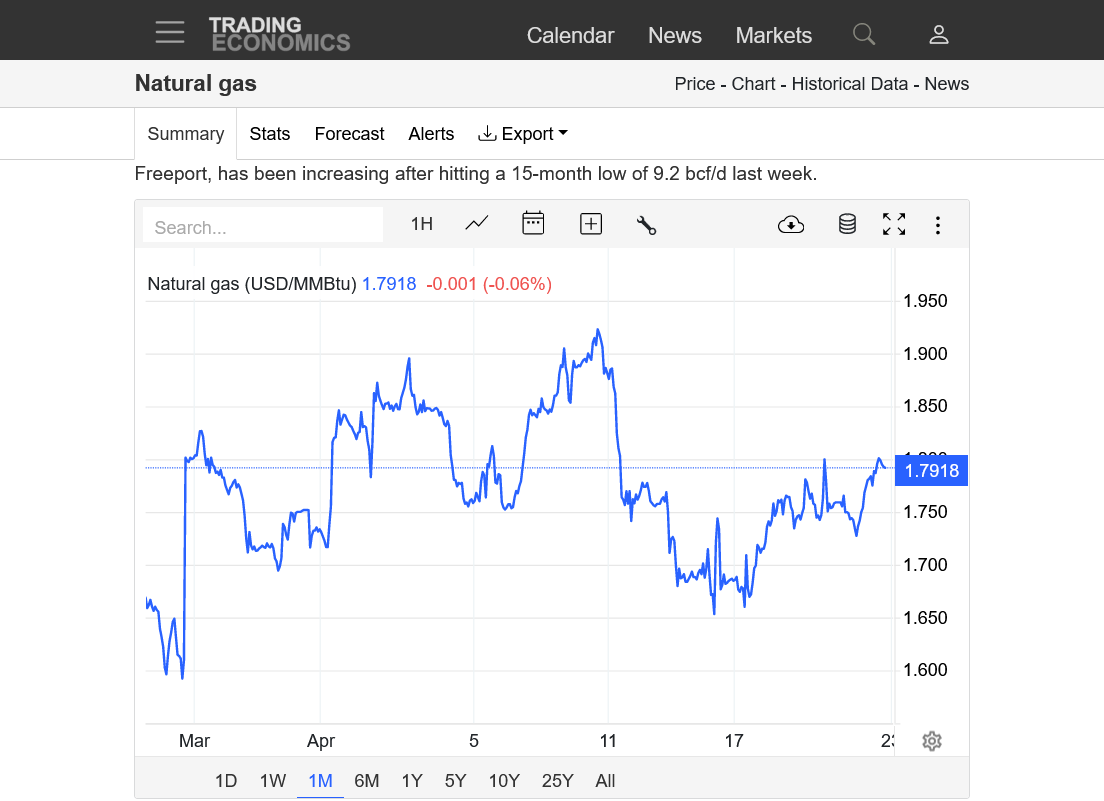


Natural gas futures resumed their climb on Monday, buoyed by a recovery in Gulf Coast LNG feed gas demand above 12 Bcf/d and Lower 48 gas production staying subdued. A jump in Henry Hub cash prices also added support. At A Glance: NGI estimates 86 Bcf injection Freeport restarts LNG exports Production at 98.2 Bcf/d …
++++++++++++++
As stated earlier. A few chilly days in the Spring are not going to be important to futures prices in late April, when the heating season IS OVER and the cooling season CDDs will be HIGHER, starting this Sunday.
This is the forecast for the last several days of April/1st week of May. NG is a futures market that usually focuses on NEW/week 2 weather. Do these maps below look bullish from cool weather?
If anything, they are bullish from early season CDDs!!!!!!!

Early season heat in week 2 is the weather forecast with above average CDDs for early May. Is that causing speculators to buy?
The amount of CDDs in early May are still not going to be massive.
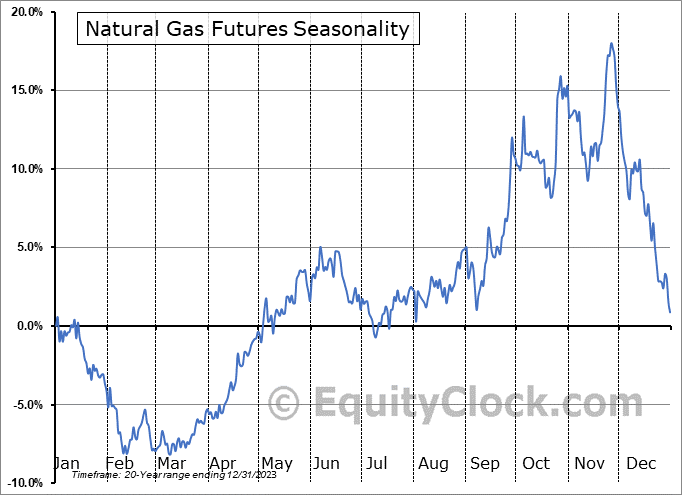
We should note that seasonals/historically prices almost always go up at this time of year:
https://charts.equityclock.com/natural-gas-futures-ng-seasonal-chart
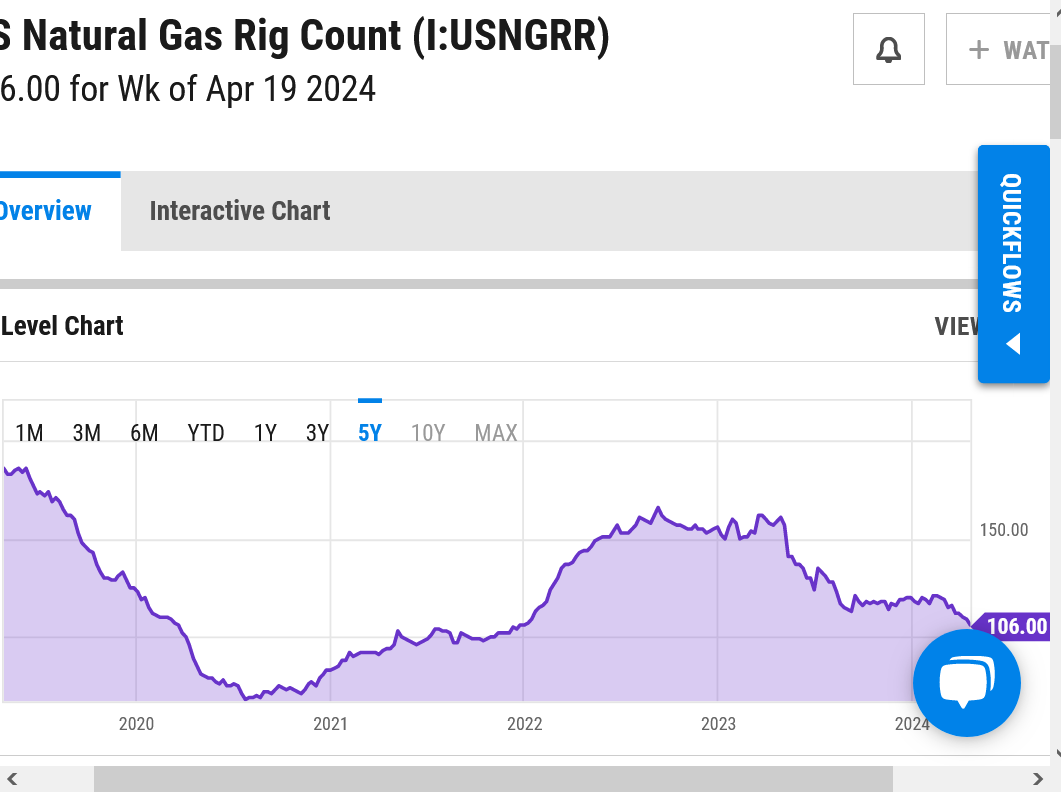
Dropping Rig Count should portend lower supplies down the road:
It may take a hot Summer to gobble up the record surplus. Hot Summers have become fairly rare in the Midwest(thanks in part to the micro climate from corn plant evaptranspiration), although muggy overnight lows add some CDDs. Hot Summers in the West, however have become more common.
The rapid demise of El Nino and development of La Nina add some heat risk and hurricane risk.
Larry and tjc remember the days before horizontal fracking when a hurricane threatening the Gulf would cause NG prices to go nuts. Not that much production in the GOM today.
https://ycharts.com/indicators/us_gas_rotary_rigs
++++++++++++++++++++++
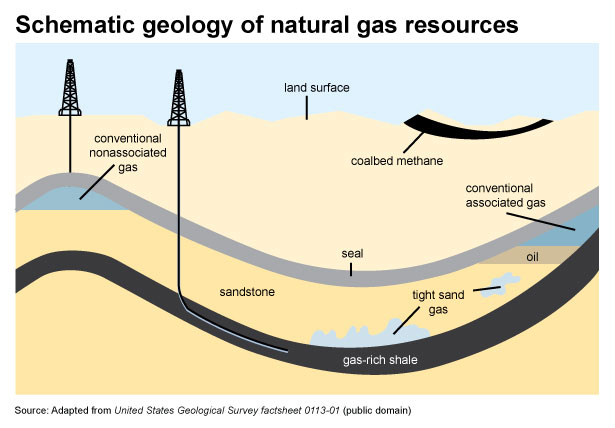
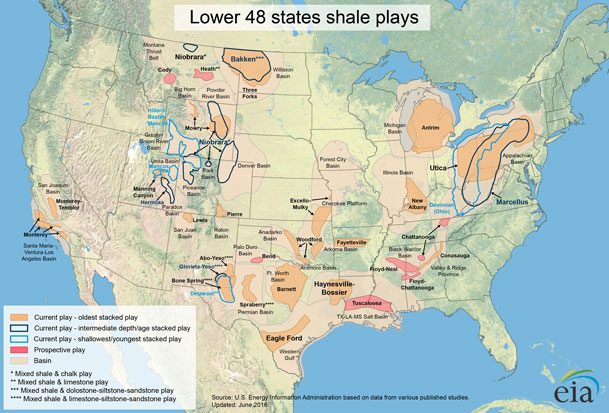
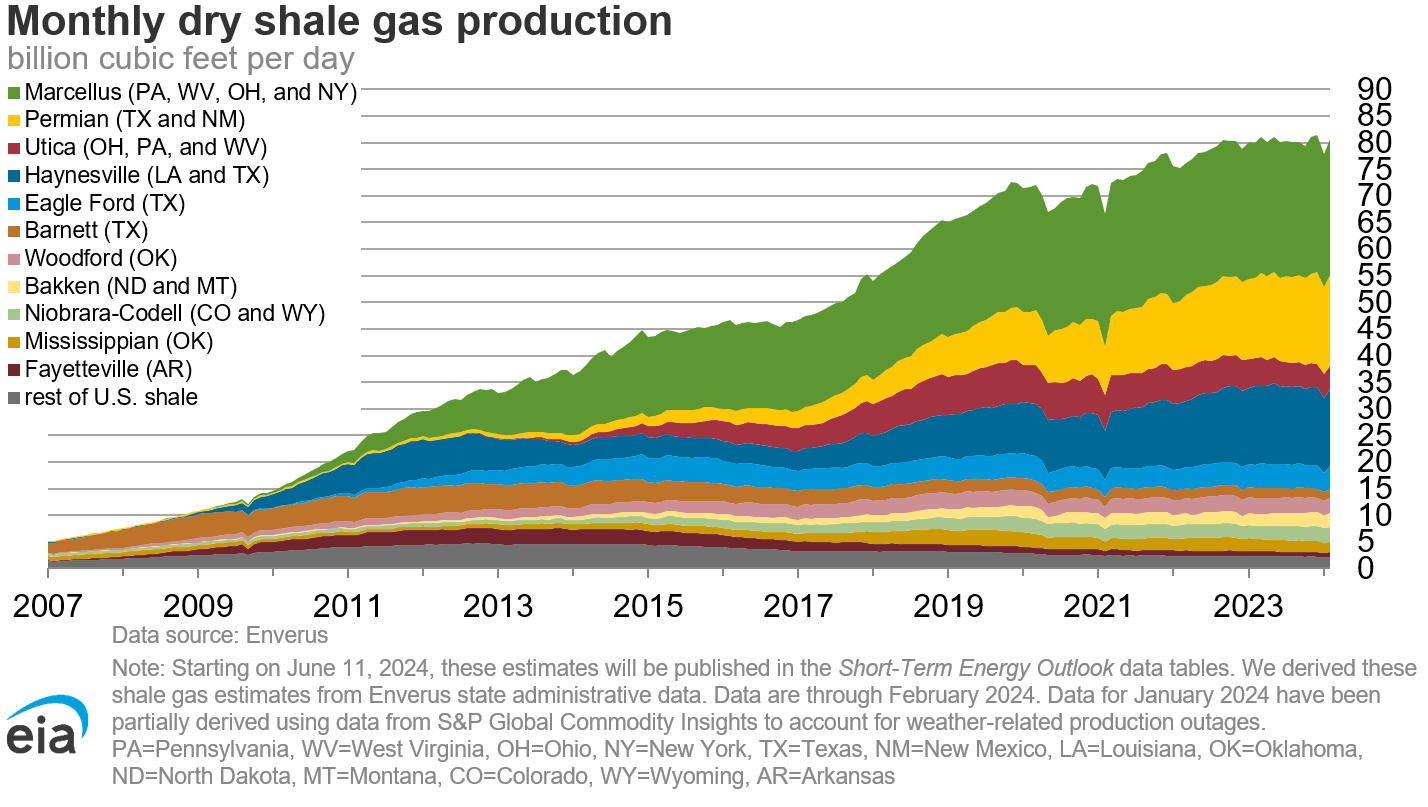
https://www.eia.gov/energyexplained/natural-gas/where-our-natural-gas-comes-from.php
Five of the 34 natural gas-producing states accounted for about 70.4% of total U.S. dry natural gas production in 2022.
.png)
After advancing over the previous two sessions, natural gas futures pulled back in early trading Wednesday as mild shoulder season weather continued to dampen the outlook despite continued production restraint. The May Nymex contract, set to expire later this week, was down 5.3 cents to $1.759/MMBtu at around 8:45 a.m. ET. June was down to
++++++++++++++++
CDDs on the last 0z European Ensemble in purple on the right are LESS than previous runs. This is suggesting the market might be trading the early season heat because we dropped sharply, not long after that came out:
…
![]()
+92 Bcf is a huge but mostly expected injection?
Look at the blue line on the graph below. Still the most natural gas in storage for this time of year EVER!
+++++++++++++++++++++
https://ir.eia.gov/ngs/ngs.html
for week ending April 19, 2024 | Released: April 25, 2024 at 10:30 a.m. | Next Release: May 2, 2024
| Working gas in underground storage, Lower 48 states Summary text CSV JSN | |||||||||||||||||||||||||
|---|---|---|---|---|---|---|---|---|---|---|---|---|---|---|---|---|---|---|---|---|---|---|---|---|---|
| Historical Comparisons | |||||||||||||||||||||||||
| Stocks billion cubic feet (Bcf) | Year ago (04/19/23) | 5-year average (2019-23) | |||||||||||||||||||||||
| Region | 04/19/24 | 04/12/24 | net change | implied flow | Bcf | % change | Bcf | % change | |||||||||||||||||
| East | 408 | 379 | 29 | 29 | 382 | 6.8 | 319 | 27.9 | |||||||||||||||||
| Midwest | 551 | 528 | 23 | 23 | 463 | 19.0 | 391 | 40.9 | |||||||||||||||||
| Mountain | 173 | 167 | 6 | 6 | 88 | 96.6 | 93 | 86.0 | |||||||||||||||||
| Pacific | 235 | 230 | 5 | 5 | 88 | 167.0 | 164 | 43.3 | |||||||||||||||||
| South Central | 1,057 | 1,029 | 28 | 28 | 965 | 9.5 | 803 | 31.6 | |||||||||||||||||
| Salt | 309 | 300 | 9 | 9 | 272 | 13.6 | 249 | 24.1 | |||||||||||||||||
| Nonsalt | 749 | 729 | 20 | 20 | 692 | 8.2 | 553 | 35.4 | |||||||||||||||||
| Total | 2,425 | 2,333 | 92 | 92 | 1,986 | 22.1 | 1,770 | 37.0 | |||||||||||||||||
Totals may not equal sum of components because of independent rounding. | |||||||||||||||||||||||||
Working gas in storage was 2,425 Bcf as of Friday, April 19, 2024, according to EIA estimates. This represents a net increase of 92 Bcf from the previous week. Stocks were 439 Bcf higher than last year at this time and 655 Bcf above the five-year average of 1,770 Bcf. At 2,425 Bcf, total working gas is above the five-year historical range.
For information on sampling error in this report, see Estimated Measures of Sampling Variability table below.

May natural gas just expired modestly lower! June is the new front month.
1. Here's the 34 day outlook from the last GEFS that I have(yesterday). On the right, the CDDs are actually pretty impressive at the end of the period for so early in the cooling season.
2. The European model 45 day outlook has the same VERY warm look to it late in the (low skill) period.
With a record surplus in storage right now, it will be tough to get NG traders overly worried about a hot Summer but intense heat waves will have some bullish upside potential this Summer.


I'll just make a speculative guess here.
If this forecast continues to feature early season heat, at some point soon, it will inspire some speculative buying that lifts the market.
However, the heat must be sustained and expected to potentially define the early Summer pattern. If you want to believe the solutions above, that's where we are headed.
Last 384 hour CDDs forecast on the right from the 12z GEFS.
A bit bullish for the end of April/start of May early this week(from heat the market has known about) followed by LESS bullish weather.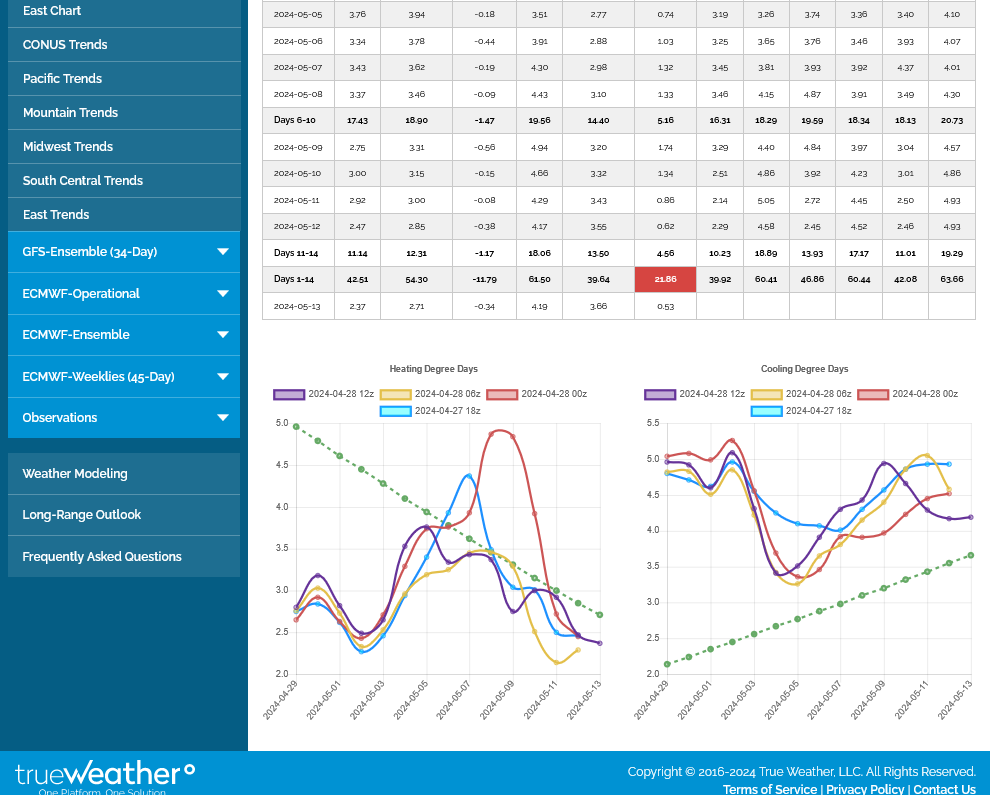
7 day temps for this Thursdays 9:30 am EIA injection. A bit chilly in the Eastern 1/2 so not as robust as last week.
https://www.cpc.ncep.noaa.gov/products/tanal/temp_analyses.php
Front month, May expired on Friday.
Cooling Degree Days are what matter now. The overnight European Ensemble saw +3 CDDs but we are still VERY early in the AC/cooling season.
1. CDDs the next 2 weeks on the right graph. Modestly bullish vs average.
2. CDDS the next month from the GEFS model. Late May turns hot/bullish.


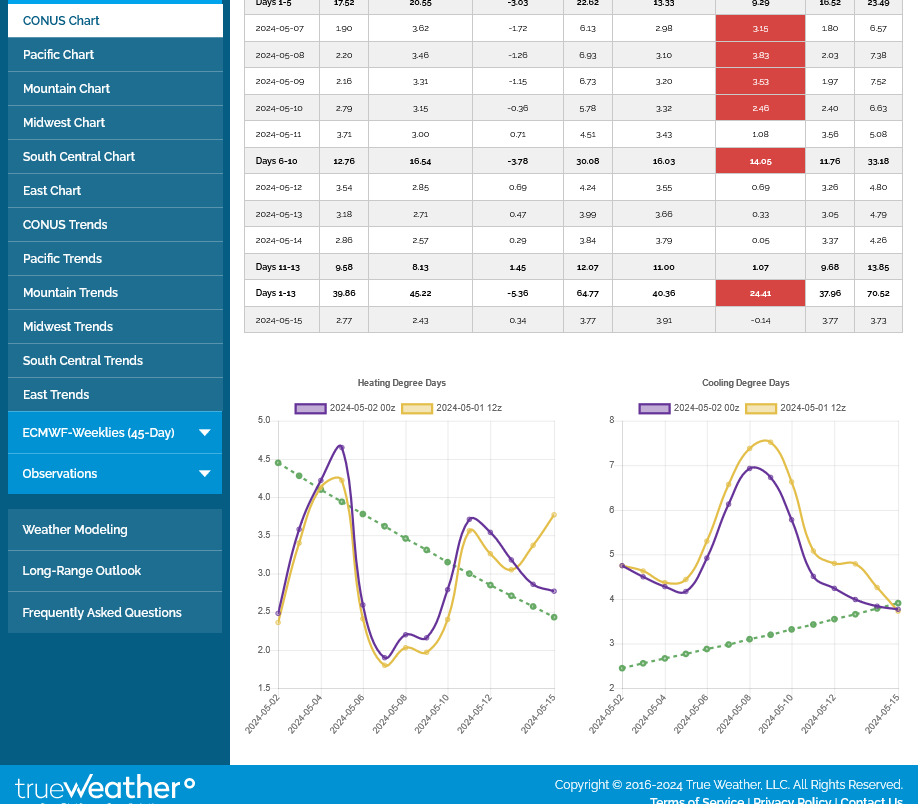
The last 12z European model was +4 CDDs and even more bullish which caused additional buying early/mid afternoon.
It's the purple line on the graph on the right.
CDDs on the right (last 0z European model in purple) were -2 CDDs overnight.
Big cooling late in the 2 week period.

-5 CDDs, which would be bearish weather so thats not why we're higher.
However, this EIA report could be mildly bullish from very chilly temps last week in high population areas.
As speculated on early this morning, the EIA came in BULLISH, about as expected.
+59 Bcf. Note the blue line on the graph showing a record amount of gas in storage for this time of year but the surplus was just eroded with this bullishly small injection vs average for late April.
![]()
for week ending April 26, 2024 | Released: May 2, 2024 at 10:30 a.m. | Next Release: May 9, 2024
| Working gas in underground storage, Lower 48 states Summary text CSV JSN | |||||||||||||||||||||||||
|---|---|---|---|---|---|---|---|---|---|---|---|---|---|---|---|---|---|---|---|---|---|---|---|---|---|
| Historical Comparisons | |||||||||||||||||||||||||
| Stocks billion cubic feet (Bcf) | Year ago (04/26/23) | 5-year average (2019-23) | |||||||||||||||||||||||
| Region | 04/26/24 | 04/19/24 | net change | implied flow | Bcf | % change | Bcf | % change | |||||||||||||||||
| East | 425 | 408 | 17 | 17 | 404 | 5.2 | 333 | 27.6 | |||||||||||||||||
| Midwest | 564 | 551 | 13 | 13 | 477 | 18.2 | 406 | 38.9 | |||||||||||||||||
| Mountain | 182 | 173 | 9 | 9 | 94 | 93.6 | 97 | 87.6 | |||||||||||||||||
| Pacific | 240 | 235 | 5 | 5 | 97 | 147.4 | 173 | 38.7 | |||||||||||||||||
| South Central | 1,073 | 1,057 | 16 | 16 | 975 | 10.1 | 832 | 29.0 | |||||||||||||||||
| Salt | 314 | 309 | 5 | 5 | 277 | 13.4 | 261 | 20.3 | |||||||||||||||||
| Nonsalt | 759 | 749 | 10 | 10 | 698 | 8.7 | 571 | 32.9 | |||||||||||||||||
| Total | 2,484 | 2,425 | 59 | 59 | 2,048 | 21.3 | 1,842 | 34.9 | |||||||||||||||||
Totals may not equal sum of components because of independent rounding. | |||||||||||||||||||||||||
Working gas in storage was 2,484 Bcf as of Friday, April 26, 2024, according to EIA estimates. This represents a net increase of 59 Bcf from the previous week. Stocks were 436 Bcf higher than last year at this time and 642 Bcf above the five-year average of 1,842 Bcf. At 2,484 Bcf, total working gas is above the five-year historical range.
For information on sampling error in this report, see Estimated Measures of Sampling Variability table below.
