I'll be on the Drew Mariani Show for 15 minutes TOMORROW afternoon to talk about the El Nino.
Starting around 2:15 pm CST.
https://relevantradio.com/listen/our-shows/the-drew-mariani-show/
El Niño and La Niña: Frequently asked questions
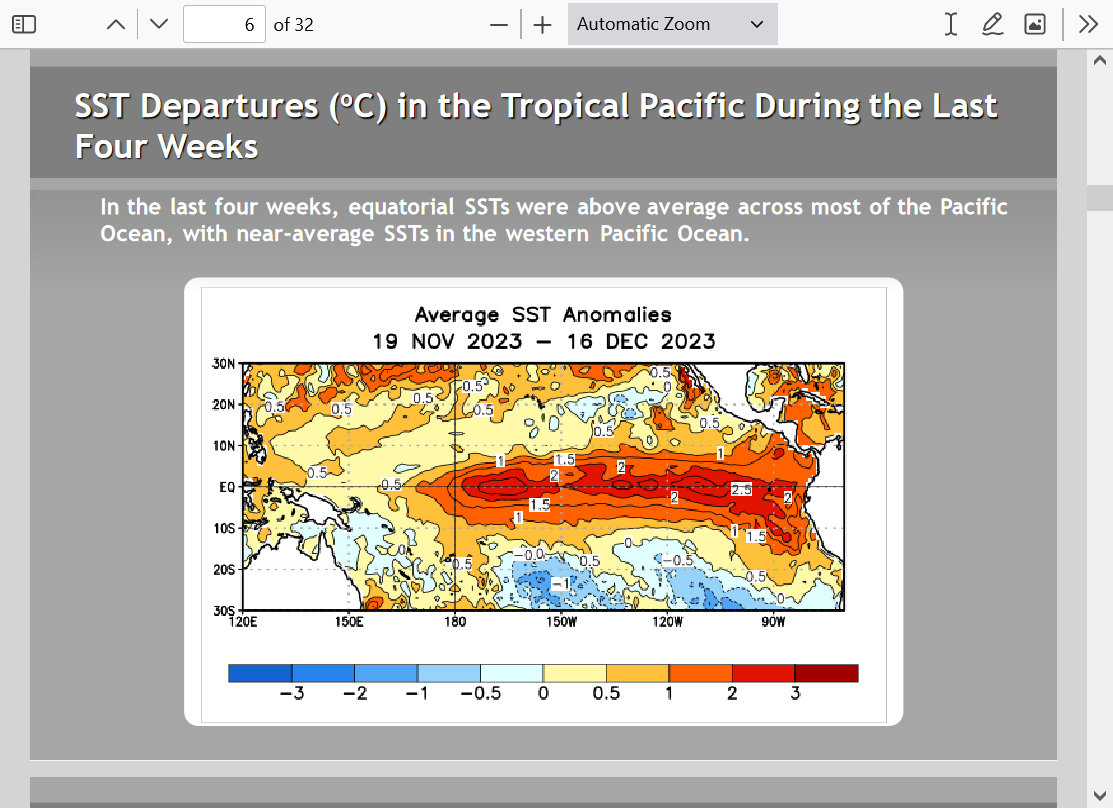
During El Niño, the surface winds across the entire tropical Pacific are weaker than usual. Ocean temperatures in the central and eastern tropical Pacific Ocean are warmer than average, and rainfall is below average over Indonesia and above average over the central or eastern Pacific.
Rising air motion (which is linked to storms and rainfall) increases over the central or eastern Pacific, and surface pressure there tends to be lower than average. Meanwhile, an increase in sinking air motion over Indonesia leads to higher surface pressure and dryness.
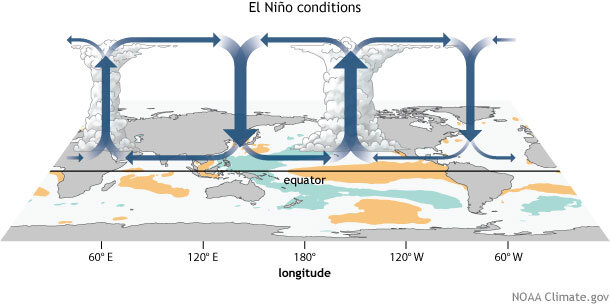
Generalized Walker Circulation (December-February) anomaly during El Niño events, overlaid on map of average sea surface temperature anomalies. Anomalous ocean warming in the central and eastern Pacific (orange) help to shift a rising branch of the Walker Circulation to east of 180°, while sinking branches shift to over the Maritime continent and northern South America. NOAA Climate.gov drawing by Fiona Martin
Within any given decade, the warmest years are usually El Niño ones, and the coldest are usually La Niña ones. That’s because the Pacific Ocean is a big place. If you walked around the planet along the equator, you’d be spending over 40% of your time attempting to walk on the water in the Pacific Ocean. This vast size means that warming or cooling in the Pacific due to El Niño and La Niña can leave an imprint on the global average surface temperature.
In general, the warmest year of any decade will be an El Niño year, the coldest a La Niña one.
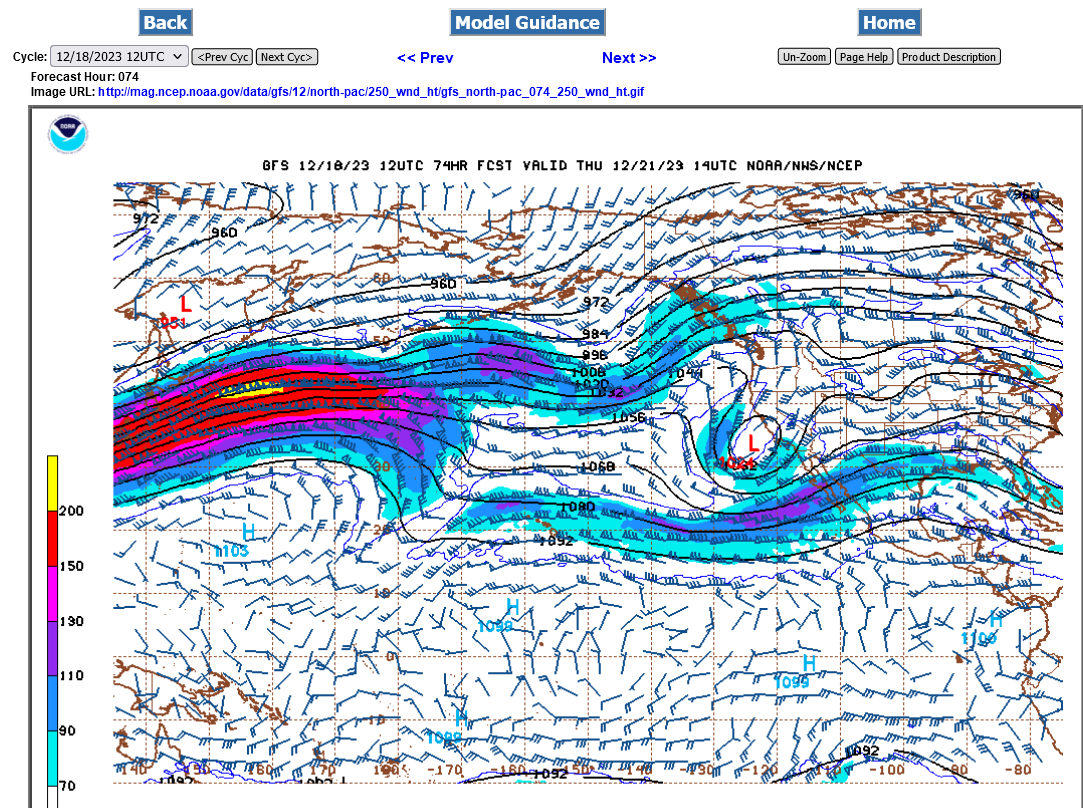
Take note of the jet stream this week. This is Thursday morning below.
You can see the modest jet and upper level low off the coast of California at mid-week causing the beneficial rain and snow.
Just south of that is the El Nino based southern branch of the jet stream.
However, the eye catching powerful jet stream racing across the Western Pacific is the main feature. Winds in the center are blowing at 240 mph! WOW!
This is at around 18,000 feet or around 3.5 miles above the surface.
This is completely UNassociated with the current strong El Nino. We will try to project what this most powerful, dominant feature does NEXT week and beyond to our weather pattern and how it impacts/interacts with the El Nino farther south.
I’m thinking this very impressive feature/jet may cause an SSW, Sudden Stratospheric Warming event in early January.
This week, the El Nino enhanced moderate atmospheric river/jet stream will be aimed at the southern part of the West Coast and gradually shift south each day…..by Thursday it’s aimed at the Baja Peninsula.
All this precip will be beneficial, with very little of it excessive!
http://www.wxmaps.org/pix/ez.west
Day 1 below:
http://www.wpc.ncep.noaa.gov/qpf/fill_94qwbg.gif?1526306199054

Day 2 below:
http://www.wpc.ncep.noaa.gov/qpf/fill_98qwbg.gif?1528293750112

Day 3 below:
http://www.wpc.ncep.noaa.gov/qpf/fill_99qwbg.gif?1528293842764

Days 4-5 below:
http://www.wpc.ncep.noaa.gov/qpf/95ep48iwbg_fill.gif?1526306162

D
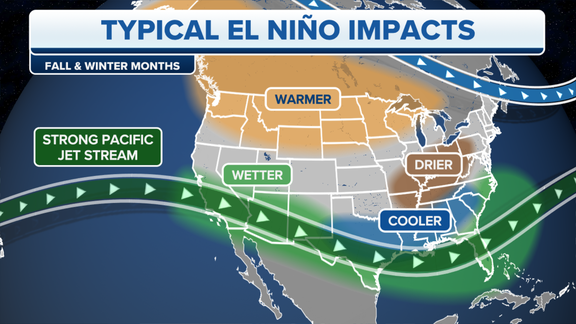
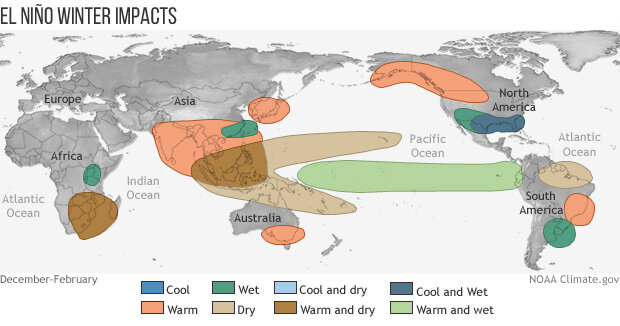
This is what an El Nino Winter typically brings ON AVERAGE.
Individual El Ninos in some years can be different because there are other large scale features in the global atmosphere that can force the El Nino energy and downstream impacts to be diverted south or north of it's average position.
https://www.foxweather.com/learn/super-el-nino
https://www.climate.gov/news-features/blogs/enso/december-2023-el-nino-update-adventure
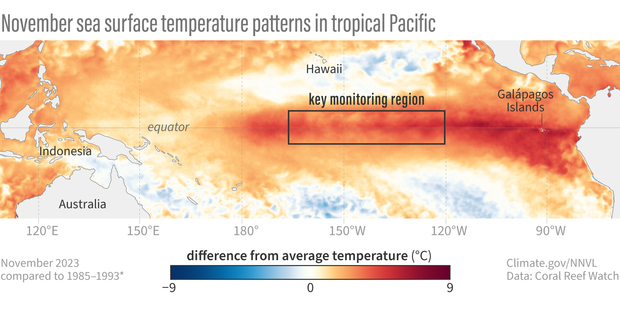
This El Nino, as expected all year has reached a strong El Nino and has peaked or will be peaking in the next month or so at the threshold of a Super El Nino/VERY strong El Nino. With the temperature in the key measuring location of the tropical Pacific just barely hitting +2.0 Deg C.
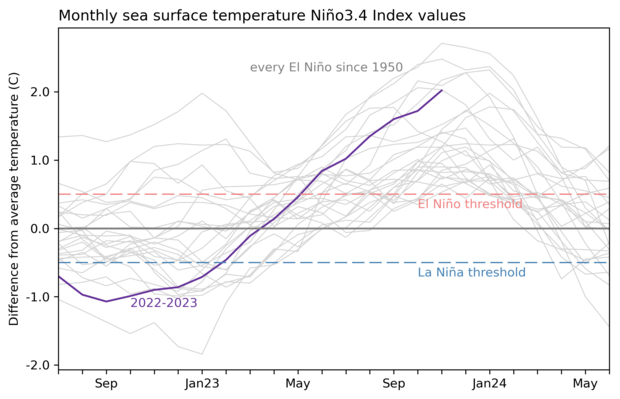
Though this is a strong El Nino, it is NOT as powerful as the ones in 2015/16, 1997/98 and 1982/83 as you can see on the graph above and the data below. Those were SUPER El Niño’s. This is not a SUPER El Niño.
++++++++++++++++++++++++++++++++++
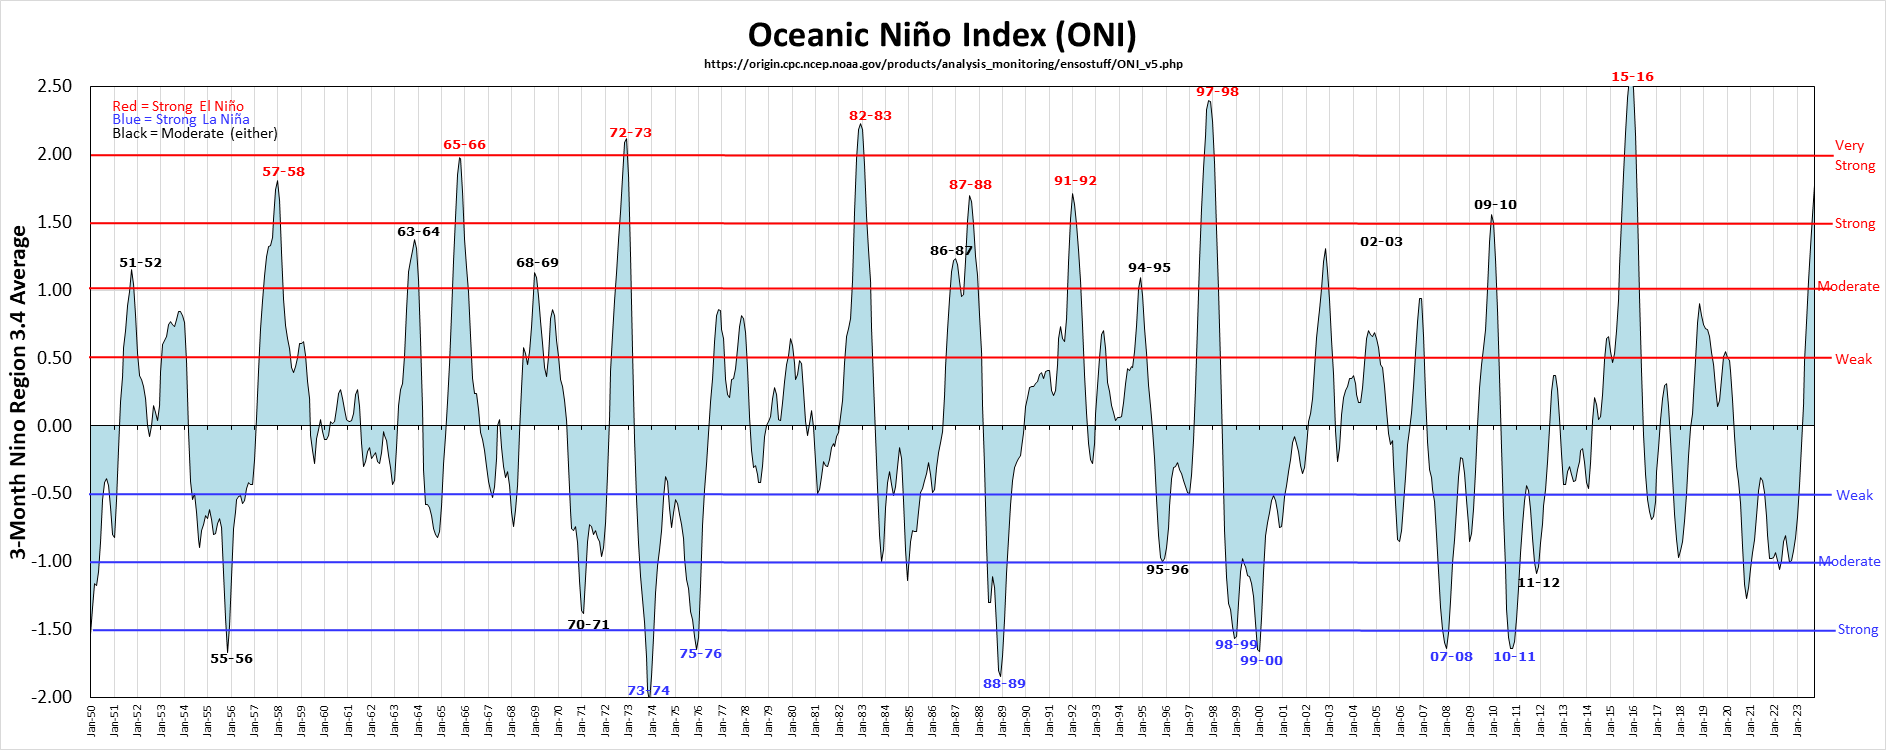
https://ggweather.com/enso/oni.htm
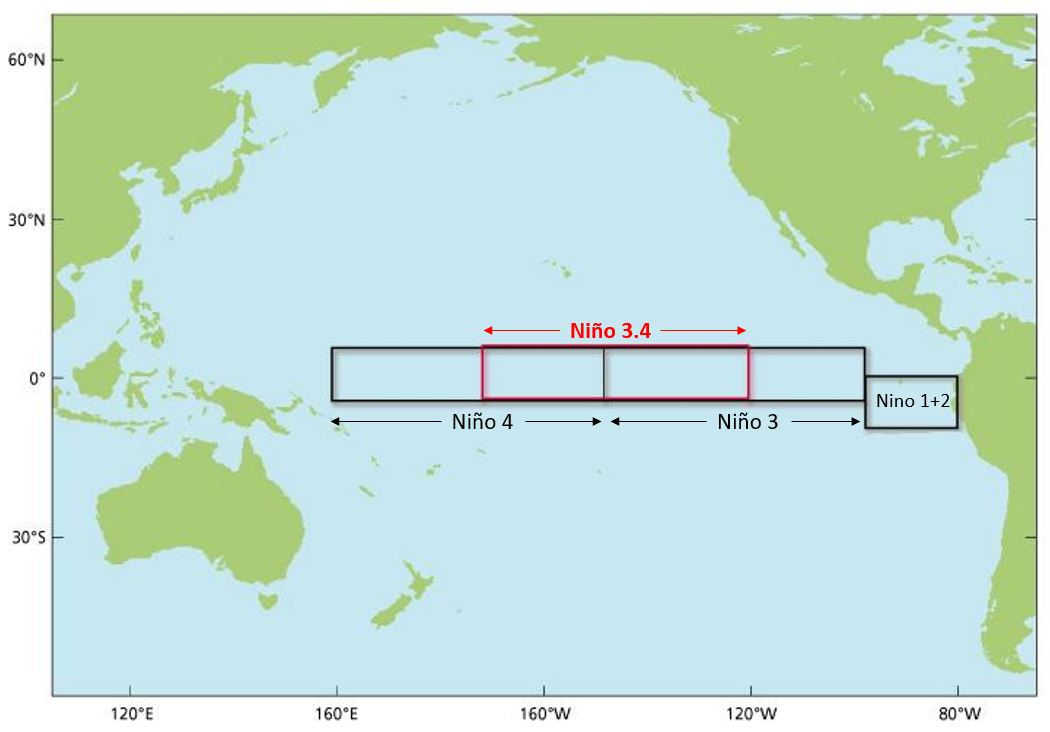
| The Oceanic Niño Index (ONI) has become the de-facto standard that NOAA uses for classifying El Niño (warm) and La Niña (cool) events in the eastern tropical Pacific. It is the running 3-month mean SST anomaly for the Niño 3.4 region (i.e., 5oN-5oS, 120o-170oW). Events are defined as 5 consecutive overlapping 3-month periods at or above the +0.5o anomaly for warm (El Niño) events and at or below the -0.5 anomaly for cool (La Niña) events. The threshold is further broken down into Weak (with a 0.5 to 0.9 SST anomaly), Moderate (1.0 to 1.4), Strong (1.5 to 1.9) and Very Strong (≥ 2.0) events. For the purpose of this report for an event to be categorized as weak, moderate, strong or very strong it must have equaled or exceeded the threshold of the highest category for at least 3 consecutive overlapping 3-month periods. | ||||||||||||||||||||||||||||||||||||||||||||||||||||||||||||||||||||||||||||||||||||||||||||||||||||||||||
| ||||||||||||||||||||||||||||||||||||||||||||||||||||||||||||||||||||||||||||||||||||||||||||||||||||||||||
NOAA updates their ENSO(El Nino) update every Monday morning, so we have the latest one below:
Summary
Recent Evolution and Current Conditions
Oceanic Niño Index (ONI)
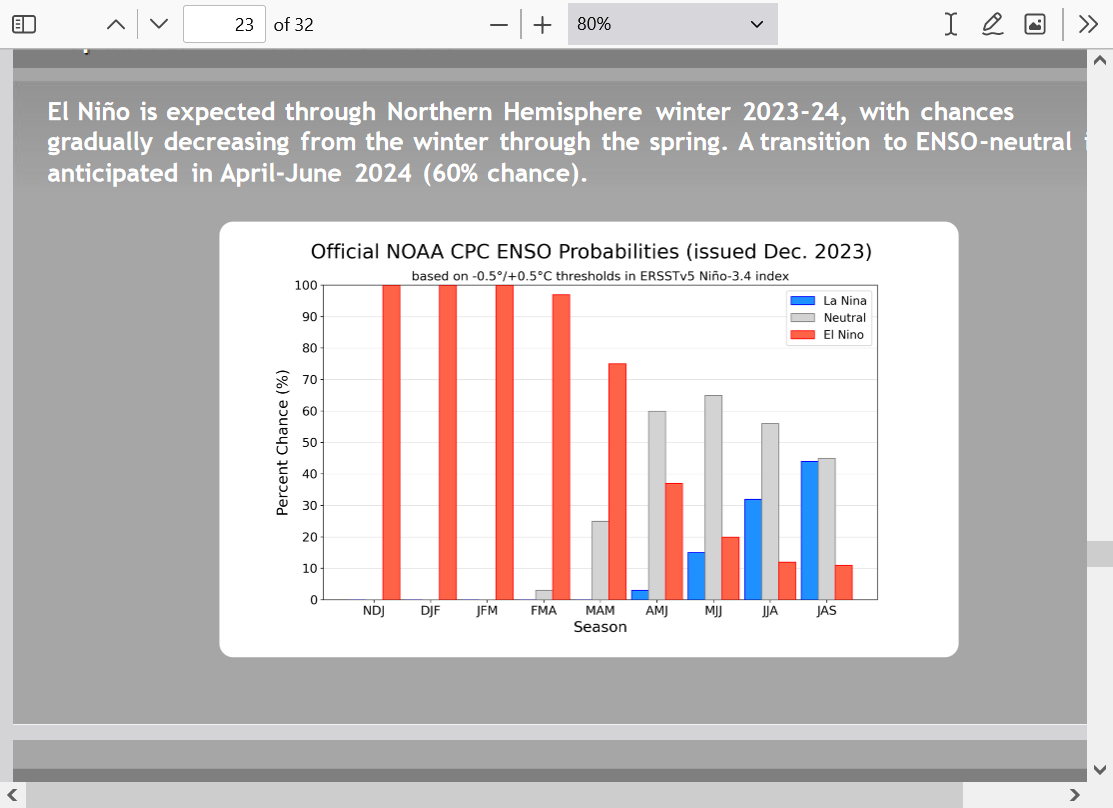
Pacific SST Outlook
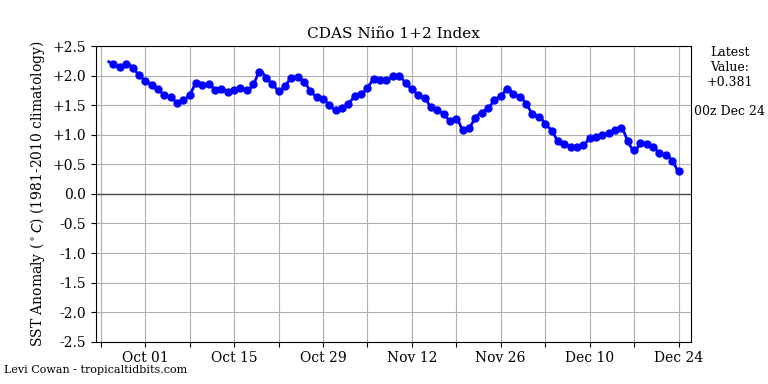
Note that Nino 1+2 HAS PEAKED. This was the region that got the El Nino ball rolling, early this year, with the warm water anomalies building westward to the key regions. It's been cooling since late Summer, with the next region, Nino 3 no longer warming since late Summer......foreboding the peak of El Nino. There's a chance that its peaked already or is peaking right now and with very high confidence it will have peaked by very early next year.
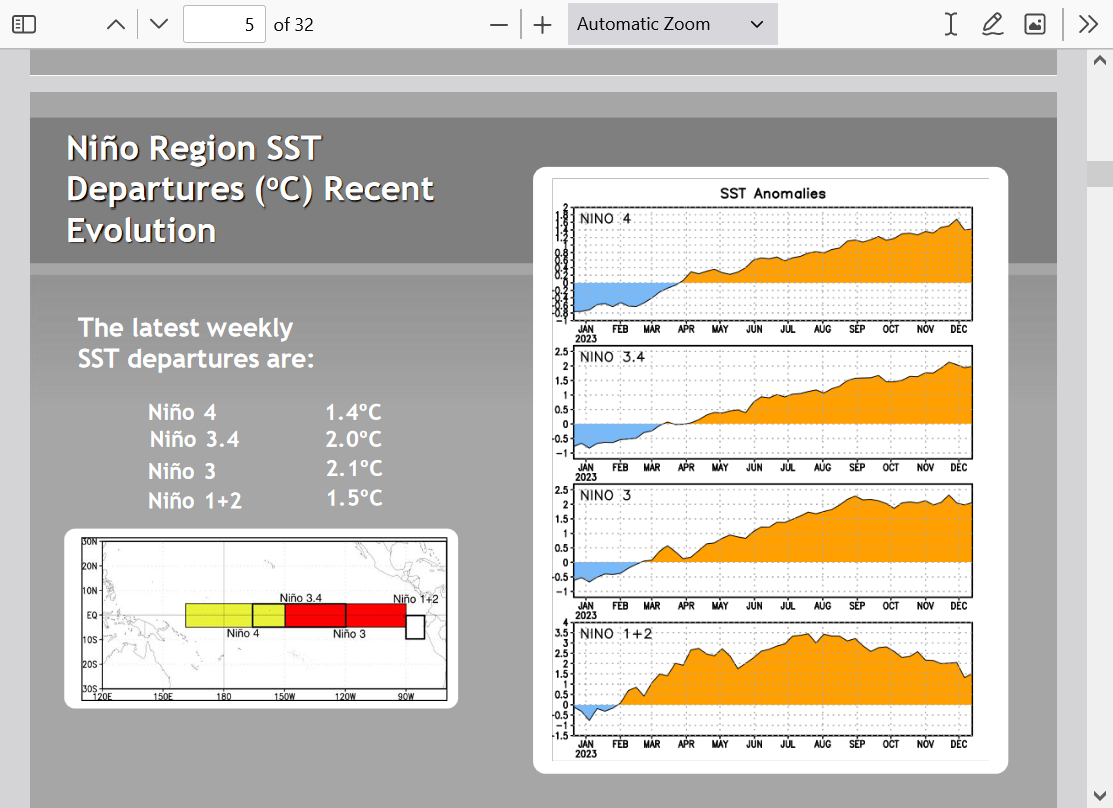
Below, you can see the the entire Nino region anomalies in all its glory. The far Eastern region was the warmest by far, above +3.0 Deg. C this Summer..... but has been cooling the last few months as that SURFACE very warm water pool is DECREASING.
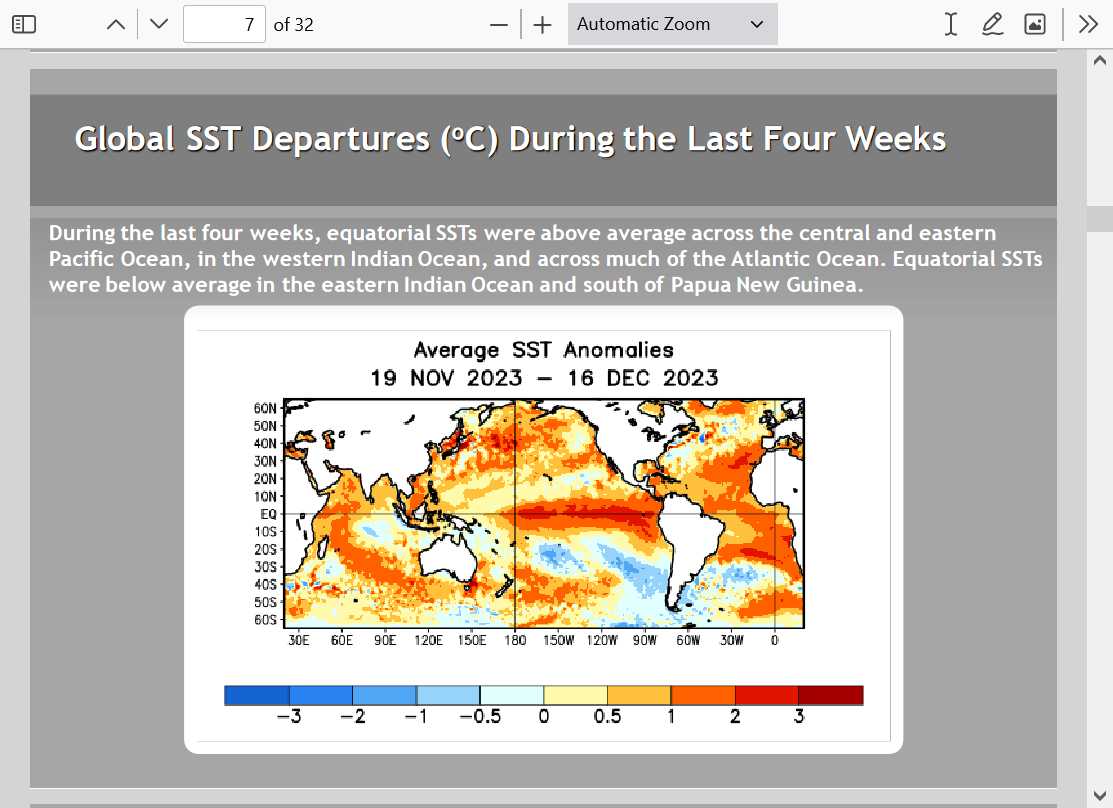
Below we can see a continuation of the warm water anomalies in much of the worlds oceans which is expected with the slight, mostly beneficial greenhouse gas warming from the beneficial CO2 which is massively greening up the planet and increasing global food production 24% by itself.
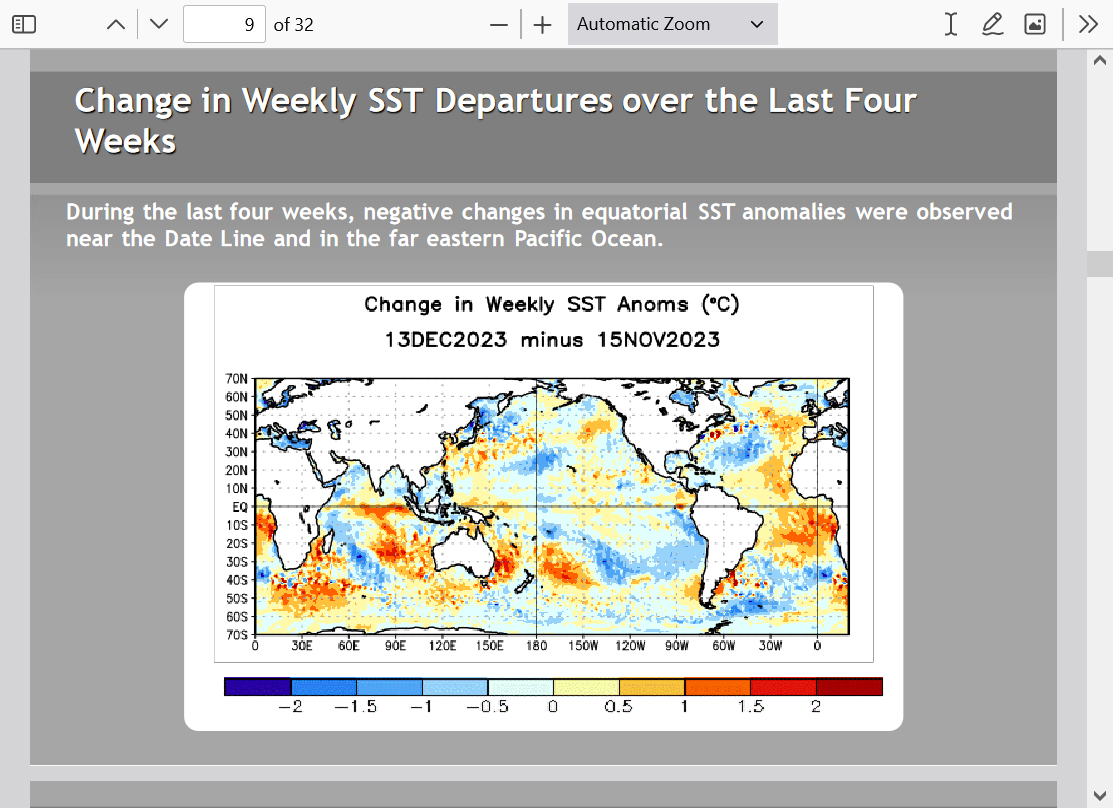
Below, a lot of cooling going on in several locations of the Pacific basin, also the western Atlantic and far southern Atlantic.
The last graph below shows plenty of subsurface water left in the central/eastern Pacific, so this could sustain the near peak El Nino conditions a bit longer than expected(just beyond a month), even if the actual peak is over.
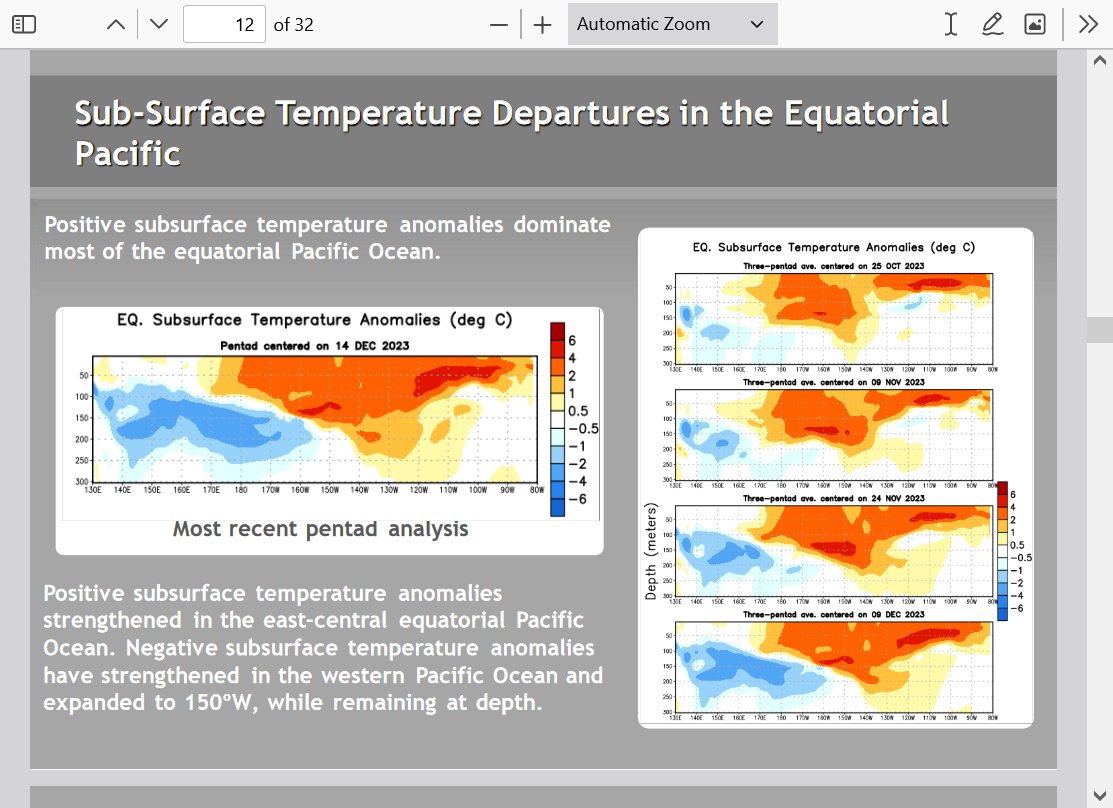
Regardless of whether we've just peaked or the peak has a short period to go, strong El Nino conditions will PERSIST into the first couple of months of 2024 and that will still be a major factor determining weather impacts from El Nino.
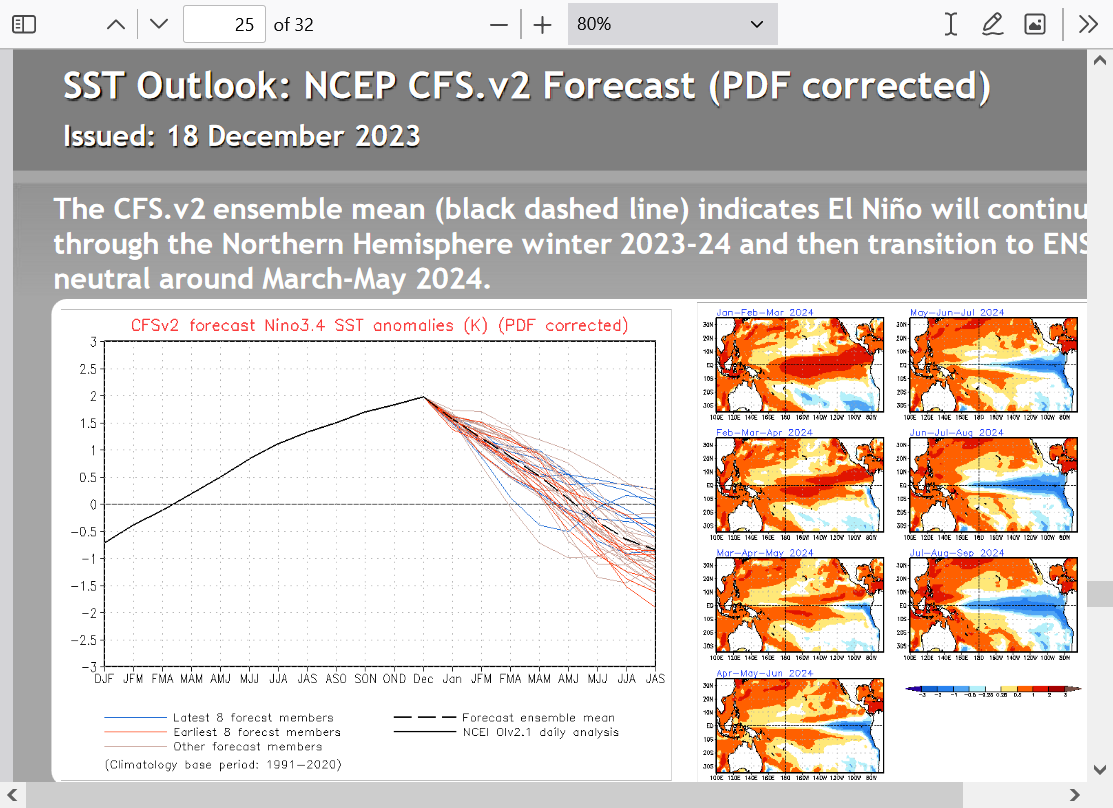
Continuing the last post with the forecast:
Please note that these are LAGGING indicators because they are based on the 3 month averages used as the metric to determine ENSO values.
If the El Nino peaked already this month, it may not show up until the Dec-Jan-Feb, 3 month average, the value of which won't be out until the end of the period, which is when February is over.
I am thinking that we are peaking right now and if not, the water temperature in the El Nino region is going to struggle to stay this warm beyond very early next year.
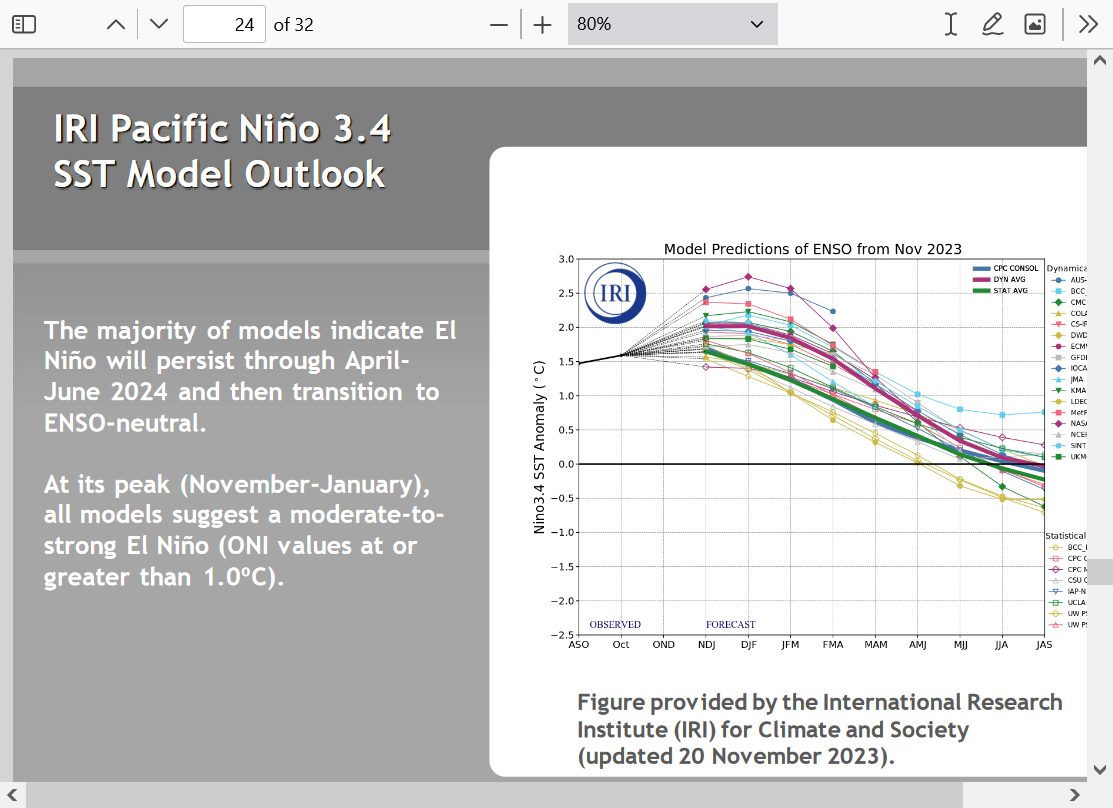
This model below shows the El Nino HAS PEAKED!!!
Regardless of whether the El Nino has just peaked or will hit that peak in January, the eastern/central Pacific ocean water temperatures will remain elevated at strong El Nino levels for the rest of the Winter, so the weather impact expected is that from a STRONG El Nino all the way to February.
My biggest concern is how quickly we go from strong El Nino to La Nina by late Summer.
Historically, this has correlated with some extreme hot/dry weather in the Plains to Midwest during that growing season.
Producers like mcfarm and cutworm have vivid memories of the Summer/drought/heat of 1983, which was a quick transition from a Super El Nino to La Nina.
And the drought of 1988 which also went from a strong El Nino that previous Winter, quickly to a La Nina.
Fortunately, the increase in CO2 and beneficial climate change in the Midwest has been protecting us in the Cornbelt from the frequency of severe droughts in the past.
Increasing CO2 besides providing atmospheric fertilizer to crops/plants, also makes plants more water efficient and drought tolerant since they don't need to open their stomata to capture CO2 as wide and this is how they lose much of their moisture thru transpiration.
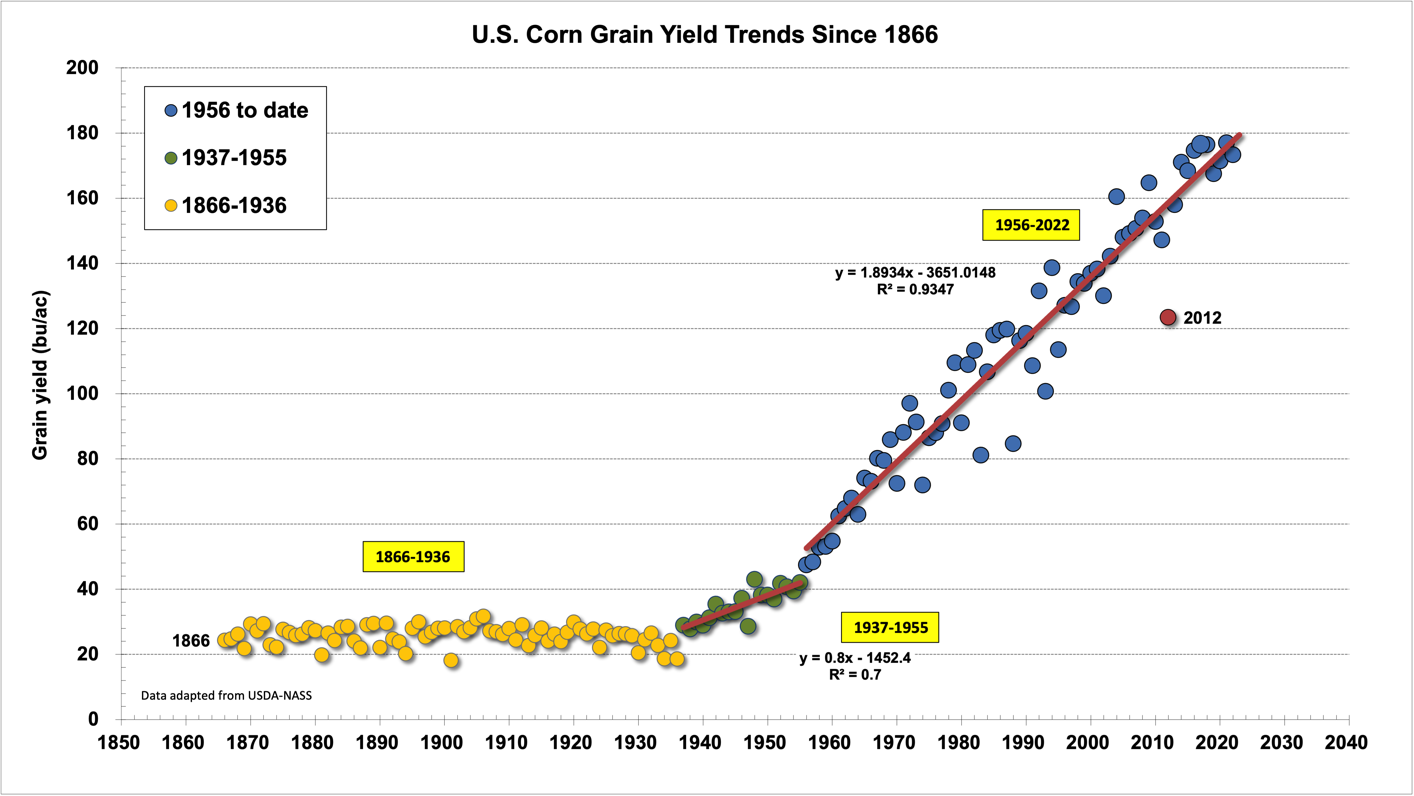
As you can see below, climate change, the increase in CO2 and technology has made it pretty tough to hurt our corn crop.
2012 was the only widespread, severe drought to do that since 1988, which is easily a record for the best growing conditions since humans have been able to record weather.
https://www.agry.purdue.edu/ext/corn/news/timeless/yieldtrends.html
More on that shortly.
Laying in bed early this morning and thinking more about the origins of El Niño with a spiritual mind instead of a scientific mind it reminded me of the time of year, as we approach Christmas.
This is in fact how the term El Niño came to be, which means “the little boy” in Spanish.
FISHERMAN living in Peru, noted the warm waters off the west cost of South America that usually peaked around Christmas, when they were preparing to celebrate the birth of the Christ child.
So they called the warm water currents El Niño!
In years when those water currents were cooler, they referred to them as La Niña ………which means “the little girl” .
Today, we know a thousand times more about oceanography, meteorology and science when it comes to understanding these currents which have existed for 10s of thousands of years and probably much longer but as we get ready to celebrate the birth of Christ next week, we are also noting the peak of that exact same current named after him using the same term, El Niño used by Christian fisherman over a century ago that were also celebrating Christmas.
And what was the profession of most of the apostles?
FISHERMAN!
More on that later today.
The El Nino has likely peaked!
A large drop in the temperature of the Peruvian Current.