
A fine and dandy August 4th to you!
Scroll down and enjoy the latest comprehensive weather to the max!!
Still alot of rain coming to many areas............about the same compared to yesterday's week 1 forecast on NWS maps below. Number #1 producer Iowa is a big winner.
Still...........maybe a dry slot from the southwest to eastern Cornbelt.
The latest rain forecasts are below...........broken down into each period coming up. Then the 1 week totals.
Day 1 below:
http://www.wpc.ncep.noaa.gov/qpf/fill_94qwbg.gif?1526306199054

Day 2 below:
http://www.wpc.ncep.noaa.gov/qpf/fill_98qwbg.gif?1528293750112

Day 3 below:
http://www.wpc.ncep.noaa.gov/qpf/fill_99qwbg.gif?1528293842764

Days 4-5 below:
http://www.wpc.ncep.noaa.gov/qpf/95ep48iwbg_fill.gif?1526306162

Days 6-7 below:
http://www.wpc.ncep.noaa.gov/qpf/97ep48iwbg_fill.gif?1526306162

7 Day Total precipitation below:
http://www.wpc.ncep.noaa.govcdx /qpf/p168i.gif?1530796126

Below are the weather maps for days 3-7. The cold front causing most of the rain is slowly sinking south next week(and moisture able to pool along and just ahead of the front. Late in the week a reinforcing cold front with some pretty cool air shows up in the Upper Midwest/Northeast........after that, heat may start returning to the Plains.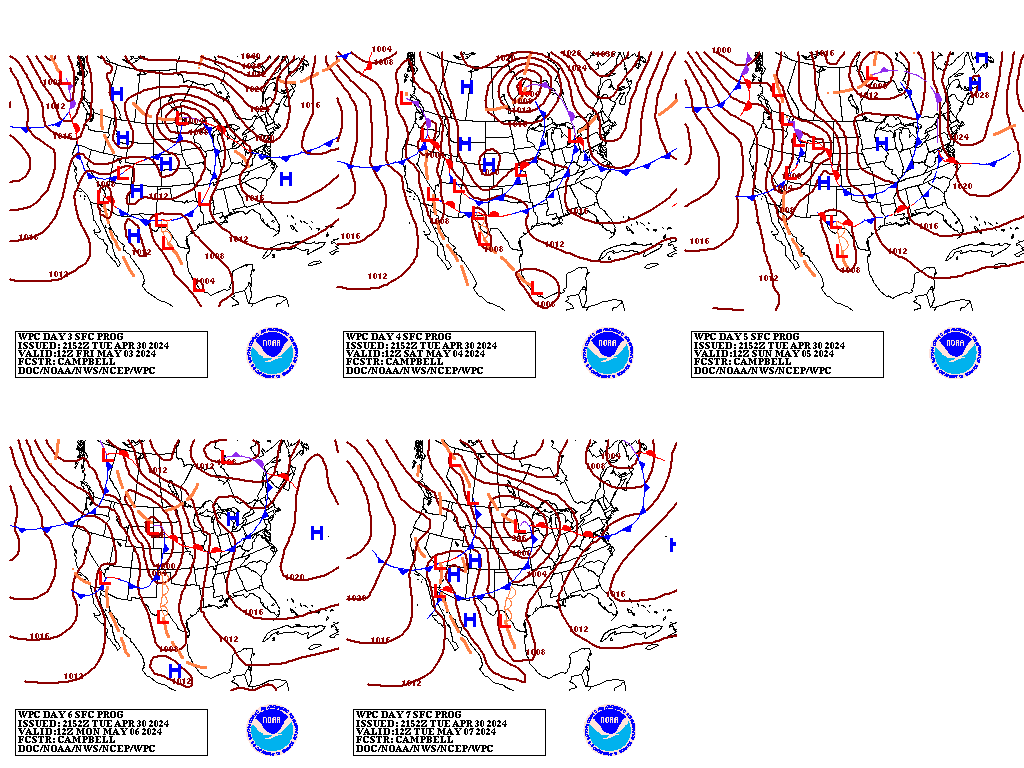
Excessive Rainfall threat. Shifts from Central Plains/Western Cornbelt to Great Lakes. See maps below:
Current Day 1 Forecast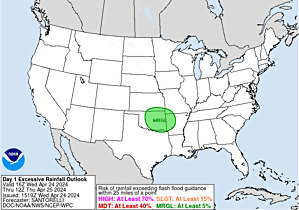 |
Day 1 Threat Area in Text Format
Current Day 2 Forecast |
Day 3 forecast below
Severe Storm Risk. Hit the map for full screen. N/C.Plains/Upper Midwest today..............then shifting slowly southeast every day.
https://www.spc.noaa.gov/products/outlook/
Current Day 1 Outlook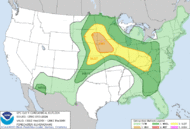 | |
Current Day 2 Outlook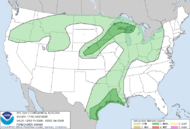 | |
Current Day 3 Outlook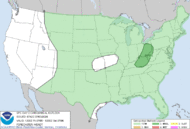 | |
Current Day 4-8 Outlook |
High Temperatures today and Sunday. Heating up a bit in some places but not far from average.......except for heat in the Southwest.
Pacific Northwest cooler than recent heat.


Dew points. 70+ on this scale makes it feel uncomfortable(sticky air)! Getting more humid with southerly winds....but this moisture will be converted to rains over the next week as it pools towards the cold front.

Highs days 3-7.
Cooling nicely Northeast, then the heat in the West is on the move..........spilling into the N.Plains, then the Upper Midwest.

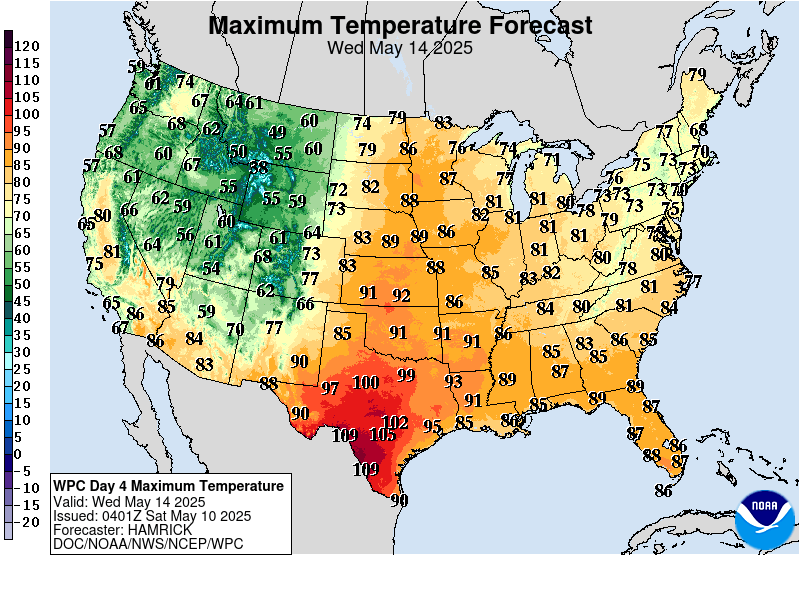


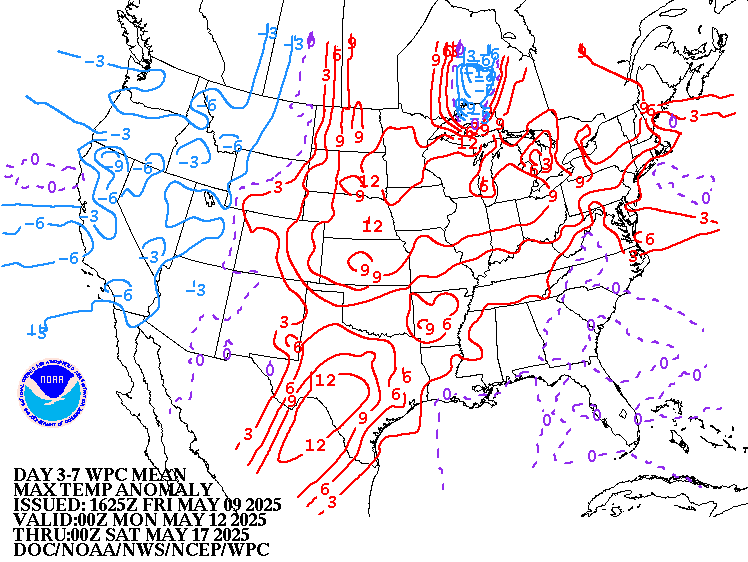
How do these days 3-7 temperatures compare to average at this time of year? We have now past the climatological time of year when temperatures are the hottest.
Above average West/Rockies to N.Plains and eventually Upper Midwest.
High temperature departures:
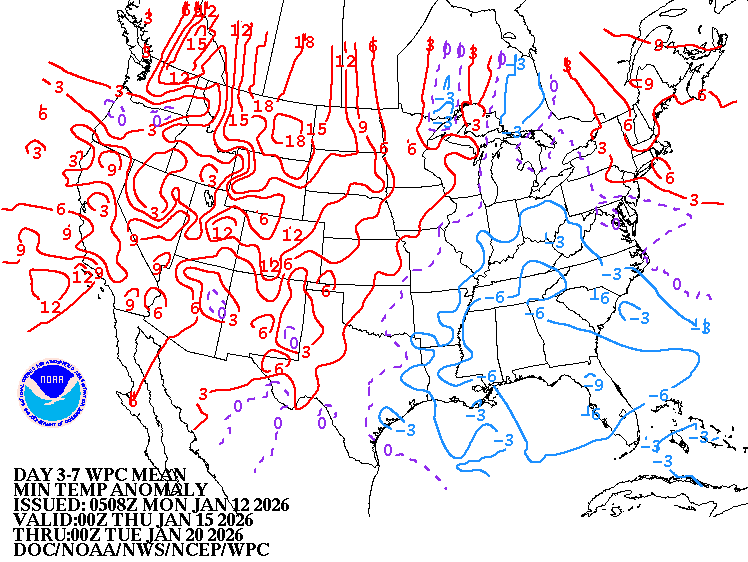
Low Temperature Departures:
Weather system from Plains to Great Lakes. High pressure Southeast.
https://weather.com/maps/currentusweather

Satellite picture. Clouds in the Upper Midwest to Plains.

Rains the past 24 hours. East Coast from a very old, long lived system. New system from the Upper Midwest to Plains.
![]()
Missouri to S.Plains in bad shape....too dry. They will dry more out the next several days....with heat too.
Good rains there later next week to part of that area.
You can go to this link to see rain totals from recent time periods:
https://water.weather.gov/precip/
Go to precipitation, then scroll down to pick a time frame. Hit states to get the borders to see locations better. Under products, you can hit "observed" or "Percent of normal"
Below are rains compared to average of the last 7, 14, 30 and 60 days.
It's been dry in the Upper Midwest but rains are right around the corner.
https://www.atmos.illinois.edu/~snodgrss/Ag_Wx.html


Drought Monitor. This product is updated every Thursday.
http://droughtmonitor.unl.edu/Maps/CompareTwoWeeks.aspx

Temperature Anomalies from GFS ensembles(fairly reliable product) going out 2 weeks. These maps show the Northern Hemisphere. The map of the US is front center. Look for the state borders in white.
Today: Heat spills into the Plains.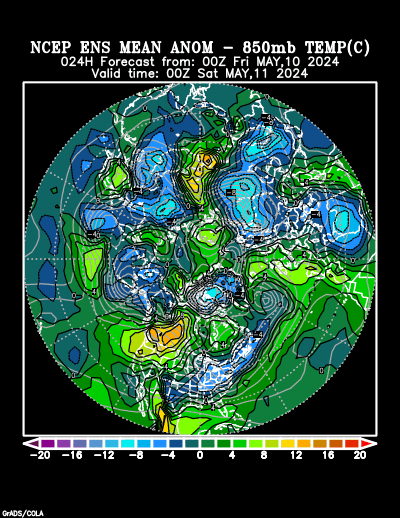
In 5+ days:
Heat builds again West.............ready to push into the N.Plains again. Left over cool air East.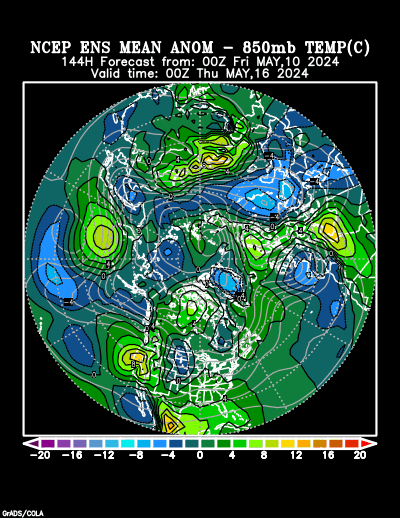
In 10+ days Hot West spilling into Plains/Upper Midwest. Not too hot Southeast.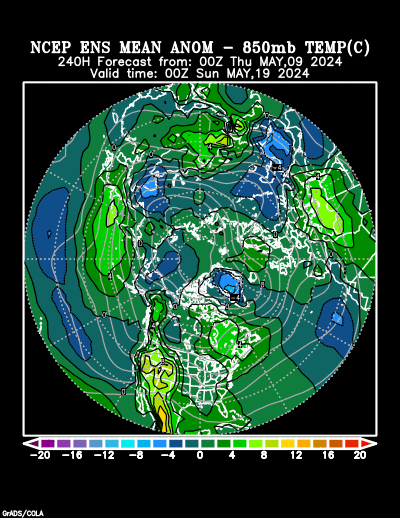
Day 15 Hot to Very Warm across most of the country.......especially North compared to average.
Here is the 0Z GFS ensemble mean average for 500 mb........same product with the temp anomalies above.
It shows an impressive upper level heat ridge building from the C/S Plains to the East Coast. This would bring major heat to the Plains, Midwest and East.
Models started suggesting that on Thursday Morning and have followed thru....especially the GFS products. As a result, todays forecast, like yesterday contiues to be warmer in week 2 compared to Thursday. (also late in week 1)
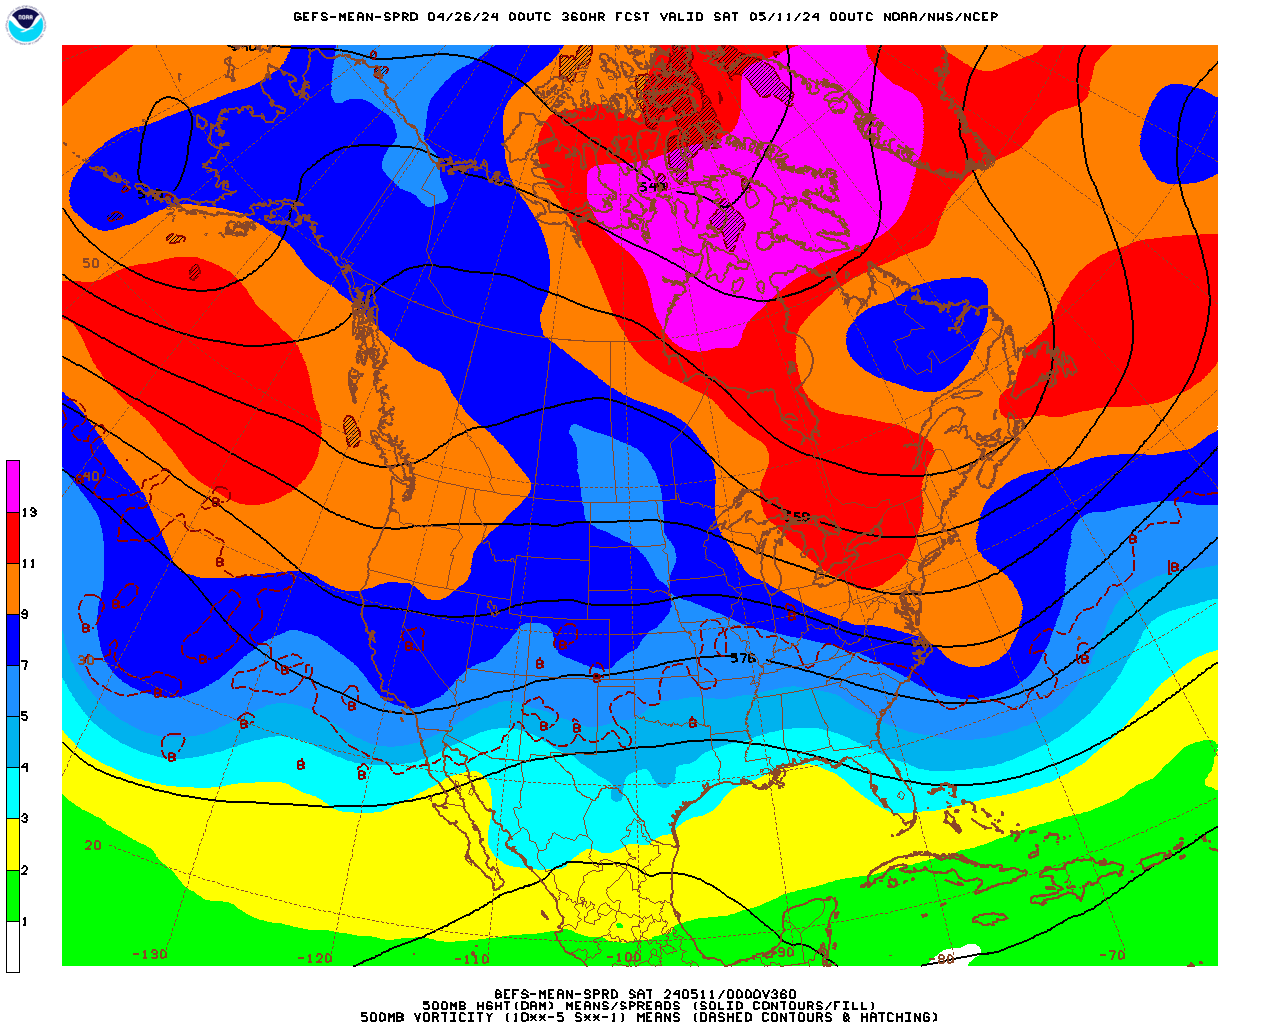
The low skill, longer range CFS model for weeks 3 and 4. Unstable/changeable pattern.
Heat builds again in the West????

Precip below:

This were today's NWS extended forecasts.
Since Thursday, I've been seeing the guidance in week 2, especially late in week 2, moving all the main weather features..........so that the maps below will be looking different.....in my current opinion....which changes like the winds-which is a good thing if you want the latest updates (-:
The 6-10 day below has a decent chance of verifying, especially early in the period........very warm/hot and dry north........wet south?
After that, the 8-14 day outlooks are even more uncertain that the usual uncertainty of those week 2 forecasts. WxFollower will tell you that this is exactly what makes following the weather so much fun and challenging. You might like 75-80 degrees and clear skies every day(with an inch of rain once a week during the growing season) but weather geeks prefer more interesting stuff.
We don't wish for bad things............hurricanes, tornadoes, record heat/cold, flooding and weather that hurts people but are fascinated with analyzing the scientific aspect...........especially the part that is constantly changing every day.
Some of us with public forecasts are committed to assisting others by providing timely weather information that can be used to make important decisions. Commodity traders and Farmers know that the weather effects the price of things that they own or trade. However, almost everybody needs to know the weather at various times during the year. .....whether it's for planning an outdoor event, planning for an upcoming snowstorm(where will the kids go if there is no school on Thursday?) or if there is the threat of severe weather(should I plan to go to the basement?).
6-10 day Temperature Probability | |
Precipitation Probability | |
8-14 day Temperature Probability | |
Precipitation Probability | |
I always wish they would include Canada in these 6-10 and 8-14 day forecasts. Looking at the current ones, it looks like where we are at is highly unpredictable. I have noticed that the daily forecasts here have been extremely variable. One day they predict cold/wet for the coming week, and the next day the prediction is for a week of hot/dry.
https://earth.nullschool.net/#current/wind/isobaric/1000hPa/orthographic=-116.89,33.85,319
i've never seen patterns in the Pacific so chaotic as now. I'm guessing that the models do not have much of anything in the data they use that is useful.
cfdr,
Actually there is alot of action going on in the East Pacific right now that is going to reek havoc for predicting weather, downstream in North America.
Nothing worth noting in the Atlantic basin right now
https://www.nhc.noaa.gov/gtwo.php?basin=atlc&fdays=5
Something going on later next week in the Central Pacific(where they are called typhoons) Hurricane Hector in the East Pacific is going to move into the Central Pacific next week)
http://www.prh.noaa.gov/cphc/pages/TWO.php?basin=cpas&fdays=5
Hurricane Hector will track south of the Hawaiian Islands on Wednesday as a minimal hurricane......probably some tropical storm winds and big waves there.
There is alot of action in the Eastern Pacific(where they are called hurricanes). Within 48 hours, we will likely have at least 3 cyclones at the same time at around the same latitude.
https://www.nhc.noaa.gov/gtwo.php?basin=epac&fdays=5

Tropical cyclones are named based on the basin of origin. Thus is a tropical cyclone begins its life cycle in the Eastern Pacific, it will be given a name from the "Eastern Pacific Names" list. When a tropical cyclone has its origins in the Central Pacific, a "Central Pacific Name" is then assigned.
| Eastern North Pacific Names: | |||||||||||||||||
|
|
|
|
|
| ||||||||||||
| These lists are also re-cycled every six years (the 2018 list will be used again in 2024). The next 2 cyclones in the Pacific, which will be growing in the Pacific early next week will be Ileana and John. | |||||||||||||||||
with the changes in weather one should look for a stronger open on Sunday night in the Grains and would think that Natty is also stronger on the open.