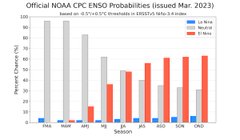
Currently, 14 of 16 dynamic models (88%) are predicting an oncoming El Niño. How does this stack up to prior March predictions? I can see them going back to 2005 at the link below. That gives us a decent sample size of 19 years.
- This March's 88% is 3rd highest of all 19 and 2nd highest of the 14 not already El Niño. That's strong support for an upcoming El Niño.
- 2015 was at 94%, but that was already El Niño unlike now. Regardless, the models did very well in not only calling for El Niño to continue but for it to strengthen.
- The other one at 94% was 2017, which turned out to be by far the worst failure of the 19 being that it ended up La Niña.
- What % of models were predicting El Niño before other El Niños that materialized?
- 2018: only 46% though it was still La Niña then making it challenging for the models.
- 2014: 69%, a good job since ENSO was still cold neutral at the time
- 2009: 60%, a good job since ENSO was still La Niña at the time
- 2006: 67%, a good job since ENSO was still La Niña at the time
So, this also reiterates that 2023 being up at 88% is strong support for El Niño. The main inconsistency is the 2017 El Niño forecast fail. Thus, although I favor El Niño, 2017 keeps me humble and from betting the ranch this early.
-----------------
Monthly ENSO model predictions back to 2005:
https://iri.columbia.edu/our-expertise/climate/forecasts/enso/current/
Thanks very much, Larry.
this is an awesome thread for a great discussion. My wife and i watched the 10 commandments last night and we are celebrating our oldest sons birthday today but I’m excited to participate, learn more and discuss ENSO stuff.
Im in the strong El Niño camp right now and believe the atmosphere has already responded to the shift.
subsurface water temps seem to make El Niño,a given. This means a resumption of global warming with very high confidence……after the La Niña driven pause.
we can discuss the upcoming weather impacts of El Niño too.
Previous thread confirming my thoughts above.
I copied the incredibly warming surface temps and Sub-Surface Temps below.
https://www.marketforum.com/forum/topic/94168/
NOAA will wait for the 3 month average to reach the El Nino threshold then tell us "El Nino" even though this lagging indicator will be months late on telling us that we already had an El Nino. See their definition below.
https://www.nws.noaa.gov/ost/climate/STIP/ElNinoDef.htm
The index is defined as a three-month average of sea surface temperature departures from normal for a critical region of the equatorial Pacific (Niño 3.4 region; 120W-170W, 5N-5S).
++++++++++++++
The 3.4 region turned positive already in March and appears to be warming rapidly right now. None of the models have an El Nino for at least a couple more months, because at the end of April, they we will still be averaging in the colder temps from Feb/Mar!!
The ocean/atmosphere in April doesn't care what the temps were 2 months ago!
I really think they should change this definition or at least change the verbiage to explain that when are already having El Nino conditions 2 months before their indicator metrics catch up to it.
Just like earlier this year. The La Nina had been dead from these rapidly warming temps but they were still averaging in colder water from 2 months earlier and still calling it an official La Nina 2 months after they should have been.
Thanks, Mike!
The Euro ensemble's April 1st forecast is now out. The trend from last month's plume is significantly more robust. Per eyeballing the Euro ensemble mean for each month:
- July increased from March 1's forecast of ~+1.0 to this forecast of ~+1.3.
- Aug increased from ~+1.1 to ~+1.5
- Sep increased from ~+1.2 to ~+1.8
- So, JAS increased from ~+1.1 last month to ~+1.5 this month.
- Oct is ~+1.9
- So, ASO is ~+1.7 on this month's.
- Keep in mind that this is based on 1981-2010 climo. But even if it were based on 1991-2020, it would be about the same per this:
https://origin.cpc.ncep.noaa.gov/products/analysis_monitoring/ensostuff/ONI_change.shtml
So, the April 1st Euro ensemble mean 3.4 plume for ASO is ~+1.7. How does this compare to some past actual El Niño ASOs?
2015: +2.2
1997: +2.1
1965: +1.9
1972, 1982: +1.6
1957: +1.3
1963: +1.2
For these 7, the average increase from ASO to peak was 0.4 with a range of 0.1 to 0.6. So, that would imply based on the April 1st Euro ASO forecast of +1.7 a later peak between +1.8 and +2.3 (mean of +2.1).
https://origin.cpc.ncep.noaa.gov/products/analysis_monitoring/ensostuff/ONI_v5.php
Keep in mind though that none of this takes into account whatever forecast bias the Euro may or may not have (see below). And of course even if the bias is negligible, there is mean forecast error to keep in mind when looking ahead that far (as much as 6 months).
How does the April 1st Euro plume mean of +1.7 for ASO compare to some past April 1st Euro progs for ASO?
- 2017: +1.1 (the year of worst forecast) vs -0.4 actual
- 2015: +2.0 vs +2.2 actual
- 2014: +1.5 vs +0.2 actual
- 2012: +1.0 vs +0.4 actual
- 2009: +0.8 based on May 1st forecast vs +0.7 actual
So, for these 5 years, the April 1st forecast mean for ASO ended up too warm 4 times and too cool once. On average for these five years, the April forecast for ASO was 0.6 too warm. Even if I were to throw out the 2017 forecast debacle, the April forecast for ASO for the remaining four years was still 0.45 too warm. So, perhaps the April 1st forecast for ASO has a too warm bias. If so, the odds would favor the actual ASO end up lower than +1.7.
But regardless, the +1.7 ASO prediction being the 2nd warmest for the Euro in April is a significant indicator that a pretty robust El Niño is probably on the way. Even if I were to reduce the +1.7 ASO forecast to +1.2 or +1.3 to account for Euro warm bias, that would still imply that the later peak would most likely end up in the strong (+1.5 to +1.9) category though most likely not super-strong and with high end moderate also in the mix. Then again, the trend from last month's Euro forecast is significantly warmer.
So, we'll see! Lots of uncertainty but the chance for a robust El Niño has increased significantly from last month based on the Euro.
Great stuff, Larry.
Tied up with severe weather today but will comment more later.
Models are everything to us in weather. However, sometimes observations and pattern recognition can help us to do even BETTER than the models.
It has looked like a very likely moderate to strong El Nino at a record fast pace for some time now. .....MUCH BEFORE NOAA tells us we have an El Nino using their greatly lagging 3 month average.
https://www.marketforum.com/forum/topic/94168/#94169
Here's the ENSO update from this week........same story:
Here's the way I'm looking at the ENSO climo from year to year based on looking at the combination of the CPC table since 1950 and Eric Webb's tables prior to 1950 that go back to 1850:
- The greatest rise since 1850 in the 3 month average from one fall/winter to the next is 3.1, which was from the 1971-2 moderate Niña to the 1972-3 super Nino.
- Next largest rises were 2.9 (1996-7 to 1997-8), 2.8 (1964-5 to 1965-6), 2.6 (1975-6 to 1976-7 and 1917-8 to 1918-9), 2.5 (1924-5 to 1925-6), 2.4 (2008-9 to 2009-10 and 1981-2 to 1982-3), 2.3 (1910-1 to 1911-2), and 2.2 (1956-7 to 1957-8 and 1898-9 to 1899-1900).
- So, there have been 11 rises greater than 2.0 since 1850. The 2022-3 ENSO dipped to a low of -1.0. So, in order for 2023-4 to reach super Nino strength (+2.0+), it would take THE largest rise since the late 1800s (the 3.1 rise from 1971-2 to 1972-3) to accomplish that.
- Based on this, alone, the chances of a super Nino peak in 2023-4 are low.
- It would take a rise of 2.5 to 2.9 to get a strong Nino peak in 2023-4. There have been five rises of 2.5 to 2.9 since 1850. That, alone, suggests a significantly higher chance for a strong Nino peak than a super Nino peak in 2023-4.
- Fwiw after adjusting for an implied warm bias, the April 1st Euro ensemble is suggesting that the highest chance is for strong over high end moderate or super (see my post above).
- Thus, as of now, I'm leaning toward a strong Nino three month averaged peak (+1.5 to +1.9) as most likely for 2023-4 with high end moderate (+1.3 to +1.4) as second most likely and super (+2.0+) as third most likely.
That lines up with everything I look at Larry, which is similar to what you look at with the same models.
Except that you provided us with a wonderful, detailed statistical analysis comparing all previous El Niño’s that goes way beyond that and really helps put it into historical perspective And helps me a great deal too.
much appreciated! As somebody that cares most about the impact on our weather and uses observations/empirical data to trump models or At least adjust model forecasts to try to improve them, my 4 comments continue to be.
1. The 3 month average used by NOAA to determine the official ENSO state is always going to lag the actual start of that condition by at least a month.
for instance, lets Look at some random numbers measuring something to provide an example to relate to.
say the critical threshold Is 10+ and we have 4 successive periods with the measurements below.
2+5+11+12+13.
when does the 3 period average go above 10?
After the first 3 periods, the 3 period average is still just 6, far below the threshold even though the actual, instantaneous reading is already above 10.
a period later, the 3 period average jumps to 9. Still below the threshold even though we are now into the 2nd period or real time, instantaneous +10 territory.
finally a period after that, the 3 period average gets to 11 and the +10, 3 period average critical threshold signal is triggered…..even though this would be the 3rd consecutive period of +10.
2. The ENSO readings to determine El Niño/La Niña come from a specific region of the tropical Pacific. There’s a very strong correlation with weather patterns downstream, especially with strong events. However, the correlation can Be greatly modulated by several factors. What are temps like in the surrounding Pacific Ocean?
A relatable example might be the southern half of the US warming up to 80+ degrees, while the northern parts stay below freezing. Not unlike the dynamic that caused recent severe weather outbreaks.
Compare that to 80 degrees F spread out across the entire country uniformly. that will usually cause quiet weather because temperature contrasts cause pressure and storm energy potential differences. that will be missing with uniform temperatures.
3. another item is how fast is the temperature change happening in the Pacific. for instance, I believe that Going from a moderate/strong La Niña to neutral very fast can impact the atmosphere similar to a strong El Niño. that’s what I think has been going on for several months.
4. the season matters a lot. water temps will be lower in the Winter, along with the lower sun angle. The jet stream will be much farther south. ENSO signal is much stronger in the Winter.
Developing El Nino is going according to plan with some metrics but there was 1 surprise for me:
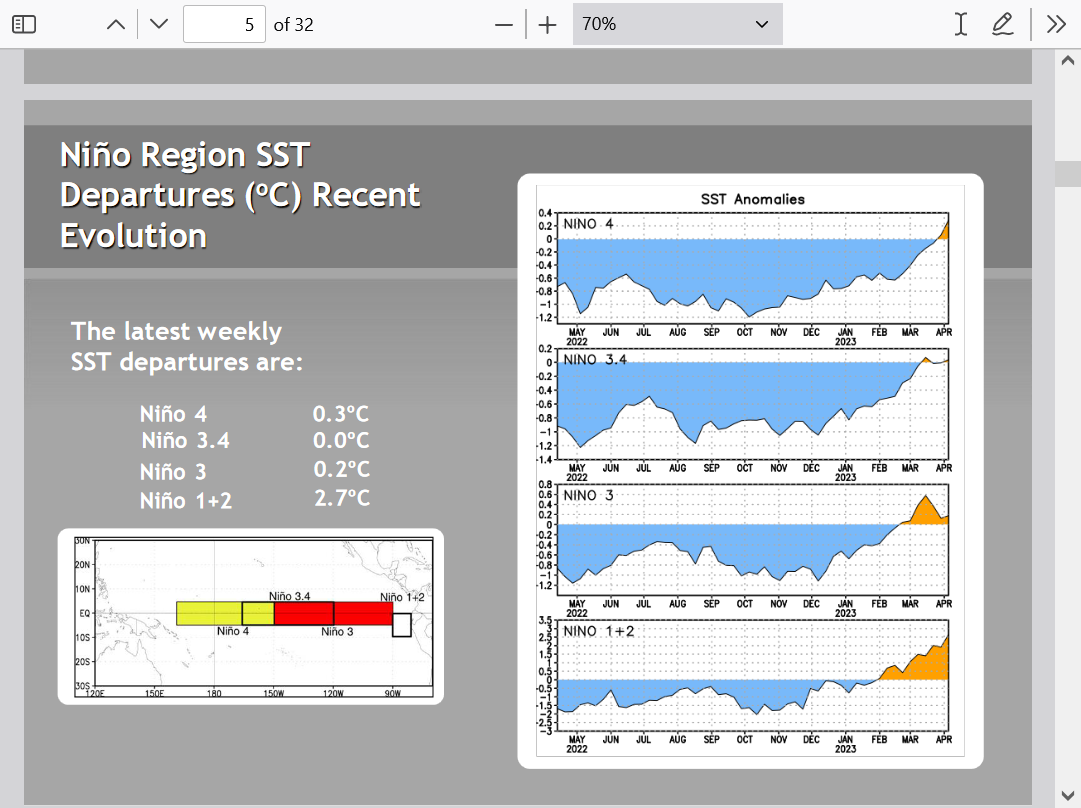
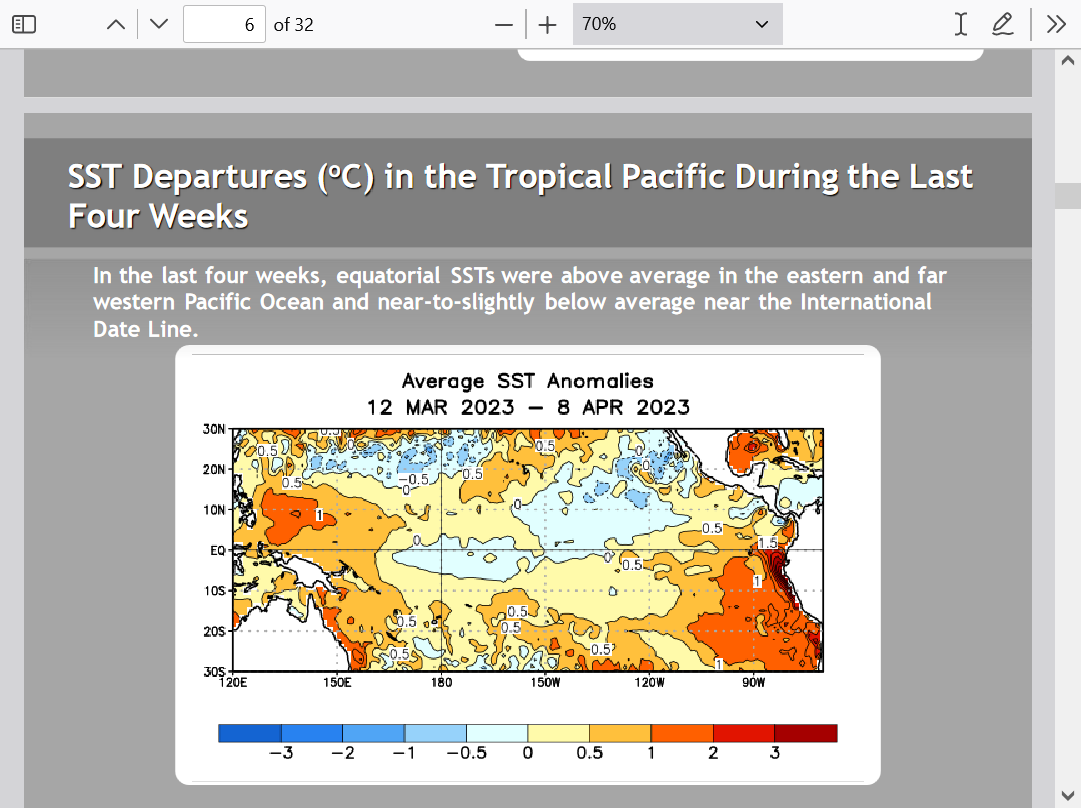
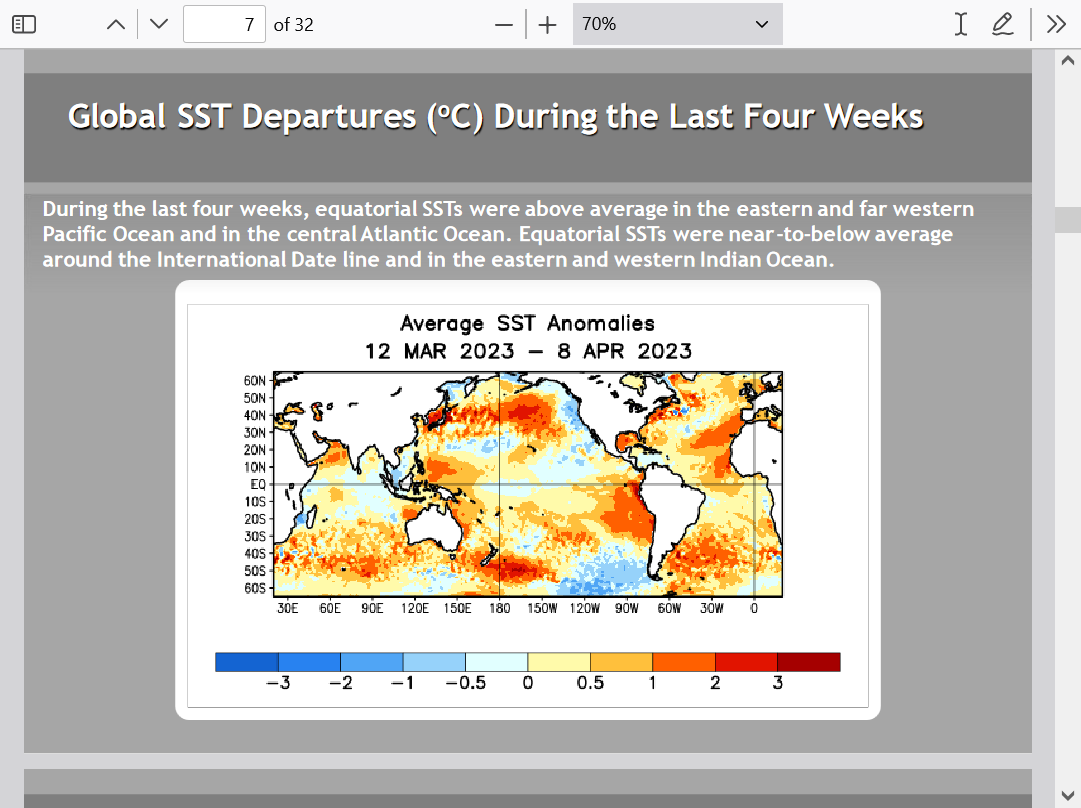
ENSO: Recent Evolution,
Current Status and Predictions
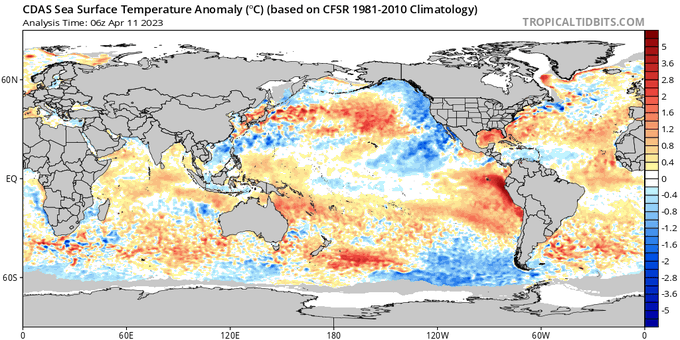
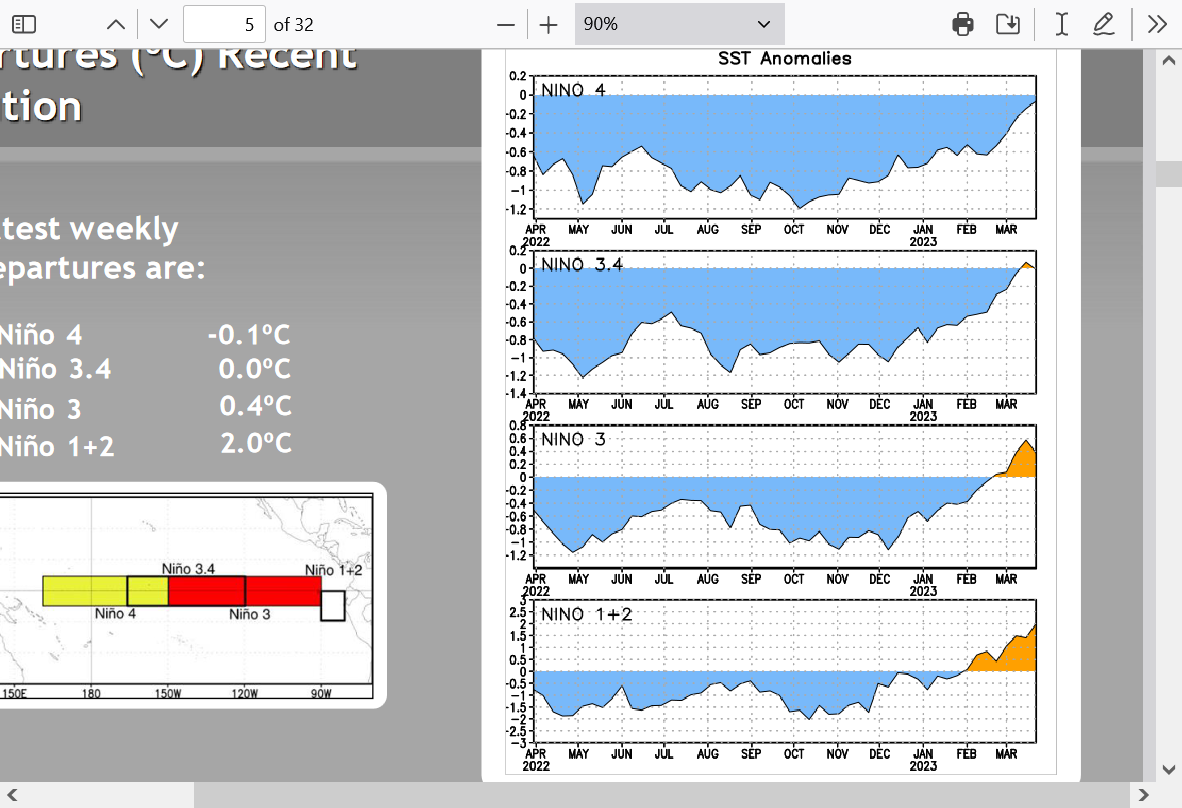
Nino region 3.4 is usually the one that's used to tell us what ENSO phase that we're in. You can see the rapid increase from cold water anomalies to near 0 this year.
But look at Nino 1+2. Holy Cow! From slight cold water anomalies to +2.7 Deg C in less than 3 months. That must be some sort of record for fastest warming in any region. Oceans usually don't warm that fast.
What's causing this?? More on that later.
Note below the COLD water anomalies that develop north of the equator at 120 West to along the Mexican and US Pacific coastlines.
I try to find an explanation to that below the images. This could have also been a product of the numerous storms hitting the Pacific this year.
Downdwelling of the water that caused it to mix with colder water below the surface off the West Coast.
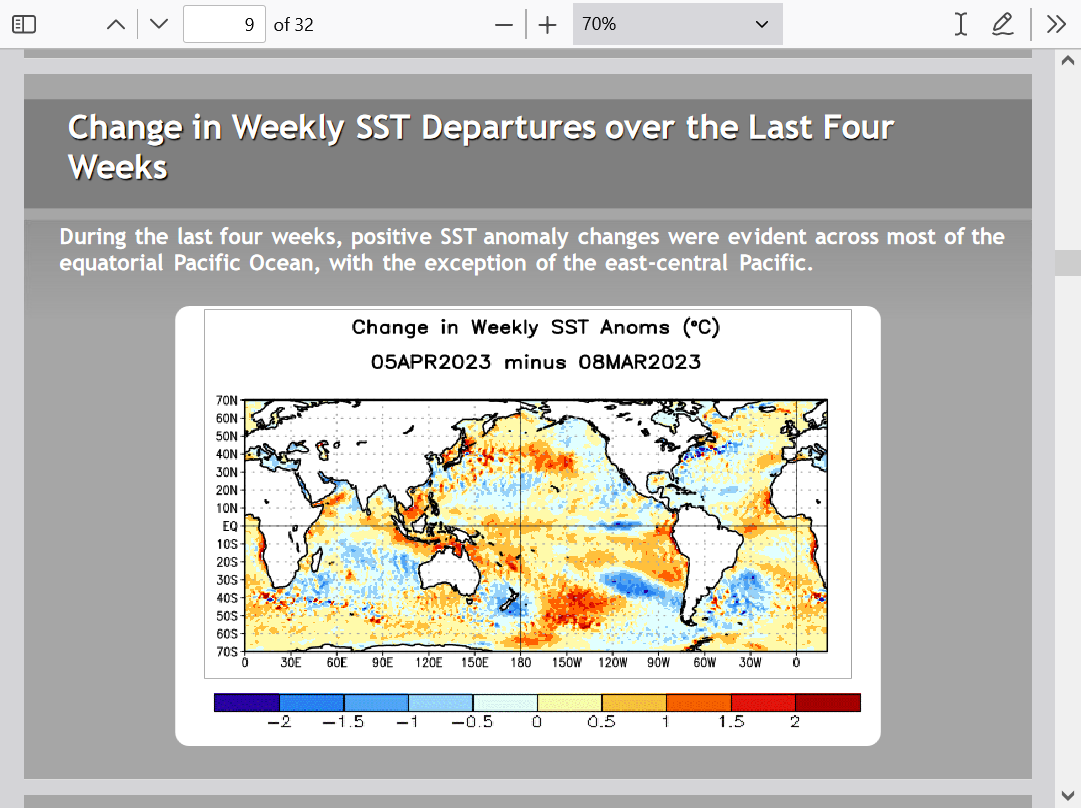

Winds, waves, and currents
in January and February
https://www.seasonsinthesea.com/jan-feb/phys.shtml
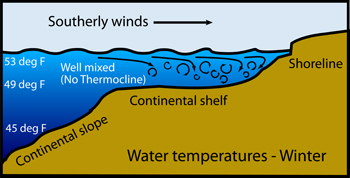
For most of the year, the water over the continental shelf (within a dozen miles of the coast) is like a bottle of oil-and-vinegar salad dressing—it is separated into two distinct layers. However, winter's southeasterly storm winds have the same effect as shaking a bottle of oil and vinegar—they mix everything up so that the entire water column becomes relatively uniform.
This mixing is a result of storm winds from the south or southeast, which push surface waters toward shore and cause them to sink—a process called "downwelling." As the surface waters sink, they mix with deeper water (see illustration).
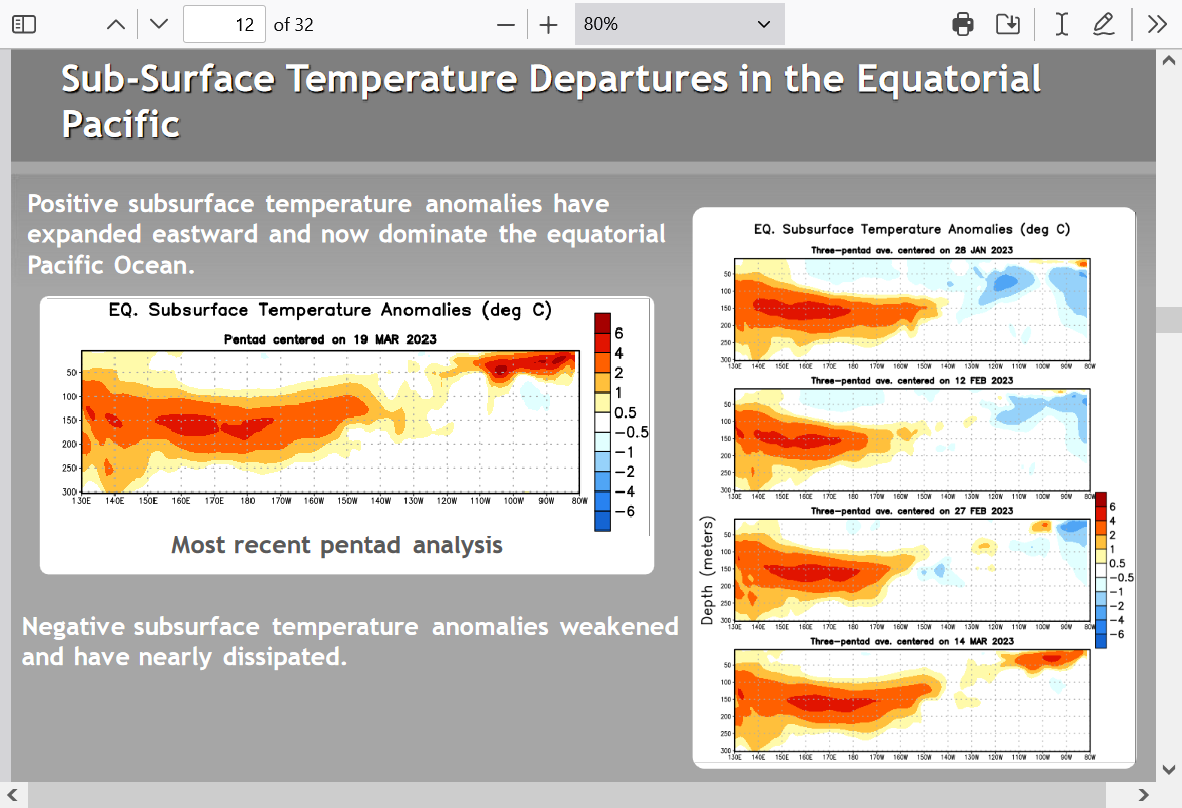
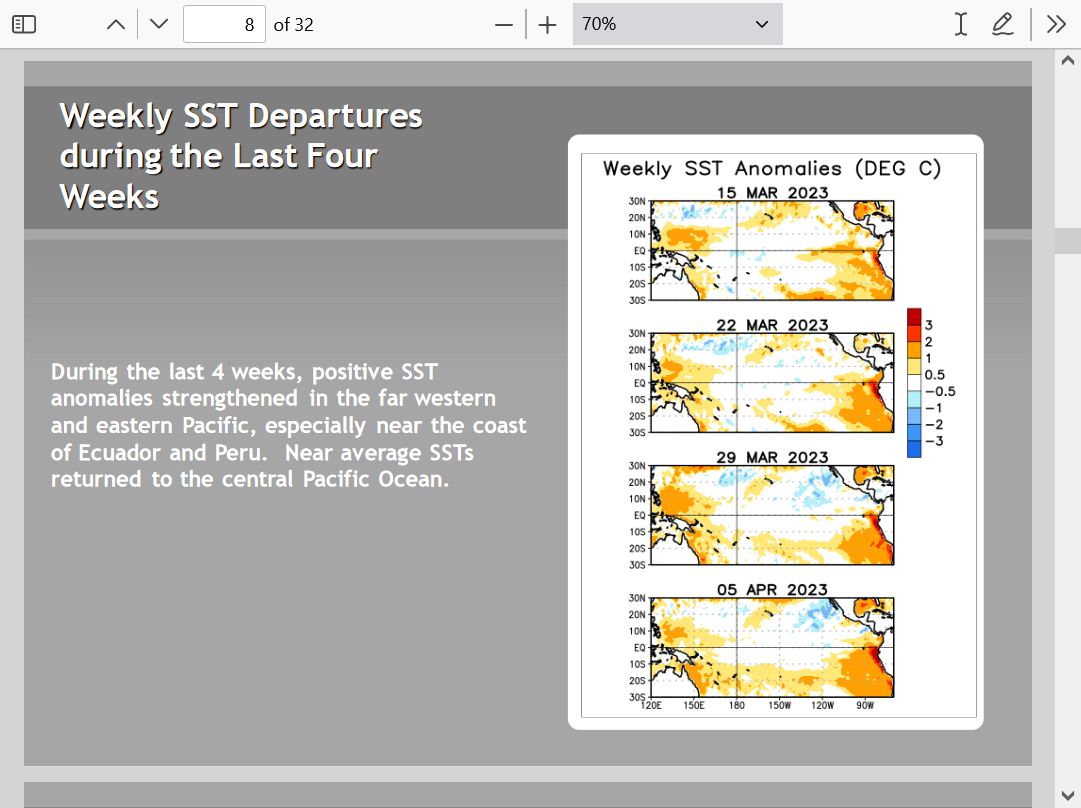
This image sure shows a strong trend.
Interesting to note that less than a year ago, the Pacific warmed, then temps unexpectedly crashed much lower. This time is much more pronounced.
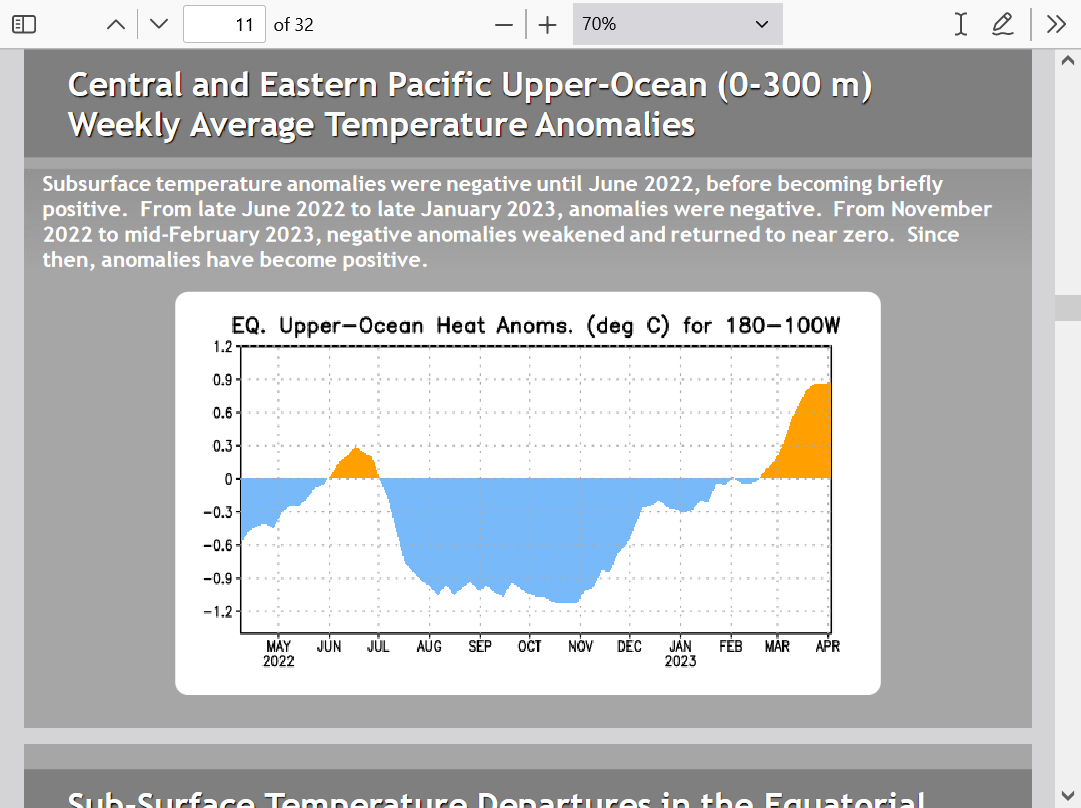
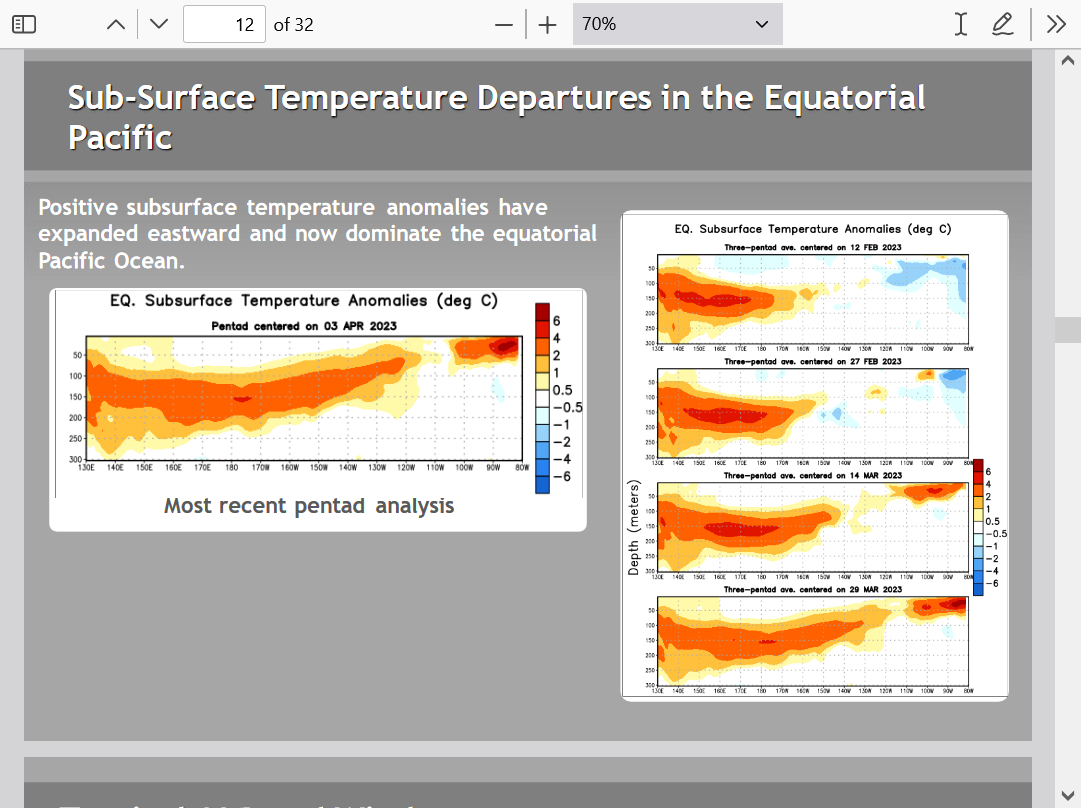
Some of the most pronounced warming has been in the sub-surface water below. It seems almost impossible to imagine us not having at least a weak El Nino looking at this.
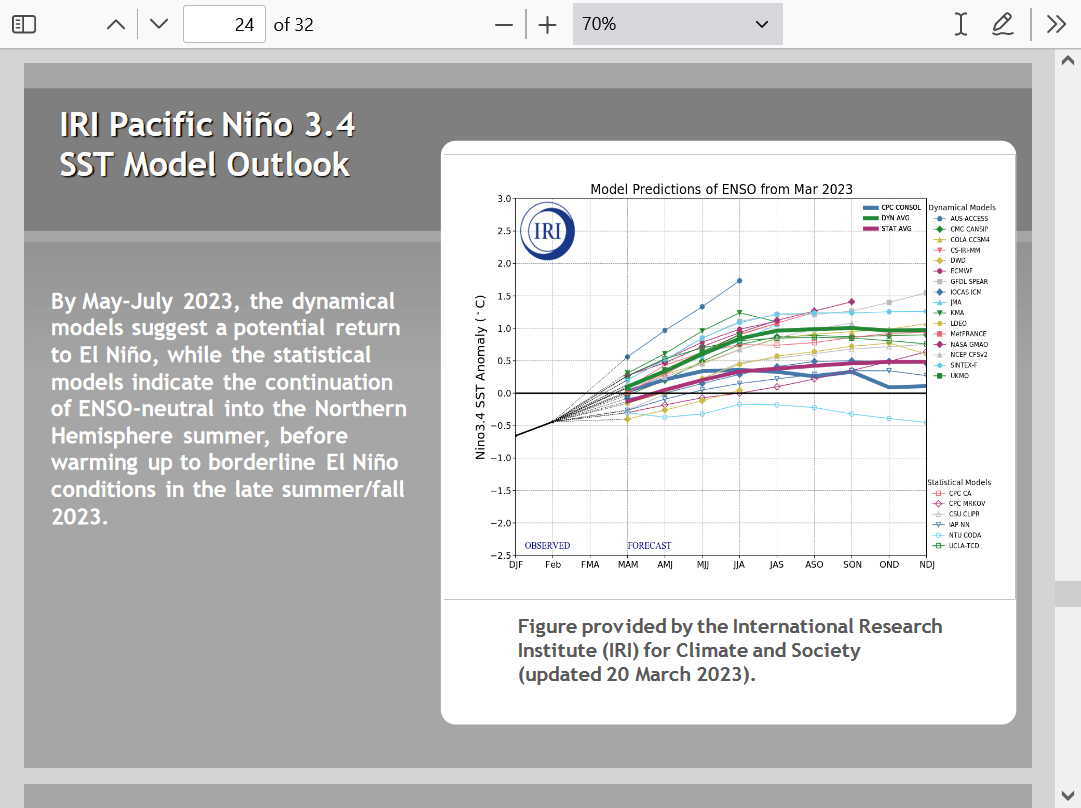
Here are some model projections. Of these shown, the CFS seems to be the most bullish for the strength of the upcoming El Nino(except for 1 outlier). This is the last graph below.
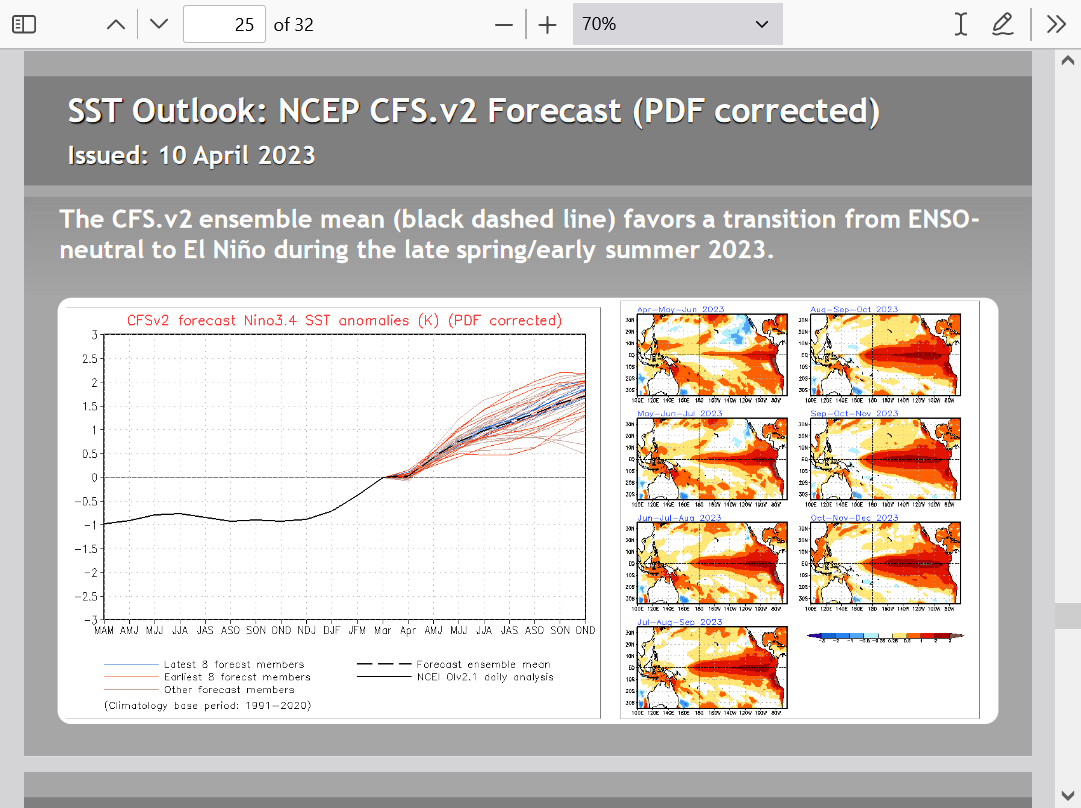
Directly above: Half the CFS members go to 1.5+(including the ensemble mean) and rising/strengthening by the O/N/D period which would push into the strong El Nino threshold as defined by Larry earlier.
https://iri.columbia.edu/our-expertise/climate/forecasts/enso/current/
https://www.marketforum.com/forum/topic/94277/#94364
https://www.marketforum.com/forum/topic/94277/#94430
In the 2nd graph above with almost 2 dozen individual models, almost all of them stay BELOW 1.5 and basically flatten the increase after this Summer.
There is 1 outlier that spikes to 1.7+ by JJA!
Related to "what's causing this" with unusual warm blobs and bands of warmth in the Pacific Ocean thru the years, that are hard to explain.
I've suspected that geothermal heat plays a bigger role in heating the ocean than what most scientists believe for the last decade. Unfortunately, there's not enough empirical data available for me to prove that. So it will remain a speculative theory.
The planets accelerated warming that started at the end of the 1970s and lasted thru the late 1990's featured an increase in El Nino's, including 2 Super El Ninos. .
The Clean Air act in the US might have resulted in some solar brightened during that time period 2.
Regardless, global climate models were developed using equations that assumed that all of it was from CO2(along with positive feedback from the resulting increase in H2O vapor).
Turns out that the warming slowed way down after that, even while atmospheric CO2 continued to increase at the same rate so all the models ended up being too warm.
This means there was something else, not in the models that was a factor. The most likely candidates for accelerated warming in the 80's/90's were the solar brightening and increase in geothermal heat.
I'll just post a few articles for now:
Geothermal heat: an episodic heat source in oceans
https://chaamjamal.files.wordpress.com/2018/12/wyss-episodic-geothermal.pdf
On this last one below. Some of these climate scientists, especially Kevin Trenberth claimed that the pause was taking place because all the extra heat being added from the extra CO2 was being stored in the deep oceans by natural cycles. That seems like quite a stretch made only because they wanted to continue to justify not being wrong about their CO2 warming equations.
The data since then show they ARE wrong. 50% too warm with their equations, in fact but they still won't change. In fact, we have even hotter models now because those will scare people more, since the real world has failed to live up to the catastrophic predictions, so the they have to exaggerate the manufactured world by even more.
It's right here, man. The models are too warm and the equations too warm and we have the smoking gun empirical data to prove it that's being ignored by mainstream science:
https://arxiv.org/pdf/1911.10605.pdf
"The IPCC Fifth Assessment Report predicted 0.508±0.102 Wm−2RF resulting from this CO2 increase, 42% more forcing than actually observed. The lack of quantitative long-term global OLR studies may be permitting inaccu-racies to persist in general circulation model forecasts of the effects of rising CO2 or other greenhouse gasses."
Profound: Smoking Guns!! Proof with accurate 2 decade long measurement of the actual amount of radiative forcing caused by CO2 of 1 irrefutable reason for WHY global climate models continue to be too warm. Climate emergency is really about social justice and brainwashing people. Even MORE confirmation that climate models overstate atmospheric warming. Models clearly too warm yet incredibly programmed to get even HOTTER! August 2020 https://www.marketforum.com/forum/topic/57636/
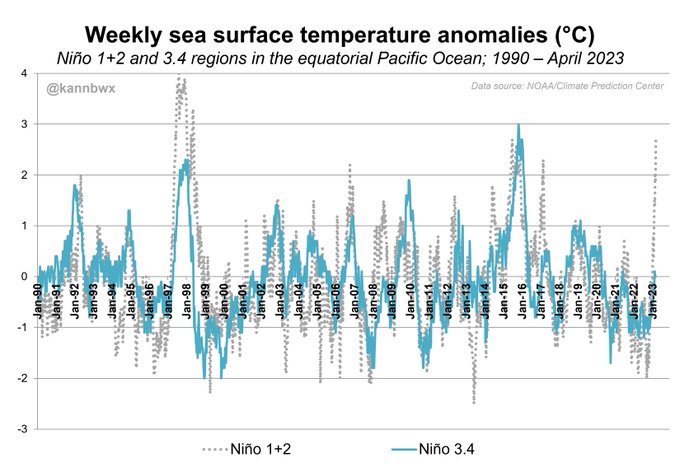
Last week, sea surface temperature anomalies off the coast of Peru (Nino 1+2 region) reached +2.7 C, rather rare & strongly characteristic of #ElNino. The last two weeks where the 1+2 anomaly was as warm or warmer were in July 2015 & June 1998. But El Nino isn't here just yet.
Isolating the Nino 1+2 and 3.4 weekly anomalies shows how rare the recent 1+2 warmth is, with the latest occurrences only during the last two "Super #ElNino" events in 2015/16 and 1997/98. The 3.4 anomaly doesn't always meet the 1+2, though.
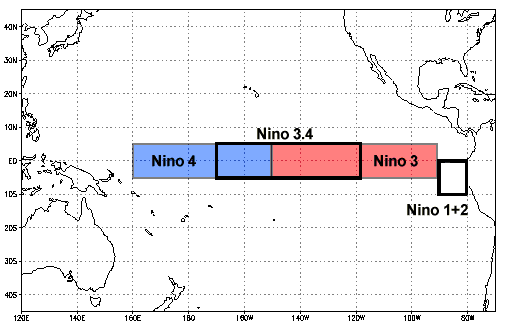
This graphic from NOAA shows the Nino regions. Nino 1+2 anomaly can swing wildly since it's the smallest region, easier for temps to fluctuate. ENSO is officially classified by the sea surface temp anomaly in the 3.4 region, but the other regions are consulted to gauge potential.
Thanks, Mike.
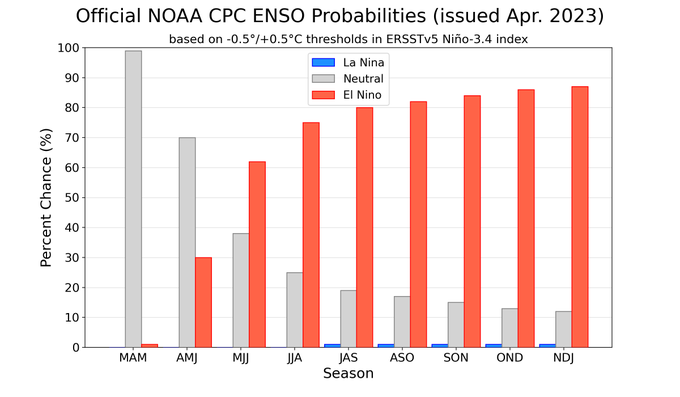
Compared to past April ENSO outlooks, the CPC is more confident in El Niño in ASO than in all other years since 2003 with 2002 being close based on JJA:
- 2023: (was 61% in March): 82%.
- 2019: (false alarm to continue): 55%
- 2018: 37%
- 2017 (false alarm models 89%): 50%
- 2015: 64%
- 2014: 61%
- 2012 (later false alarm): 35%
- 2011: 25%
- 2009: 30%
- 2006: 30%
- 2005: 40%
- 2004: 40%
- 2002: 70% in JJA
So, in order of CPC confidence of El Niño in ASO as of April:
2023, 2002, 2015, 2014, 2019, 2017, 2004/2005, 2018, 2012, 2006/2009, 2011
This doesn't mean that it is necessarily predicting the strongest El Niño of this period. Rather, it is a function of the high confidence of El Niño forming and forming early.
Great points Larry!
I've actually been gung ho on El Nino since the start of the year and believe the atmosphere already started acting like an El Nino Winter then.
U.S. CPC issued an #ElNino watch Thursday, placing more than 60% odds on El Nino conditions in the May-June-July period. That reflects a significant increase in confidence from a month ago, when those odds were less than 40%.
@kannbwx