KEY EVENTS TO WATCH FOR:
Friday, February 3, 2023
8:30 AM ET. January U.S. Employment Report
Non-Farm Payrolls (previous +223K)
Unemployment Rate (previous 3.5%)
Avg Hourly Earnings (USD) (previous 32.82)
Avg Hourly Earnings-Net Chg (USD) (previous +0.09)
Avg Hourly Earnings, M/M% (previous +0.27%)
Avg Hourly Earnings, Y/Y% (previous +4.59%)
Overall Workweek (previous 34.3)
Overall Workweek Net Chg (previous -0.1)
Government Payrolls (previous +3K)
Private Payroll (previous +220K)
Participation Rate (previous 62.3%)
Non-Farm Payrolls Bench Net Chg
9:45 AM ET. January US Services PMI
PMI, Services (previous 44.7)
10:00 AM ET. January ISM Report On Business Services PMI
Services PMI (previous 49.6)
Business Activity Idx (previous 54.7)
Prices Idx (previous 67.6)
Employment Idx (previous 49.8)
New Orders Idx (previous 45.2)
11:00 AM ET. January Global Services PMI
PMI, Services (previous 48.1)
The STOCK INDEXES? http://quotes.ino.com/ex?changes/?c=indexes
The Dow posted an inside day with a lower close on Thursday as it consolidated some of the rally off the January 20th low. The mid-range close sets the stage for a steady to lower opening when Friday's day session begins trading. Stochastics and the RSI are neutral to bullish signaling that sideways to higher prices are possible near-term. If the Dow extends the rally off the January 20th low, January's high crossing at 34,342.32 is the next upside target. Closes below the 50-day moving average crossing at 33,658.60 would signal that a short-term top has been posted. First resistance is January's high crossing at 34,342.32. Second resistance is the December 13th high crossing at 34,712.28. First support is the January 5th low crossing at 32,812.33. Second support is the December 22nd low crossing at 32,573.43.
The March NASDAQ 100 closed sharply higher on Thursday as it extends the rally off January's low. The high-range close sets the stage for a steady to higher opening when Friday's day session begins trading. Stochastics and the RSI are overbought but remain neutral to bullish signaling sideways to higher prices are possible. If March extends the rally off January's low, the 75% retracement level of the August-October decline crossing at 13,058.13 is the next upside target. Closes below the 20-day moving average crossing at 11,727.70 would signal that a short-term top has been posted. First resistance is today's high crossing at 12,934.50. Second resistance is the 75% retracement level of the August-October decline crossing at 13,058.13. First support is the 10-day moving average crossing at 12,108.12. Second support is the 20-day moving average crossing at 11,727.70.
The March S&P 500 closed higher on Thursday as it extends the rally off December's low. The mid-range close sets the stage for a steady to higher opening when Friday's day session begins trading. Stochastics and the RSI are overbought but remain neutral to bullish signaling that sideways to higher prices are possible near-term. If March extends the rally off December's low, the 87% retracement level of the August-October decline crossing at 4255.15 is the next upside target. Closes below the 20-day moving average crossing at 4008.29 would signal that a short-term top has been posted. First resistance is today's high crossing at 4208.50. Second resistance is the 87% retracement level of the August-October decline crossing at 4255.15. First support is the 10-day moving average crossing at 4067.95. Second support is the 20-day moving average crossing at 4008.29.
INTEREST RATES? http://quotes.ino.com/ex?changes/?c=interest ""
March T-bonds closed up 2-pts. at 131-23.
March T-bonds closed higher on Thursday. The mid-range close sets the stage for a steady to higher opening when Friday's day session begins trading. Stochastics and the RSI have turned neutral to bullish signaling that sideways to higher prices are possible near-term. If March resumes the rally off December's low, the 62% retracement level of the August-October decline crossing at 133-30 is the next upside target. Closes below the 50-day moving average crossing at 129-02 would confirm that a short-term top has been posted. First resistance is the January 19th high crossing at 132-31. Second resistance is the 62% retracement level of the August-October-2022 decline crossing at 133-30. First support is the 50-day moving average crossing at 129-02. Second support is December's low crossing at 124-11.
March T-notes closed down 5-pts. at 115.150.
March T-notes closed higher on Thursday. The low-range close sets the stage for a steady to slightly higher opening when Friday's day session begins trading. Stochastics and the RSI have turned neutral to bullish signaling that sideways to higher prices are possible near-term. If December renews the rally off December's low, the 62% retracement level of the August-October-2022 decline crossing at 116.235 is the next upside target. Closes below the 50-day moving average crossing at 114.030 would signal that a short-term top has been posted. First resistance is January's high crossing at 116.080. Second resistance is the 62% retracement level of the August-October-2022 decline crossing at 116.235. First support is the 50-day moving average crossing at 114.030. Second support is the December 30th low crossing at 111.280.
ENERGY MARKETS? http://quotes.ino.com/ex?changes/?c=energy ""
March crude oil closed lower on Thursday as it extended the decline off last-Friday's high. The low-range close sets the stage for a steady to lower opening when Friday's day session begins. Stochastics and the RSI are neutral to bearish signaling that sideways to lower prices are possible near-term. Closes below the the December-January uptrend line crossing near $75.20 would confirm a trend change and would open the door for a possible test of January's low crossing at $72.74.Closes above the 10-day moving average crossing at $79.32 would signal that a short-term low has been posted. First resistance is December's high crossing at $83.14. Second resistance is the November 14th high crossing at $87.00. First support is today's low crossing at $74.97. Second support is the January 5thlow crossing at $72.74.
March heating oil closed lower on Thursday as it extends the decline off January's high. The low-range close sets the stage for a steady to lower opening when Friday's day trading session begins. Stochastics and the RSI are becoming oversold but remain neutral to bearish signaling that sideways to lower prices are possible near-term. If March extends the decline off January's high, January's low crossing at $2.8500. Closes above the 10-day moving average crossing at $3.1916 would signal that a short-term low has been posted. First resistance is the 50-day moving average crossing at $3.0694. Second resistance is the 20-day moving average crossing at $3.1355. First support is January's low crossing at $2.8500. Second support is December's low crossing at $2.7047.
March unleaded gas closed lower on Thursday as it extended the decline off January's high. The low-range close sets the stage for a steady to lower opening when Friday's day session begins trading. Stochastics and the RSI are neutral to bearish signaling that sideways to lower prices are possible near-term. If March extends the decline off January's high, the 50-day moving average crossing at 2.3683 is the next downside target. Closes above the 10-day moving average crossing at 2.5789 would signal that a short-term low has been posted. First resistance is the 10-day moving average crossing at 2.5789. Second resistance is January's high crossing at $2.7186. First support is the 50-day moving average crossing at 2.3683. Second support is January's low crossing at $2.2439.
March Henry natural gas closed slightly higher on Thursday. The low-range close sets the stage for a steady to lower opening when Friday's day session begins trading. Stochastics and the RSI are oversold but remain neutral to bearish signaling that sideways to lower prices are possible near-term. If March extends the decline off November's high, the December-2020 low on the monthly continuation chart crossing at 2.238 is the next downside target. Closes above the 20-day moving average crossing at 3.066 would signal that a short-term low has been posted. First resistance is the 20-day moving average crossing at 3.66. Second resistance is the 50-day moving average crossing at 4.405. First support is today's low crossing at 2.431. Second support is the December-2020 low on the monthly continuation chart crossing at 2.238.
CURRENCIES? http://quotes.ino.com/ex?changes/?c=currencies ""
The March Dollar closed higher on Thursday as it consolidated some of Wednesday's decline and above broken support marked by the 75% retracement level of the January-September rally crossing at $101.331. The high-range close sets the stage for a steady to higher opening when Friday's session begins trading. Stochastics and the RSI are turning neutral to bullish hinting that Wednesday's decline may prove to have been a bear trap. Closes above the 20-day moving average crossing at $102.051 would signal that a short-term low has been posted while opening the door for additional gains near-term. If March extends the decline off September's high, the 87% retracement level of the January-September rally crossing at $99.229 is the next downside target. First resistance is the 20-day moving average crossing at $102.051. Second resistance is the 50-day moving average crossing at $103.532. First support is today's low crossing at $100.680. Second support is the 87% retracement level of the January-September rally crossing at $99.229.
The March Euro closed lower on Thursday as it consolidates some of the rally off September's low. The low-range close sets the stage for a steady to lower opening when Friday's day session begins trading. Stochastics and the RSI are turning neutral signaling that sideways to higher prices are possible near-term. If March extends the rally off September's low, the 38% retracement level of the 2018-2022 decline crossing at $1.14137 is the next upside target. Closes below the 20-day moving average crossing at 1.08573 would signal that a short-term top has been posted. First resistance is today's high crossing at $1.10590. Second resistance is the 38% retracement level of the 2018-2022 decline crossing at $1.14137. First support is the 20-day moving average crossing at 1.08573. Second support is the 50-day moving average crossing at $1.07055.
The March British Pound closed sharply lower on Thursday as it extends the decline off January's high. The low-range close sets the stage for a steady to lower opening when Friday's day session begins trading. Stochastics and the RSI have turned neutral to bearish signaling sideways to lower prices are possible near-term. If March resumes the rally off January's low, the 62% retracement level of the 2021-2022 decline crossing at 1.2764 is the next upside target. Closes below the 50-day moving average crossing at 1.2206 would signal that a short-term top has been posted while opening the door for a possible test of the January 6th low crossing at 1.1867. First resistance is December's high crossing at 1.2479. Second resistance is the 62% retracement level of the 2021-2022 decline crossing at 1.2764. First support is the 20-day moving average crossing at 1.2293. Second support is the 50-day moving average crossing at 1.2206.
The March Swiss Franc closed lower on Thursday hinting that today's high marked a double top with January's high. Today's low-range close sets the stage for a steady to lower opening when Friday's day session begins trading. Stochastics and the RSI are neutral to bullish signaling that sideways to higher prices are possible near-term. If March extends the rally off September's low, the 75% retracement level of the 2018-2022 decline crossing at 1.10351 is the next upside target. Closes below the 50-day moving average crossing at 1.08414 would signal that a short-term top has been posted. First resistance is today's high crossing at 1.10815. Second resistance is the 75% retracement level of the 2018-2022 decline crossing at 1.10351. First support is the 50-day moving average crossing at 1.08414. Second support is the January 6th low crossing at 1.06915.
The March Canadian Dollar closed lower on Thursday. The low-range close sets the stage for a steady to lower opening when Friday's day session begins trading. Stochastics and the RSI are overbought but remain neutral to bullish signaling that sideways to higher prices are possible near-term. If March extends the rally off January's low, November's high crossing at 75.71 is the next upside target. Closes below the 50-day moving average crossing at 74.20 would confirm that a short-term top has been posted. First resistance is today's high crossing at 75.42. Second resistance is November's high crossing at 75.71. First support is the 50-day moving average crossing at 74.20. Second support is the January 19th low crossing at 73.99.
The March Japanese Yen closed slightly higher on Thursday. The mid-range close sets the stage for a steady to higher opening when Friday’s day session begins trading. Stochastics and the RSI are turning neutral to bullish signaling that sideways to higher prices are possible near-term. If March renews the rally off October's low, the May 24th -2021 high crossing at 0.080525 is the next upside target. Closes below the January 18th low crossing at 0.076550 would confirm that a short-term top has been posted while opening the door for additional weakness near-term. First resistance is the January 17th high crossing at 0.079190. Second resistance is the May 24th -2021 high crossing at 0.080525. First support is the January 18th low crossing at 0.076550. Second support is the January 6th low crossing at 0.074830.
PRECIOUS METALS? http://quotes.ino.com/ex?changes/?c=metals ""
April gold posted a key reversal down as it closed lower on Thursday. Today's high posted a new high for the year before the sell off. The low-range close sets the stage for a steady to lower opening when Friday's day session begins trading. Stochastics and the RSI have turned neutral to bearish signaling that sideways to lower prices are possible near-term. Closes below the 20-day moving average crossing at $1926.00 would signal that a short-term top has been posted while opening the door for additional weakness near-term. If April extends the rally off November's low, the 75% retracement level of the March-October decline crossing at $1978.50 is the next upside target. First resistance is today's high crossing at $1975.20. Second resistance is the 75% retracement level of the March-October decline crossing at $1978.50. First support is the 20-day moving average crossing at $1926.00. Second support is the 50-day moving average crossing at $1859.30.
March silver closed slightly lower on Thursday as it extends the December-January trading range. The low-range close sets the stage for a steady to lower opening when Friday's day session begins trading. Stochastics and the RSI are turning neutral to bearish signaling that sideways to lower prices are possible near-term. Closes below the 50-day moving average crossing at 23.367 would mark a downside breakout of the aforementioned trading range while opening the door for additional weakness near-term. If March renews the rally off October's low, the 87% retracement level of the March-August decline crossing at 25.995 is the next upside target. First resistance is the 75% retracement level of the March-September decline crossing at 24.779. Second resistance is the 87% retracement level of the March-August decline crossing at 25.938. First support is the 50-day moving average crossing at 23.367. Second support is the December 12th low crossing at 22.735.
March copper closed lower on Thursday as it extends the decline off January's high. The low-range close sets the stage for a steady to lower opening when Friday's day session begins trading. Stochastics and the RSI are neutral to bearish signaling that sideways to lower prices are possible near-term. If March extends the aforementioned decline, the 50-day moving average crossing at 3.9276 is the next downside target. If March resumes the rally off September's low, the 75% retracement level of the March-July decline crossing at 4.4773 is the next upside target. First resistance is the January 18th high crossing at 4.3550. Second resistance is the 75% retracement level of the March-July decline crossing at 4.4773. First support is the 50-day moving average crossing at 3.9276. Second support is January's low crossing at 3.7085.
GRAINS? http://quotes.ino.com/ex?changes/?c=grains "
March Corn closed down $0.05 3/4-cents at $6.75 1/4.
March corn closed lower on Thursday. The low-range close sets the stage for a steady to lower opening when Friday's night session begins trading. Stochastics and the RSI are turning neutral to bearish signaling that sideways to lower prices are possible near-term. Closes below the 20-day moving average crossing at $6.71 3/4 would confirm that a short-term top has been posted. If March renews the rally off January's low, the 75% retracement level of the October-December decline crossing at $6.92 1/2 is the next upside target. First resistance is the January 18th high crossing at $6.88 3/4. Second resistance is the 75% retracement level of the October-December decline crossing at $6.92 1/2. First support is the 20-day moving average crossing at $6.71 3/4. Second support is the 50-day moving average crossing at $6.64.
March wheat closed up $0.01 1/4-cents at $7.61.
March wheat closed higher on Thursday as it extends the rally off January's low. The mid-range close sets the stage for a steady to higher opening when Friday's day session begins trading. Stochastics and the RSI are overbought but remain neutral to bullish signaling that sideways to higher prices are possible near-term. Closes above the October-November downtrend line crossing near $7.65 would signal that a short-term low has been posted while opening the door for a possible test of the December 30th high crossing at $7.99. If March renews this month's decline, the September 6th 2021 low crossing at $6.93 1/2 is the next downside target. First resistance is the October-November downtrend line crossing near $7.65. Second resistance is the December 30th high crossing at $7.99. First support is January's low crossing at $7.12 1/2. Second support is the September 6th 2021 low crossing at $6.93 1/2.
March Kansas City Wheat closed down $0.03 1/2-cents at $8.80 3/4.
March Kansas City wheat closed lower on Thursday as it consolidates some of the rally off January's low. The mid-range close sets the stage for a steady to lower opening when Friday's day session begins trading. Stochastics and the RSI are overbought but remain neutral to bullish signaling that sideways to higher prices are possible near-term. If March extends the aforementioned rally, the December 27th high crossing at $8.94 3/4 is the next upside target. Closes below the 20-day moving average crossing at $8.46 3/4 would signal that a short-term top has been posted. If March renews the decline off December's high, the January 10th 2022 low crossing at $7.68 3/4 is the next downside target. First resistance is today's high crossing at $8.92 3/4. Second resistance is the December 27 high crossing at $8.94 3/4. First support is the January 23rd low crossing at $8.11. Second support is the January 10th low crossing at $8.03 1/4.
March Minneapolis wheat closed down $0.01 1/4-cents crossing at $9.24 3/4.
March Minneapolis wheat closed lower on Thursday. The mid-range close sets the stage for a steady to lower opening when Friday's day session begins trading. Stochastics and the RSI are overbought but remain neutral to bullish signaling that sideways to higher prices are possible near-term. If March extends the rally off January's low, the 38% retracement level of the October-January decline crossing at $9.40 1/2 is the next upside target. Closes below the 20-day moving average crossing at $9.09 3/4 would signal that a short-term top has been posted. First resistance is today's high crossing at $9.32. Second resistance is the 38% retracement level of the October-January decline crossing at $9.40 1/2. First support is January's low crossing at $8.85. Second support is August's low crossing at $8.75 3/4.
SOYBEAN COMPLEX? http://quotes.ino.com/ex?changes/?c=grains "
March soybeans closed up $0.14-cents at $15.34 1/4.
March soybeans posted an inside day with a higher close on Thursday. The high-range close sets the stage for a steady to higher opening when Friday's day trade begins. Stochastics and the RSI are neutral to bullish signaling that sideways to higher prices are possible near-term. If March renews this year's rally. last-June's high crossing at $15.72 1/4 is the next upside target. Closes below the 20-day moving average crossing at $15.10 would signal that a short-term top has been posted. First resistance is the January 18th high crossing at $15.48 1/2. Second resistance is last-June's high crossing at $15.72 1/4. First support is the 20-day moving average crossing at $15.10. Second support is the 50-day moving average crossing at $14.88 1/4.
March soybean meal closed up $7.10 at $491.80.
March soybean meal closed higher on Thursday as it extends the rally off January's low. The high-range close sets the stage for a steady to higher opening when Friday's day session begins trading. Stochastics and the RSI are overbought but remain neutral to bullish signaling that sideways to higher prices are possible near-term. If March extends the rally off Monday's low, the March-21st-high on the monthly continuation chart crossing at $494.70 is the next upside target. Closes below the 20-day moving average crossing at $474.80 would signal that a short-term top has been posted. First resistance is today's high crossing at $493.60. Second resistance is the March-21st-high on the monthly continuation chart crossing at $494.70. First support is the 20-day moving average crossing at $474.80. Second support is January's low crossing at $452.80.
March soybean oil closed up 15-pts. At 60.94.
March soybean oil closed slightly higher on Thursday. The high-range close sets the stage for a steady to higher opening when Friday's day session begins trading. Stochastics and the RSI are turning neutral to bearish signaling that sideways to lower prices are possible near-term. If March renews the decline off the December 27th high, December's low crossing at 58.50 is the next downside target. Closes above the 20-day moving a crossing at 62.17 would signal that a short-term low has been posted. First resistance is the 20-day moving average crossing at 62.17. Second resistance is the 50-day moving average crossing at 63.84. First support is last-Friday's low crossing at 59.90. Second support is December's low crossing at 58.50.
LIVESTOCKhttp://quotes.ino.com/exchanges/?c=livestock
April hogs closed up $1.70 at $86.00.
April hogs closed higher on Thursday as it consolidated the decline off December's high. The high-range close sets the stage for a steady to higher opening when Friday's day session begins trading. Stochastics and the RSI are turning neutral to bullish with that sideways to higher prices are possible near-term. Closes above last-Friday's high crossing at $88.33 would confirm that a short-term low has been posted. If April extends the decline off December's high, October's low crossing at $82.63 is the next downside target. First resistance is the 20-day moving average crossing at $87.44. Second resistance is the January 17 high crossing at $89.08. First support is Wednesday's low crossing at $82.75. Second support is October's low crossing at $82.63.
April cattle closed up $1.55 at $163.93.
April cattle closed higher on Thursday as it renewed the rally off last-September's low. The high-range close sets the stage for a steady to higher opening on Friday. Stochastics and the RSI are overbought but remain neutral to bullish signaling that sideways to higher prices are possible near-term. If April extends the rally off January's low, the November-2014 on the monthly continuation chart crossing at $171.65 is the next upside target. Closes below the 20-day moving average crossing at $161.24 would signal that a short-term top has been posted. First resistance is today's high crossing at $163.93. Second resistance is the November-2014 on the monthly continuation chart crossing at $171.65. First support is the 20-day moving average crossing at $161.24. Second support is the 50-day moving average crossing at $160.45.
March Feeder cattle closed up $2.70 at $185.95.
March Feeder cattle posted an inside day with a higher close on Thursday and is poised to extend the rally off January's low. The high-range close sets the stage for a steady to higher opening when Friday's day session begins trading. Stochastics and the RSI are neutral to bullish signaling that sideways to higher prices are possible near-term. If March extends the rally off January's low, January's high crossing at $187.28 is the next upside target. Closes below the 10-day moving average crossing at $183.72 would signal that a short-term top has been posted. First resistance is the January 10th high crossing at $187.28. Second resistance is January's high crossing at $188.75. First support is the 10-day moving average crossing at $183.72. Second support is January's low crossing at $179.18.
FOOD & FIBERhttp://quotes.ino.com/ex changes/?c=food
March coffee closed higher on Thursday. The low-range close sets the stage for a steady to slightly higher opening on Friday. Stochastics and the RSI are overbought but remain neutral to bullish signaling sideways to higher prices are possible near-term. If March extends the rally off January's low, the 50% retracement level of the August-January decline crossing at $18.92 is the next upside target. Closes below the 20-day moving average crossing at $16.06 would signal that a short-term top has been posted. First resistance is Wednesday's high crossing at $18.42. Second resistance is the 50% retracement level of the August-January decline crossing at $18.92. First support is the 10-day moving average crossing at $16.79. Second support is the 50-day moving average crossing at $16.37.
March cocoa closed lower on Thursday. The low-range close sets the stage for a steady to lower opening on Friday. Stochastics and the RSI are turning neutral to bearish signaling that sideways to lower prices are possible near-term. Closes below the 50-day moving average crossing at 25.60 would signal that a short-term top has been posted. If March extends the aforementioned rally, the January 17th high crossing at 26.75 is the next upside target.
March sugar closed higher on Thursday. The high-range close sets the stage for a steady to higher opening on Friday. Stochastics and the RSI are overbought but remain neutral to bullish signaling that sideways to higher prices are possible near-term. If March extends the rally off January's low, monthly resistance crossing at 22.64 is the next upside target. Closes below the 20-day moving average crossing at 20.14 would signal that a short-term top has been posted.
March cotton closed slightly higher on Thursday as it extends the November-January trading range. The mid-range close sets the stage for a steady to higher opening on Friday. Stochastics and the RSI are turning neutral to bullish signaling that sideways to higher prices are possible near-term. Closes above the November 16th high crossing at 89.92 would mark a potential upside breakout of the November-January trading range while opening the door for a possible test of the 50% retracement level of the August-October decline crossing at 93.31. Closes below the 50-day moving average crossing at 83.65 would signal that a short-term top has been posted.
Thanks tallpine!
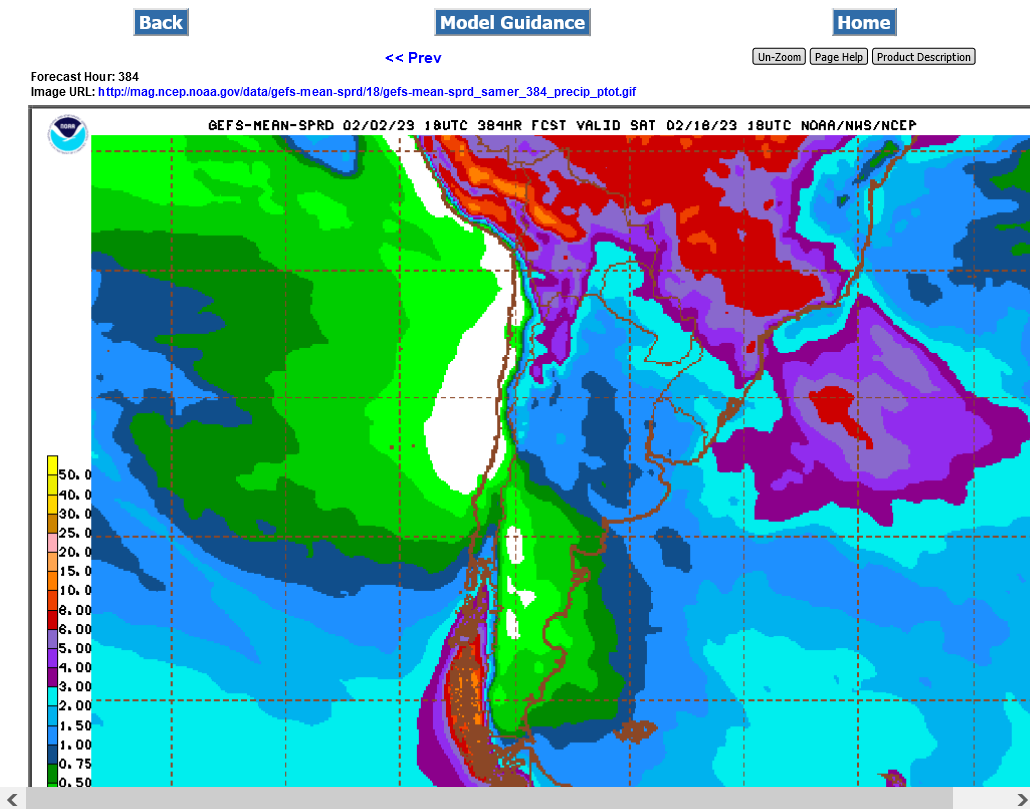
Weather in Argentina is just about played out for this growing season: