KEY EVENTS TO WATCH FOR:
Thursday, January 26, 2023
8:30 AM ET. December CFNAI Chicago Fed National Activity Index
NAI
NAI, 3-mo Moving Avg
8:30 AM ET. 4th Quarter Advance estimate GDP
Annual Rate, Q/Q% (expected +2.8%; previous +3.2%)
Chain-Weighted Price Idx, Q/Q% (expected +3.4%; previous +4.4%)
PCE Price Idx, Q/Q% (previous +4.3%)
Purchase Price Idx, Q/Q% (previous +4.8%)
Real Final Sales 1st Est, Q/Q% (previous +4.5%)
Core PCE Price Idx, Q/Q% (previous +4.7%)
Personal Consumption, Q/Q% (previous +2.3%)
8:30 AM ET. December Advance Economic Indicators Report
8:30 AM ET. December Advance Report on Durable Goods
Durable Goods-SA, M/M% (expected +2.9%; previous -2.1%)
Dur Goods, Ex-Defense, M/M% (previous -2.6%)
Dur Goods, Ex-Transport, M/M% (previous +0.2%)
Orders: Cap Gds, Non-Def, Ex-Air, M/M% (previous +0.2%)
Shipmnts: Cap Gds, Non-Def, Ex-Air, M/M% (previous -0.1%)
8:30 AM ET. Unemployment Insurance Weekly Claims Report - Initial Claims
Jobless Claims (expected 199K; previous 190K)
Jobless Claims, Net Chg (previous -15K)
Continuing Claims (previous 1647000)
Continuing Claims, Net Chg (previous +17K)
8:30 AM ET. U.S. Weekly Export Sales
10:00 AM ET. December New Residential Sales
New Home Sales (expected 615K; previous 640K)
New Home Sales, M/M% (expected -3.9%; previous +5.8%)
New Home Sales Months Supply (previous 8.6)
10:30 AM ET. EIA Weekly Natural Gas Storage Report
Working Gas In Storage (Cbf) (previous 2820B)
Working Gas In Storage, Net Chg (Cbf) (previous -82B)
11:00 AM ET. January Federal Reserve Bank of Kansas City Survey of Tenth District Manufacturing
Mfg Activity Idx (previous -13)
6-Mo Exp Prod Idx (previous 12)
Mfg Composite Idx (previous -9)
6-Mo Exp Composite Idx (previous 2)
2:00 PM ET. SEC Closed Meeting
4:30 PM ET. Foreign Central Bank Holdings
4:30 PM ET. Federal Discount Window Borrowings
Friday, January 27, 2023
8:30 AM ET. December Personal Income & Outlays
Personal Income, M/M% (expected +0.3%; previous +0.4%)
Consumer Spending, M/M% (expected -0.1%; previous +0.1%)
PCE Price Idx, M/M% (previous +0.1%)
PCE Price Idx, Y/Y% (previous +5.5%)
PCE Core Price Idx, M/M% (expected +0.3%; previous +0.2%)
PCE Core Price Idx, Y/Y% (expected +4.4%; previous +4.7%)
10:00 AM ET. December Pending Home Sales Index
Pending Home Sales (previous 73.9)
Pending Home Sales Idx, M/M% (expected -1.5%; previous -4.0%)
Pending Home Sales Idx , Y/Y% (previous -37.8%)
10:00 AM ET. January University of Michigan Survey of Consumers - final
End-Mo Sentiment Idx (expected 64.6; previous 59.7)
End-Mo Expectations Idx (previous 59.9)
12-Month Inflation Forecast (previous 4.4%)
5-Year Inflation Forecast (previous 2.9%)
End-Mo Current Idx (previous 59.4)
Monday, January 30, 2023
10:30 AM ET. January Texas Manufacturing Outlook Survey
Business Activity (previous -18.8)
Mfg Production Idx (previous 9.7)
The STOCK INDEXES? http://quotes.ino.com/ex?changes/?c=indexes
The Dow closed slightly lower on Wednesday as it consolidated some of the rally off last-Friday's low. The high-range close sets the stage for a steady to higher opening when Thursday's day session begins trading. Stochastics and the RSI are neutral to bullish signaling that sideways to higher prices are possible near-term. If the Dow extends the rally off last-Friday's low, January's high crossing at 34,342.32 is the next upside target. If the Dow renews the decline off January's high, the December 22nd low crossing at 32,573.43 is the next downside target. First resistance is January's high crossing at 34,342.32. Second resistance is the December 13th high crossing at 34,712.28. First support is the January 5th low crossing at 32,812.33. Second support is the December 22nd low crossing at 32,573.43.
The March NASDAQ 100 closed lower on Wednesday as it consolidated some of the rally off January's low. A short covering rebound in the afternoon session tempered early losses and the high-range close sets the stage for a steady to slightly lower opening when Thursday's day session begins trading. Stochastics and the RSI are overbought, diverging but remain neutral to bullish signaling sideways to higher prices are possible. If March extends the rally off January's low, the 50% retracement level of the August-October decline crossing at 12,237.16 is the next upside target. Closes below the 20-day moving average crossing at 11,327.88 would signal that a short-term top has been posted. First resistance is Tuesday's high crossing at 12,010.50. Second resistance is the 50% retracement level of the August-October decline crossing at 12,237.16. First support is the 50-day moving average crossing at 11,563.17. Second support is the 20-day moving average crossing at 11,327.88.
The March S&P 500 closed slightly lower on Wednesday as it consolidated some of the rally off December's low. A short covering rally in the afternoon session tempered early-session losses and the high-range close sets the stage for a steady to slightly lower opening when Thursday's day session begins trading. Stochastics and the RSI are overbought, diverging but remain neutral to bullish signaling that sideways to higher prices are possible near-term. If March extends the rally off December's low, the 75% retracement level of the August-October decline crossing at 4154.88 is the next upside target. Closes below the 20-day moving average crossing at 3934.03 would signal that a short-term top has been posted. First resistance is the 62% retracement level of the August-October decline crossing at 4045.36. Second resistance is the 75% retracement level of the August-October decline crossing at 4154.88. First support is the 20-day moving average crossing at 3934.03. Second support is the December 22nd low crossing at 3788.50.
INTEREST RATES? http://quotes.ino.com/ex?changes/?c=interest ""
March T-bonds closed down 2-pts. at 130-25.
March T-bonds closed slightly lower on Wednesday. The low-range close sets the stage for a steady to lower opening when Thursday's day session begins trading. Stochastics and the RSI are neutral to bearish signaling that sideways to lower prices are possible near-term. Closes below the 50-day moving average crossing at 128-12 would signal that a short-term top has been posted. If March resumes the rally off December's low, the 62% retracement level of the August-October decline crossing at 133-30 is the next upside target. First resistance is last-Thursday's high crossing at 132-31. Second resistance is the 62% retracement level of the August-October-2022 decline crossing at 133-30. First support is the 20-day moving average crossing at 128-23. Second support is the 50-day moving average crossing at 128-12.
March T-notes closed up 25-pts. at 115.035.
March T-notes closed slightly higher on Wednesday. The low-range close sets the stage for a steady to slightly higher opening when Thursday's day session begins trading. Stochastics and the RSI are neutral to bearish signaling that sideways to lower prices are possible near-term. Closes below the 50-day moving average crossing at 113.269 would signal that a short-term top has been posted. If December renews the rally off December's low, the 62% retracement level of the August-October-2022 decline crossing at 116.235 is the next upside target. First resistance is last-Thursday's high crossing at 116.080. Second resistance is the 62% retracement level of the August-October-2022 decline crossing at 116.235. First support is the 20-day moving average crossing at 114.023. Second support is the 50-day moving average crossing at 113.269.
ENERGY MARKETS? http://quotes.ino.com/ex?changes/?c=energy ""
March crude oil closed slightly higher on Wednesday. The mid-range close sets the stage for a steady to slightly higher opening when Thursday's day session begins. Stochastics and the RSI are overbought but are turning neutral to bearish signaling that sideways to lower prices are possible near-term. Closes below the 50-day moving average crossing at $78.18 would signal that a short-term top has been posted. If March extends the rally off January's low, December's high crossing at $83.14 is the next upside target. First resistance is last-Wednesday's high crossing at $82.66. Second resistance is December's high crossing at $83.14. First support is the 50-day moving average crossing at $78.18. Second support is the January 5thlow crossing at $72.74.
March heating oil closed lower on Wednesday following Tuesday's key reversal down. The low-range close sets the stage for a steady to lower opening when Thursday's day trading session begins. Stochastics and the RSI are overbought and are turning neutral to bearish signaling that sideways to lower prices are possible near-term. Closes below the 20-day moving average crossing at $3.1391 would signal that a short-term top has been posted. If March extends the rally off the January 5th low, October's high crossing at $3.4793 is the next upside target. First resistance is Tuesday's high crossing at $3.4664. Second resistance is October's high crossing at $3.4793. First support is the 10-day moving average crossing at $3.2397. Second support is the 20-day moving average crossing at $3.1391.
March unleaded gas posted a key reversal down as it closed lower on Wednesday as it consolidates some of the rally off December's low. The low-range close sets the stage for a steady to lower opening when Thursday's day session begins trading. Stochastics and the RSI are overbought but remain neutral to bullish signaling that sideways to higher prices are possible near-term. If March extends the rally off December's low, the 75% retracement level of 2022's decline crossing at $2.7856 is the next upside target. Closes below the 20-day moving average crossing at 2.4574 would signal that a short-term top has been posted. First resistance is today's high crossing at $2.7186. Second resistance is the 75% retracement level of 2022's decline crossing at $2.7856. First support is the 10-day moving average crossing at 2.5751. Second support is the 20-day moving average crossing at $2.4574.
March Henry natural gas closed lower on Wednesday as it extends the decline off September's high. The low-range close sets the stage for a steady to lower opening when Thursday's day session begins trading. Stochastics and the RSI are oversold but remain neutral to bearish signaling that sideways to lower prices are possible near-term. If March extends the decline off November's high, the March-2020 low crossing at 2.473 is the next downside target. Closes above the 20-day moving average crossing at 3.481 would signal that a short-term low has been posted. First resistance is the 20-day moving average crossing at 3.481. Second resistance is the December 27th high crossing at 4.674. First support is today's low crossing at 2.902. Second support is the March-2020 low crossing at 2.473.
CURRENCIES? http://quotes.ino.com/ex?changes/?c=currencies ""
The March Dollar closed lower on Wednesday as it extends a two-week old trading range above the 75% retracement level of the January-September rally crossing at $101.331. The low-range close sets the stage for a steady to higher opening when Thursday's session begins trading. Stochastics and the RSI are oversold but remain neutral to bearish signaling that sideways to lower prices are possible near-term. If March extends the decline off September's high, the 87% retracement level of the January-September rally crossing at $99.229 is the next downside target. Closes above the 20-day moving average crossing at $102.765 would signal that a short-term low has been posted. First resistance is the 20-day moving average crossing at $102.765. Second resistance is the 50-day moving average crossing at $104.101. First support is the 75% retracement level of the January-September rally crossing at $101.331. Second support is the 87% retracement level of the January-September rally crossing at $99.229.
The March Euro closed higher on Wednesday. The high-range close sets the stage for a steady to higher opening when Thursday's day session begins trading. Stochastics and the RSI are overbought, diverging but remain neutral to bullish signaling that sideways to higher prices are possible near-term. If March extends the rally off September's low, the March 31st high crossing at $1.09680 is the next upside target. Closes below the 20-day moving average crossing at 1.07876 would signal that a short-term top has been posted. First resistance is Monday's high crossing at $1.09625. Second resistance is the March 31st high crossing at $1.09680. First support is the 20-day moving average crossing at 1.07876. Second support is the 50-day moving average crossing at $1.06496.
The March British Pound posted an inside day with a higher close on Wednesday. The high-range close sets the stage for a steady to higher opening when Thursday's day session begins trading. Stochastics and the RSI are overbought but remain neutral to bullish signaling sideways to higher prices are possible near-term. If March extends the rally off January's low, December's high crossing at 1.2229 is the next upside target. Closes below the 50-day moving average crossing at 1.2151 would signal that a short-term top has been posted while opening the door for a possible test of the January 6th low crossing at 1.1867. First resistance is Monday's high crossing at 1.2462. Second resistance is December's high crossing at 1.2479. First support is the 50-day moving average crossing at 1.2151. Second support is the January 6th low crossing at 1.1861.
The March Swiss Franc closed higher on Wednesday as it consolidated some of the decline off last-Wednesday's high. The high-range close sets the stage for a steady to higher opening when Thursday's day session begins trading. Stochastics and the RSI are turning neutral to bullish signaling that sideways to higher prices are possible near-term. If March resumes the rally off September's low, the 75% retracement level of the 2018-2022 decline crossing at 1.10351 is the next upside target. Closes below the 50-day moving average crossing at 1.08145 would signal that a short-term top has been posted. First resistance is the 62% retracement level of the 2018-2022 decline crossing at 1.10351. Second resistance is the 75% retracement level of the 2018-2022 decline crossing at 1.10351. First support is the 50-day moving average crossing at 1.08145. Second support is the January 6th low crossing at 1.06915.
The March Canadian Dollar closed lower on Wednesday. The mid-range close sets the stage for a steady to lower opening when Thursday's day session begins trading. Stochastics and the RSI are becoming overbought, diverging but remain neutral to bullish signaling that sideways to higher prices are possible near-term. If March renews this month's rally, November's high crossing at 75.71 is the next upside target. Closes below last-Thursday's low crossing at 73.40 would signal that a short-term top has been posted. First resistance is the November 25thhigh crossing at 75.16. Second resistance is November's high crossing at 75.71. First support is last-Thursday low crossing at 73.40. Second support is the December 16th low crossing at 73.04.
The March Japanese Yen closed higher on Wednesday as it consolidates some of the decline off last-Tuesday's high. The high-range close sets the stage for a steady to higher opening when Thursday’s day session begins trading. Stochastics and the RSI are turning neutral to bullish signaling that sideways to higher prices are possible near-term. If March renews the rally off October's low, the May 24th -2021 high crossing at 0.080525 is the next upside target. Closes below the 20-day moving average crossing at 0.07700 would signal that a short-term top has been posted while opening the door for additional weakness near-term. First resistance is last-Tuesday's high crossing at 0.079190. Second resistance is the May 24th -2021 high crossing at 0.080525. First support is the 20-day moving average crossing at 0.077000. Second support is the January 6th low crossing at 0.074830.
PRECIOUS METALS? http://quotes.ino.com/ex?changes/?c=metals ""
April gold closed higher on Wednesday as it extends the rally off November's low. The high-range close sets the stage for a steady to higher opening when Thursday's day session begins trading. Stochastics and the RSI are overbought but remain neutral to bullish signaling that sideways to higher prices are possible near-term. If April extends the rally off November's low, the 75% retracement level of the March-October decline crossing at $1978.50 is the next upside target. Closes below the 20-day moving average crossing at $1898.20 would signal that a short-term top has been posted while opening the door for additional weakness near-term. First resistance is Tuesday's high crossing at $1960.50. Second resistance is the 75% retracement level of the March-October decline crossing at $1978.50. First support is the 10-day moving average crossing at $1934.30. Second support is the 20-day moving average crossing at $1898.20.
March silver closed higher on Wednesday while extending the December-January trading range. The high-range close sets the stage for a steady to higher opening when Thursday's day session begins trading. Stochastics and the RSI are turning neutral to bullish signaling that sideways to higher prices are possible near-term. If March renews the rally off October's low, the 87% retracement level of the March-August decline crossing at 25.995 is the next upside target. Closes below the 50-day moving average crossing at 23.118 would confirm a downside breakout of the aforementioned trading range while opening the door for additional weakness near-term. First resistance is the 75% retracement level of the March-September decline crossing at 24.779. Second resistance is the 87% retracement level of the March-August decline crossing at 25.938. First support is the 50-day moving average crossing at 23.118. Second support is the December 6th low crossing at 22.190.
March copper closed slightly higher on Wednesday. The high-range close sets the stage for a steady to higher opening when Thursday's day session begins trading. Stochastics and the RSI are overbought but remain neutral to bullish signaling that sideways to higher prices are possible near-term. If March extends the rally off September's low, the 75% retracement level of the March-July decline crossing at 4.4773 is the next upside target. Closes below the 20-day moving average crossing at 4.0471 would signal that a short-term top has been posted. First resistance is last-Wednesday's high crossing at 4.3550. Second resistance is the 75% retracement level of the March-July decline crossing at 4.4773. First support is the 10-day moving average crossing at 4.2281. Second support is the 20-day moving average crossing at 4.0471.
GRAINS? http://quotes.ino.com/ex?changes/?c=grains "
March Corn closed down $0.02 1/4-cents at $6.74 3/4.
March corn closed lower on Wednesday. The low-range close sets the stage for a steady to lower opening when Thursday's night session begins trading. Stochastics and the RSI are neutral to bearish signaling that sideways to lower prices are possible near-term. Closes below the 50-day moving average crossing at $6.62 1/4 would confirm that a short-term top has been posted. If March renews this month's rally, the 75% retracement level of the October-December decline crossing at $6.92 1/2 is the next upside target. First resistance is last-Wednesday's high crossing at $6.88 3/4. Second resistance is the 75% retracement level of the October-December decline crossing at $6.92 1/2. First support is the 50-day moving average crossing at $6.62 1/4. Second support is January's low crossing at $6.48 1/4.
March wheat closed higher $0.06 3/4-cents at $7.41 1/4.
March wheat closed higher on Wednesday. The mid-range close sets the stage for a steady to higher opening when Thursday's day session begins trading. Stochastics and the RSI are oversold, diverging but are turning neutral to bullish signaling that sideways to higher prices are possible near-term. Closes above the 50-day moving average crossing at $7.68 1/4 would signal that a short-term low has been posted. If March extends this month's decline, the September 6th 2021 low crossing at $6.93 1/2 is the next downside target. First resistance is the 20-day moving average crossing at $7.50. Second resistance is the 50-day moving average crossing at $7.68 1/4. First support is Monday's low crossing at $7.12 1/2. Second support is the September 6th 2021 low crossing at $6.93 1/2.
March Kansas City Wheat closed up $0.09 1/2-cents at $8.43 1/4.
March Kansas City wheat closed higher on Wednesday as it consolidated some of the decline off last-Wednesday's high. The mid-range close sets the stage for a steady to higher opening when Thursday's day session begins trading. Stochastics and the RSI are turning neutral to bullish signaling that sideways to higher prices are possible near-term. If March resumes the rally off January's low, the 50-day moving average crossing at $8.68 3/4 is the next upside target. If March renews the decline off December's high, the January 10th 2022 low crossing at $7.68 3/4 is the next downside target. First resistance is the 50-day moving average crossing at $8.68 3/4. Second resistance is the December 27 high crossing at $8.94 3/4. First support is January's low crossing at $8.03 1/4. Second support is the January 10th 2022 low crossing at $7.68 3/4.
March Minneapolis wheat closed up $0.06 1/2-cents crossing at $9.09 1/2.
March Minneapolis wheat closed higher on Wednesday. The mid-range close sets the stage for a steady to higher opening when Thursday's day session begins trading. Stochastics and the RSI are turning neutral to bullish signaling that sideways to higher prices are possible near-term. Closes above the 50-day moving average crossing at $9.24 would signal that a short-term low has been posted. If March extends the decline off November's high, August's low crossing at $8.75 3/4 is the next downside target. First resistance is the 50-day moving average crossing at $9.24. Second resistance is the January 30th high crossing at $9.40. First support is Monday's low crossing at $8.85. Second support is August's low crossing at $8.75 3/4.
SOYBEAN COMPLEX? http://quotes.ino.com/ex?changes/?c=grains "
March soybeans closed up $0.14-cents at $15.02 1/2.
March soybeans posted an upside reversal and closed higher on Wednesday as it consolidated some of the decline off last-Wednesday's high. The high-range close sets the stage for a steady to higher opening when Thursday's day trade begins. Stochastics and the RSI are turning neutral to bullish signaling that sideways to higher prices are possible near-term. If March renews this month's rally. last-June's high crossing at $15.72 1/4 is the next upside target. If March extends the decline off last-Wednesday's high, January's low crossing at $14.65 is the next downside target. First resistance is last-Wednesday's high crossing at $15.48 1/2. Second resistance is last-June's high crossing at $15.72 1/4. First support is the 50-day moving average crossing at $14.78. Second support is January's low crossing at $14.65.
March soybean meal closed up $5.70 at $465.50.
March soybean meal posted an upside reversal and closed higher on Wednesday as it consolidated some of the decline off last-Wednesday's high. The high-range close sets the stage for a steady to higher opening when Thursday's day session begins trading. Stochastics and the RSI are turning neutral to bullish signaling that sideways to higher prices are possible near-term. Closes above the 10-day moving average crossing at $471.50 would temper the near-term bearish outlook. If March extended the aforementioned decline, the 25% retracement level of the 2021-2023-rally crossing at $446.10 is the next downside target. First resistance is last-Wednesday's high crossing at $487.00. Second resistance is the August 29th high on the monthly continuation chart crossing at $488.40 is the next upside target. First support is the January 5th low crossing at $457.20. Second support is the 25% retracement level of the 2021-2023 rally crossing at $446.10.
March soybean oil closed down 44-pts. At 60.54.
March soybean oil closed lower on Wednesday as it extended the decline off last-Wednesday's high. The mid-range close sets the stage for a steady to lower opening when Thursday's day session begins trading. Stochastics and the RSI are oversold but remain neutral to bearish signaling that sideways to lower prices are possible near-term. If March extends the decline off the December 27th high, December's low crossing at 58.50 is the next downside target. Closes above last-Wednesday's high crossing at 64.75 would signal that a short-term low has been posted. First resistance is last-Wednesday's high crossing at 64.75. Second resistance is the 50-day moving average crossing at 64.98. First support is today's low crossing at 60.00. Second support is December's low crossing at 58.50.
LIVESTOCKhttp://quotes.ino.com/exchanges/?c=livestock
April hogs closed down $0.08 at $85.30.
April hogs posted an inside day with a lower close on Wednesday as it extended the trading range of the past four-days. The mid-range close sets the stage for a steady to slightly lower opening when Thursday's day session begins trading. Stochastics and the RSI are oversold but remain bearish signaling that sideways to lower prices are possible near-term. If April extends the aforementioned decline, October's low crossing at $82.63 is the next downside target. Closes above the 10-day moving average crossing at $86.34 would signal that a short-term low has been posted. First resistance is the 10-day moving average crossing at $86.34. Second resistance is the January 17th high crossing at $89.08. First support is Tuesday's low crossing at $84.00. Second support is October's low crossing at $82.63.
April cattle closed up $0.13 at $161.43.
April cattle closed slightly higher on Wednesday as it extends the rally off last-Thursday's low. The high-range close sets the stage for a steady to higher opening on Thursday. Stochastics and the RSI are neutral to bullish signaling that sideways to higher prices are possible near-term. If April extends the aforementioned rally, December's high crossing at $162.75 is the next upside target. If April renews the decline off January's high, the 25% retracement level of the 2021-2022 rally crossing at $157.566 is the next downside target. First resistance is today's high crossing at $161.78. Second resistance is December's high crossing at $162.75. First support is the 25% retracement level of the 2021-2022 rally crossing at $157.566. Second support is the December 7th low crossing at $156.85.
March Feeder cattle closed up $0.05 at $183.65.
March Feeder cattle closed slightly higher on Wednesday as it extended the rally off last-Thursday's low. The high-range close sets the stage for a steady to higher opening when Thursday's day session begins trading. Stochastics and the RSI are neutral to bullish signaling that sideways to higher prices are possible near-term. Closes above the 50-day moving average crossing at $184.09 would signal that a short-term low has been posted. If March renews the decline off January's high, the October 14th low crossing at $176.28 is the next downside target. First resistance is the 50-day moving average crossing at $184.09. Second resistance is the 20-day moving average crossing at $184.50. First support is last-Thursday's low crossing at $179.18. Second support is the October 14th low crossing at $176.28.
FOOD & FIBERhttp://quotes.ino.com/ex changes/?c=food
March coffee closed higher on Wednesday as it extends the rally off January's low. The high-range close sets the stage for a steady to higher opening on Thursday. Stochastics and the RSI are neutral to bullish signaling sideways to higher prices are possible near-term. Multiple close above the 50-day moving average crossing at $16.21 would confirm that a short-term low has been posted. If March renews the decline off December's high, the 87% retracement level of the 2020-2022 rally crossing at $13.20 is the next downside target. First resistance is the 50-day moving average crossing at $16.21. Second resistance is December's high crossing at $17.50. First support is the January 11th low crossing at $14.21. Second support is the 87% retracement level of the 2020-2022 rally crossing at $13.20.
March cocoa closed slightly lower on Wednesday. The mid-range close sets the stage for a steady to lower opening on Thursday. Stochastics and the RSI are turning neutral to bullish signaling that sideways to higher prices are possible near-term. Closes above the 20-day moving average crossing at 26.11 would signal that a short-term low has been posted. If March renews the decline off January's high, the December 16th low crossing at 24.68 is the next downside target.
March sugar closed higher on Wednesday. The high-range close sets the stage for a steady to higher opening on Thursday. Stochastics and the RSI remain neutral to bullish signaling that sideways to higher prices are possible near-term. If March renews the rally off January's low, November's high crossing at 20.48 is the next upside target. Closes below the reaction low crossing at 19.45 would signal that a short-term top has been posted while opening the door for additional weakness near-term.
March cotton closed slightly higher on Wednesday as it extends the November-January trading range. The high-range close sets the stage for a steady to higher opening on Thursday. Stochastics and the RSI are neutral to bullish signaling that sideways to higher prices are possible near-term. If March resumes the rally off October's low, the 50% retracement level of the August-October decline crossing at 93.31 is the next upside target. Closes below the 50-day moving average crossing at 83.61 would signal that a short-term top has been posted.
Thanks tallpine!
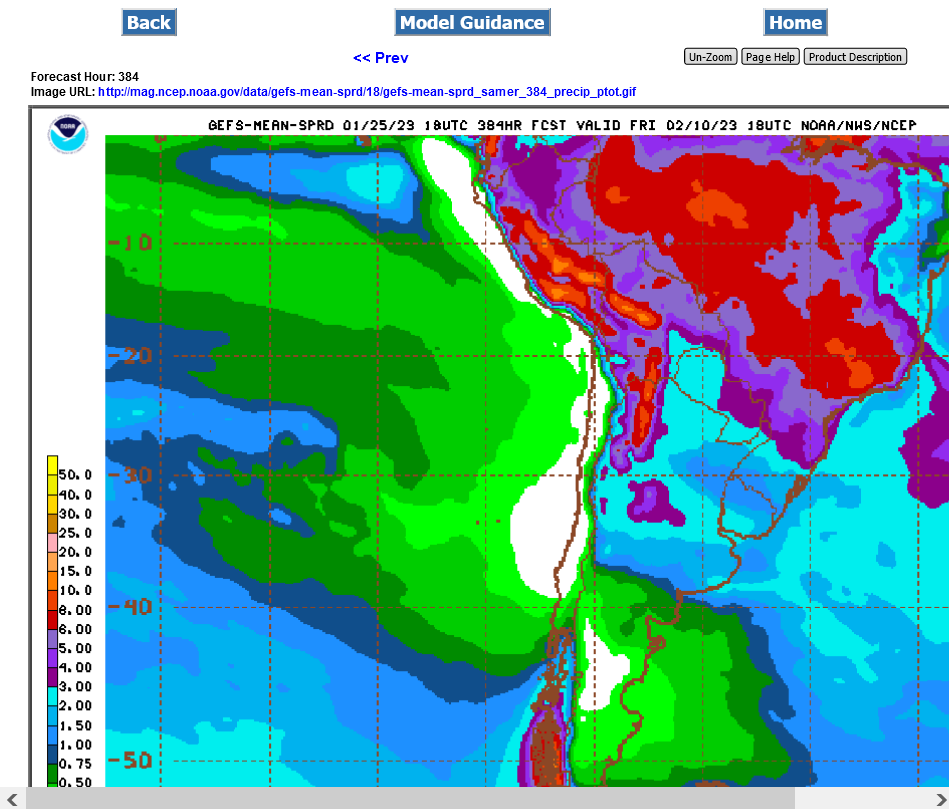
Rains in Argentina drought areas are being reduced in the forecast:
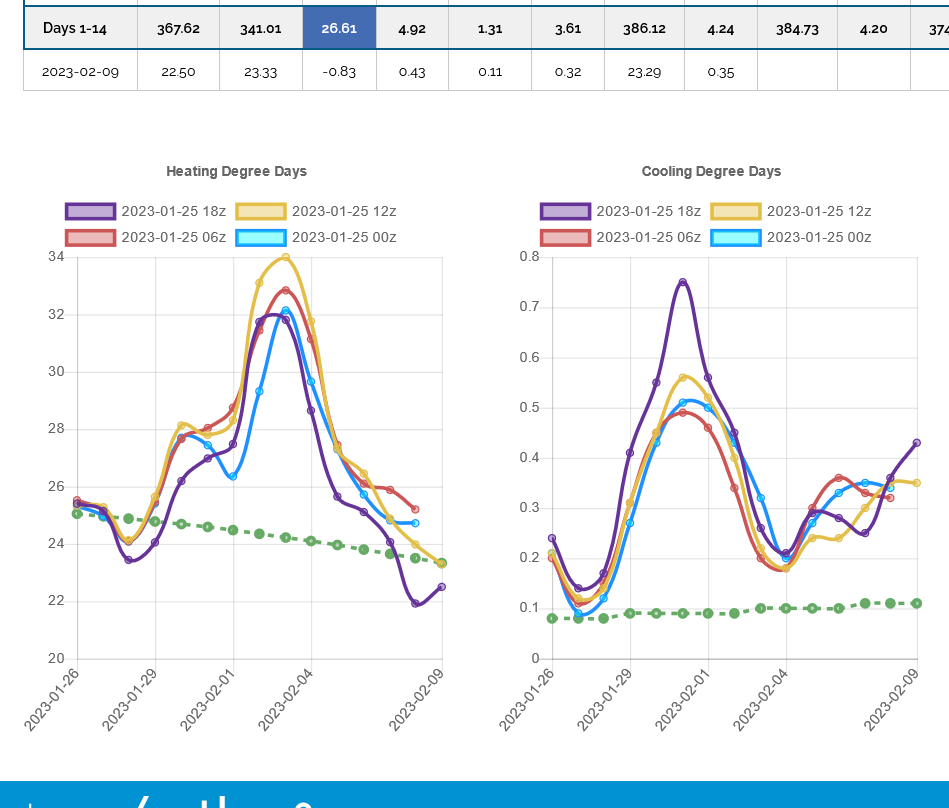
For Natural gas, the 7-9 day cold snap in the forecast gave us a brief dead cat bounce and now its back to supplies gushing in for the focus.
Last 18z GEFS was -18 HDDs