Thanks much bear!
Soilmoisture anomaly:
These maps sometimes take a day to catch up to incorporate the latest data(the bottom map is only updated once a week).
https://www.cpc.ncep.noaa.gov/products/Soilmst_Monitoring/US/Soilmst/Soilmst.shtml#
![]()


++++++++++++++++++++++++++++
https://mrcc.purdue.edu/cliwatch/watch.htm#curMonths

October 4, 2022 Below
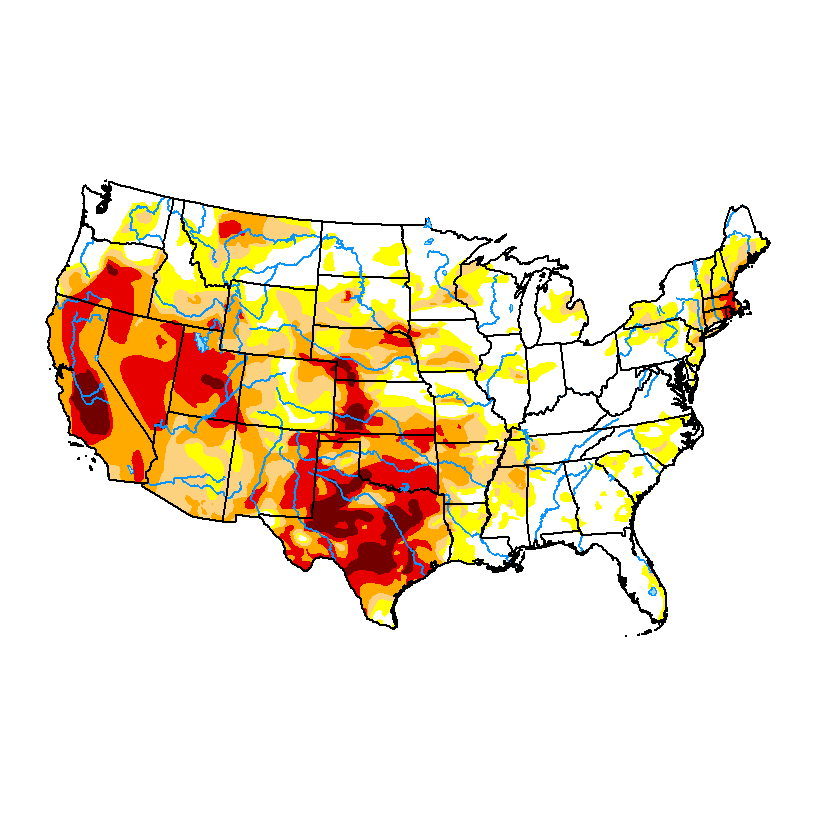
Drought worsening!!
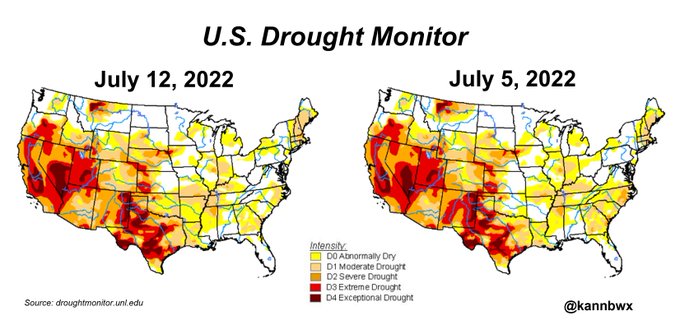
https://droughtmonitor.unl.edu/Maps/CompareTwoWeeks.aspx

AUGUST 16, 2022 BELOW
Drought is worse in the WCB compared to 3 weeks earlier
July 26, 2022-update
U.S. Drought Monitor
https://droughtmonitor.unl.edu/Maps/CompareTwoWeeks.aspx

Drought monitor previous years:
Not much help on the way!
7 Day Total precipitation below:
http://www.wpc.ncep.noaa.govcdx /qpf/p168i.gif?1530796126

Extended weather.
https://www.cpc.ncep.noaa.gov/products/predictions/610day/ | |||||||||
| 6 to 10 day outlooks | |||||||||
| Click below for information about how to read 6-10 day outlook maps Temperature Precipitation | |||||||||
| Click below for archives of past outlooks (data & graphics), historical analogs to todays forecast, and other formats of the 6-10 day outlooks ArchivesAnalogsLines-Only FormatGIS Data | |||||||||
Temperature Probability | |||||||||
Precipitation Probability | |||||||||
This is being caused by the La Nina!
The drought is being caused by the cool water anomalies in the tropical Pacific, the La Nina which has caused the 8 year global warming pause. The best thing to bust it would be global warming resuming with a planet warming El Nino!
https://www.ospo.noaa.gov/Products/ocean/sst/anomaly/index.html