KEY EVENTS TO WATCH FOR:
Wednesday, July 27, 2022
7:00 AM ET. MBA Weekly Mortgage Applications Survey
Composite Idx (previous 281.1)
Composite Idx, W/W% (previous -6.3%)
Purchase Idx-SA (previous 208)
Purchase Idx-SA, W/W% (previous -7.3%)
Refinance Idx (previous 655.7)
Refinance Idx, W/W% (previous -4.3%)
8:30 AM ET. June Advance Report on Durable Goods
Durable Goods-SA, M/M% (expected -0.4%; previous +0.7%)
Dur Goods, Ex-Defense, M/M% (previous +0.6%)
Dur Goods, Ex-Transport, M/M% (previous +0.7%)
Orders: Cap Gds, Non-Def, Ex-Air, M/M% (previous +0.5%)
Shipmnts: Cap Gds, Non-Def, Ex-Air, M/M%(previous +0.8%)
8:30 AM ET. June Advance Economic Indicators Report
10:00 AM ET. June Pending Home Sales Index
Pending Home Sales (expected -1.0; previous 99.9)
Pending Home Sales Idx, (previous +0.7%)
Pending Home Sales Idx , Y/Y% (previous -13.6%)
10:30 AM ET. EIA Weekly Petroleum Status Report
Crude Oil Stocks (Bbl) (previous 426.609M)
Crude Oil Stocks, Net Chg (Bbl) (previous -0.445M)
Gasoline Stocks (Bbl) (previous 228.435M)
Gasoline Stocks, Net Chg (Bbl) (previous +3.498M)
Distillate Stocks (Bbl) (previous 112.508M)
Distillate Stocks, Net Chg (Bbl) (previous -1.295M)
Refinery Usage (previous 93.7%)
Total Prod Supplied (Bbl/day) (previous 21.025M)
Total Prod Supplied, Net Chg (Bbl/day) (previous +2.305M)
2:00 PM ET. U.S. interest rate decision
Federal Funds Rate
Federal Funds Rate Change (Pts)
Fed Funds Rate-Range High (previous 1.75)
Fed Funds Rate-Range Low (previous 1.50)
FOMC Vote For Action (previous 10)
FOMC Vote Against Action (previous 1)
Discount Rate (previous 1.75)
Discount Rate Change (Pts) (previous +0.75)
Discount Rate-Range High
Discount Rate-Range Low
4:00 PM ET. SEC Closed Meeting
The STOCK INDEXES? http://quotes.ino.com/ex?changes/?c=indexes
The Dow closed lower due to profit taking on Tuesday as it consolidates some of the rally off July's low. The low-range close sets the stage for a steady to lower opening when Wednesday's night session begins trading. Stochastics and the RSI are overbought and are turning neutral to bearish signaling that sideways to lower prices are possible near-term. Closes below the 20-day moving average crossing at 31,293.37 would signal that a short-term top has been posted. If the Dow extends the aforementioned rally, the July 10th gap crossing at 32,267.78 is the next upside target. First resistance is the June 10th gap crossing at 32,267.78. Second resistance is June's high crossing at 33.272.34. First support is the 20-day moving average crossing at 31,293.37. Second support is July's low crossing at 30.143.93.
The September NASDAQ 100 closed lower for the third day in a row on Tuesday as it consolidates some of the rally off June's low. Today's low-range close sets the stage for a steady to lower opening when Wednesday's night session begins trading. Stochastics and the RSI have turned neutral to bearish signaling that sideways to lower prices are possible near-term. Closes below the 20-day moving average crossing at 11,993.42 would signal that a short-term top has been posted while opening the door for additional weakness near-term. If September resumes the rally off June's low, June's high crossing at 12,973.75 is the next upside target. First resistance is last-Friday's high crossing at 12,698.50. Second resistance is June's high crossing at 12,973.75. First support is the July 13th low crossing at 11,479.25. Second support is the June 30th low crossing at 11,351.00. Third support is June's low crossing at 11,092.50.
The September S&P 500 closed lower on Tuesday as it consolidates some of the rally off June's low. The low-range close sets the stage for a steady to lower opening when Tuesday's night session begins trading. Stochastics and the RSI are overbought and are turning neutral to bearish signaling that sideways to lower prices are possible near-term. Closes below the 20-day moving average crossing at 3874.11 would confirm that a short-term top has been posted. If September renews the rally off June's low, the 38% retracement level of the January-June decline crossing at 4078.81 is the next upside target. First resistance is last-Friday's high crossing at 4016.25. Second resistance is the 38% retracement level of the January-June decline crossing at 4078.81. First support is the 20-day moving average crossing at 3874.11. Second support is the July 14th low crossing at 3723.75.
INTEREST RATES? http://quotes.ino.com/ex?changes/?c=interest ""
September T-bonds closed up 21-pts. at 142-02.
September T-bonds closed higher on Tuesday. However, profit taking in the afternoon session tempered early gains and the low-range close sets the stage for a steady to modestly higher opening when Wednesday's night session begins trading. Stochastics and the RSI are neutral to bullish signaling that sideways to higher prices are possible near-term. If September extends the rally off June's low, the 38% retracement level of the 2021-2022 decline crossing at 143-28 is the next upside target. Closes below the 50-day moving average crossing at 138-03 would confirm that a short-term top has been posted while opening the door for additional weakness near-term. First resistance is today's high crossing at 143-11. Second resistance is the 38% retracement level of the 2021-2022 decline crossing at 143-28. First support is the June 11th low crossing at 136-24. Second support is the June 28th low crossing at 134-08. Third support is June's low crossing at 131-01.
September T-notes closed up 35-pts. at 119.245.
September T-notes closed higher on Tuesday as it extended the rally off last-Thursday's low. The low-range close sets the stage for a steady to modestly higher opening when Wednesday's night session begins trading. Stochastics and the RSI are neutral to bullish signaling sideways to higher prices are possible near-term. If September extends the rally off June's low, the 50% retracement level of the December-June decline crossing at 122.204 is the next upside target. Closes below last-Thursday's low crossing at 117.145 would signal that a short-term top has been posted. First resistance is May's high crossing at 120.195. Second resistance is the 50% retracement level of the December-June decline crossing at 122.204. First support is last-Thursday's low crossing at 117.145. Second support is the June 28th low crossing at 116.110.
ENERGY MARKETS? http://quotes.ino.com/ex?changes/?c=energy ""
September crude oil closed lower on Tuesday. The low-range close sets the stage for a steady to lower opening when Wednesday's night session begins. Stochastics and the RSI are neutral to bullish signaling that sideways to higher prices are possible near-term. Multiple closes above the 20-day moving average crossing at $98.77 would signal that a short-term low has been posted. If September renews the decline off June's high, the 38% retracement level of the 2021-2022 rally crossing at $86.43 is the next downside target. First resistance is the 20-day moving average crossing at $98.77. Second resistance is the 50-day moving average crossing at $104.64. First support is the July 14thlow crossing at $88.23. Second support is the 38% retracement level of the 2021-2022 rallycrossing at $86.43.
September heating oil closed higher on Tuesday while extending July's trading range. The mid-range close sets the stage for a steady to higher opening when Wednesday's night trading session begins. Stochastics and the RSI are neutral to bullish signaling that sideways to higher prices are possible near-term. Closes above the 50-day moving average crossing at 3.7936 would signal that a short-term low has been posted. If September renews the decline off June's high, the 38% retracement level of the 2021-2022 rally crossing at 3.1874 is the next downside target. First resistance is the 50-day moving average crossing at 3.7936. Second resistance is June's high crossing at $4.3703. First support is the June 6th low crossing at 3.2946. Second support is the 38% retracement level of the 2021-2022 rally crossing at 3.1874.
September unleaded gas closed lower on Tuesday. The low-range close sets the stage for a steady to lower opening when Wednesday's night session begins trading. Stochastics and the RSI are turning neutral to bullish signaling that sideways to higher prices are possible near-term. Closes above the 20-day moving average crossing at $3.2119 would signal that a short-term low has been posted. If September renews the decline off June's high, the 38% retracement level of the 2021-2022 rally crossing at 2.8073 is the next downside target. First resistance is the 20-day moving average crossing at $3.2119. Second resistance is the 50-day moving average crossing at $3.4402. First support is last-Thursday's low crossing at $3.8890. Second support is the 38% retracement level of the 2021-2022 rally crossing at 2.8073.
September Henry natural gas closed higher on Tuesday as it extends the rally off July's low. Profit taking during the afternoon session tempered early-session gains and the low-range close sets the stage for a steady to slightly higher opening when Wednesday's night session begins trading. Stochastics and the RSI are overbought but remain neutral to bullish signaling that sideways to higher prices are possible near-term. If September extends the rally off July's low, June's high crossing at 9.598 is the next upside target. Closes below the 50-day moving average crossing at 7.540 would signal that a short-term top has been posted. First resistance is today's high crossing at 9.419. Second resistance is June's high crossing at 9.598. First support is the 50-day moving average crossing at 7.540. Second support is the 20-day moving average crossing at 6.772.
CURRENCIES? http://quotes.ino.com/ex?changes/?c=currencies ""
The September Dollar closed higher on Tuesday as it consolidated some of the decline off July's high. The high-range close sets the stage for a steady to higher opening when Wednesday's nights session begins trading. Stochastics and the RSI are neutral to bearish signaling sideways to lower prices are possible near-term. Multiple closes below the 20-day moving average crossing at $106.68 would signal that a short-term top has been posted. If September renews the rally off May's low, the 87% retracement level of the 2001-2008 decline on the monthly continuation chart crossing at $114.782 is the next upside target. First resistance is July's high crossing at $109.140. Second resistance isthe 87% retracement level of the 2001-2008 decline on the monthly continuation chart crossing at $114.782. First support is last-Friday's low crossing at $105.990. Second support is the 50-day moving average crossing at $104.516.
The September Euro closed lower on Tuesday and possible marking a downside breakout of last-week's trading range. The low-range close sets the stage for a steady to lower opening when Wednesday's night session begins trading. Stochastics and the RSI are neutral to bullish signaling that sideways to higher prices are possible near-term. Closes above the July 21st high crossing at $1.03200 would signal that a low has been posted. If September renews the decline, the December-2002 low on the monthly continuation chart crossing at $0.98540 is the next downside target. First resistance is the July 21st high crossing at $1.03200. Second resistance is the 50-day moving average crossing at $1.04996. First support is the July 14th low crossing at $1.00000. Second support is the December-2002 low on the monthly continuation chart crossing at $0.98540.
The September British Pound closed slightly lower on Tuesday as it consolidates some of the rally off July's low. The mid-range close sets the stage for a steady to lower opening when Wednesday's night session begins trading. Stochastics and the RSI remain neutral to bullish signaling sideways to higher prices are possible near-term. If September extends the rally off July's low, the 50-day moving average crossing at 1.2252 is the next upside target. If September renews the decline off May's high, the March-2020 low on the monthly continuation chart crossing at 1.1438 is the next downside target. First resistance is today's high crossing at 1.2106. Second resistance is the 50-day moving average crossing at 1.2252. First support is July's low crossing at 1.1778. Second support is the March-2020 low on the monthly continuation chart crossing at 1.1438.
The September Swiss Franc closed higher on Tuesday as it extends the rally off July's low. The high-range close sets the stage for a steady to higher opening when Wednesday's night session begins trading. Stochastics and the RSI are becoming overbought but remain neutral to bullish signaling that sideways to higher prices are possible near-term. If September extends the rally off July's low, June's high crossing at 1.05910 is the next upside target. Closes below the 10-day moving average crossing at 1.03370 would signal that a short-term top has been posted. First resistance is last-Friday's high crossing at 1.04620. Second resistance is June's high crossing at 1.05910. First support is the July 14thcrossing at 1.01650. Second support is June's low crossing at 1.00235.
The September Canadian Dollar closed lower on Tuesday as it consolidates some of the rally off July's low.The low-range close sets the stage for a steady to lower opening when Wednesday's night session begins trading. Stochastics and the RSI are overbought but remain neutral to bullish signaling that sideways to higher prices are possible near-term. If September extends the aforementioned rally, the 62% retracement level of the April-July decline crossing at 78.67 is the next upside target. If September renews the decline off June's high, the October-2020 low crossing at 75.06 is the next downside target. First resistance is the June 28th high crossing at 78.02. Second resistance is the 62% retracement level of the April-July decline crossing at 78.67. First support is July's low crossing at 75.61. Second support is the October-2020 low crossing at 75.06.
The September Japanese Yen closed slightly lower on Tuesday as it consolidated some of last-Friday's rally but remains above the 20-day moving average crossing at 0.073392. The low-range close sets the stage for a steady to lower opening when Wednesday’s night session begins trading. Stochastics and the RSI are neutral to bullish signaling that sideways to higher prices are possible near-term. If September extends the rally off July's low, the 50-day moving average crossing at 0.075293 is the next upside target. If September renews the decline off May's high, the August-1998 low on the monthly continuation chart crossing at 0.068730 is the next downside target. First resistance is last-Friday's high crossing at 0.074075. Second resistance is the 50-day moving average crossing at 0.075397. First support is July's low crossing at 0.072085. Second support is the August-1998 low on the monthly continuation chart crossing at 0.068730.
PRECIOUS METALS? http://quotes.ino.com/ex?changes/?c=metals ""
August gold closed lower on Tuesday. The low-range close sets the stage for a steady to lower opening when Wednesday's night session begins trading. Stochastics and the RSI are neutral to bullish signaling that sideways to higher prices are possible near-term. Closes above the 20-day moving average crossing at $1741.40 would confirm that a low has been posted while opening the door for additional gains near-term. If August renews the decline off June's high, the March-2021 low on the monthly continuation chart crossing at $1673.30 is the next downside target. First resistance is the 20-day moving average crossing at $1741.40. Second resistance is the 50-day moving average crossing at $1802.30. First support is last-Thursday's low crossing at $1678.40. Second support is the March-2021 low on the monthly continuation chart crossing at $1673.30.
September silver posted a quiet inside day with a higher close on Tuesday as it extends July's trading range. The high-range close sets the stage for a steady to higher opening when Wednesday's night session begins trading. Stochastics and the RSI are neutral to bullish signaling that sideways to higher prices are possible near-term. If September extends the decline off March's high, the June-2020 low on the weekly continuation chart crossing at 17.015 is the next downside target. Closes above the 20-day moving average crossing at 19.142 would signal that a short-term low has been posted. First resistance is the 20-day moving average crossing at 19.142. Second resistance is the 50-day moving average crossing at 20.721. First support is the July 14th low crossing at 18.010. Second support is the June-2020 low on the weekly continuation chart crossing at 17.015.
September copper closed slightly higher on Tuesday. The low-range close sets the stage for a steady to lower opening when Wednesday's night session begins trading. Stochastics and the RSI are neutral to bullish signaling that sideways to higher prices are possible near-term. Closes above the 20-day moving average crossing at 3.4313 would signal that a short-term low has been posted. If July renews the decline off June's high, the 75% retracement level of the 2020-2021 rally crossing at 2.8770 is the next downside target. First resistance is the 20-day moving average crossing at 3.4313. Second resistance is the June 28th high crossing at 3.8500. First support is the July 15th low crossing at 3.1315. Second support is the 75% retracement level of the 2020-2021 rally crossing at 2.8770.
GRAINS? http://quotes.ino.com/ex?changes/?c=grains "
December Corn closed up $0.17-cents at $6.00 3/4.
December corn gapped up and closed higher on Tuesday following Monday's crop conditions report that showed a 3% decline in the good/excellent ratings across the Midwest. The high-range close sets the stage for a steady to higher opening when Wednesday's night session begins trading. Stochastics and the RSI are oversold but are turning neutral to bullish signaling that sideways to higher prices are possible near-term. Closes above last-Monday's high crossing at $6.23 3/4 would signal that a short-term low has been posted. If December resumes the decline off May's high, the 62% retracement level of the 2020-2022 rally crossing at $5.20 3/4 is the next downside target. First resistance is last-Monday's high crossing at $6.23 3/4. Second resistance is the June 11th high crossing at $6.58 1/2. First support is the 50% retracement level of the 2020-2022 rally crossing at $5.74 3/4. Second support is the 62% retracement level of the 2020-2022 rally crossing at $5.20 3/4.
September wheat closed up $0.33 3/4-cents at $8.03 3/4.
September wheat closed higher on Tuesday as it consolidated some of the decline off May's high. The high-range close sets the stage for a steady to higher opening when Wednesday's night session begins trading. Stochastics and the RSI are oversold but remain neutral to bearish signaling that sideways to lower prices are possible near-term. If September extends the decline off May's high, the 75% retracement level of the January-May rally crossing at $7.23 is the next downside target. Closes above last-Wednesday's high crossing at $8.43 1/2 would signal that a short-term low has been posted. First resistance last-Wednesday's high crossing at $8.43 1/2. Second resistance is the July 11th high crossing at $9.40 1/4. First support is last-Friday's low crossing at $7.54. Second support is the 75% retracement level of the January-May's rally crossing at $7.23.
September Kansas City Wheat closed up $0.37 1/4-cents at $8.84 1/4.
September Kansas City wheat closes higher on Tuesday as it consolidated some of the decline off May's high. The high-range close sets the stage for a steady to higher opening when Wednesday's night session begins trading. Stochastics and the RSI are oversold but remain neutral to bearish signaling that sideways to lower prices are possible near-term. If September extends the decline off May's high, February's low crossing at $7.64 1/2 is the next downside target. Closes above the 20-day moving average crossing at $8.86 3/4 would signal that a short-term low has been posted. First resistance is the 20-day moving average crossing at $8.86 3/4. Second resistance is the July 11th high crossing at $9.98 1/4. First support is last-Friday's low crossing at $8.14 1/2. Second support is February's low crossing at $7.64 1/2.
September Minneapolis wheat closed up $0.44 3/4-cents at $9.28 3/4.
September Minneapolis wheat closed sharply higher on Tuesday as it consolidated some of the decline off May's high. The high-range close sets the stage for a steady to higher opening when Wednesday's night session begins trading. Stochastics and the RSI are oversold but remain neutral to bearish signaling that sideways to lower prices are possible near-term. If September extends the decline off May's high, the 75% retracement level of the January-May rally crossing at $8.12 3/4 is the next downside target. Closes above last-Wednesday's high crossing at $9.56 would signal that a short-term low has been posted. First resistance is last-Wednesday's high crossing at $9.56. Second resistance is the July 11th high crossing at $9.56. First support is last-Friday's low crossing at $8.69 1/4. Second support is the 75% retracement level of the January-May rally crossing at $8.12 3/4.
SOYBEAN COMPLEX? http://quotes.ino.com/ex?changes/?c=grains "
November soybeans closed up $0.37 3/4-cents at $13.83 3/4.
November soybeans gapped up and closed higher on Tuesday due to a decline in Monday's crop conditions report. The high-range close sets the stage for a steady to higher opening when Wednesday's night session begins trading. Stochastics and the RSI are oversold have turned neutral to bullish signaling that sideways to higher prices are possible near-term. Today's close above the 20-day moving average crossing at $13.69 1/4 signals that a short-term low has been posted. If November extends the rally off last-Friday's low, the July 11th high crossing at $14.38 1/2 is the next upside target. Closes below the 10-day moving average crossing at $13.44 1/2 would temper the near-term friendly outlook. If November resumes the decline off June's high, the 50% retracement level of the 2020-2022 rally crossing at $12.11 1/2 is the next downside target. First resistance is last-Monday's high crossing at $13.93. Second resistance is the July 11th high crossing at $14.38 1/2. First support is the 38% retracement level of the 2020-2022 rally crossing at $12.99 1/4. Second support is January's low crossing at $12.76.
December soybean meal closed up $18.70 at $417.80.
December soybean meal closed sharply higher for the second day in a row on Tuesday. The high-range close sets the stage for a steady to higher opening when Wednesday's night session begins trading. Stochastics and the RSI are bullish signaling that sideways to higher prices are possible near-term. Closes above May's high crossing at $419.20 would mark an upside breakout of the May-July trading range and open the door for additional gains near-term. Closes below the 20-day moving average crossing at $395.20 would temper the near-term friendly outlook. First resistance is May's high crossing at $419.20. Second resistance is the April 21st high crossing at $429.60. First support is July's low crossing at $375.30. Second support is the 50% retracement level of the 2020-2022 rally crossing at $365.40.
December soybean oil closed up 40-pts. at 57.95.
December soybean oil closed higher on Tuesday as it extends July's trading range. The low-range close sets the stage for a steady to slightly higher opening when Wednesday's night session begins trading. Stochastics and the RSI are neutral to bullish signaling that sideways to higher prices are possible near-term. If December extends the decline off June's high, the 50% retracement level of the 2020-2022 rally crossing at 53.93 is the next downside target. Closes above the July 5th gap crossing at 62.01 would signal that a short-term low has been posted. First resistance the July 5th gap crossing at 62.01. Second resistance is the June 29th high crossing at 67.76. First support is July's low crossing at 54.42. Second support is the 50% retracement level of the 2020-2022 rally crossing at 53.93.
LIVESTOCKhttp://quotes.ino.com/exchanges/?c=livestock
August hogs closed down $0.23 at $117.00.
August hogs closed lower on Tuesday as it consolidated some of the rally off June's low. The mid-range close sets the stage for a steady to lower opening when Wednesday's session begins trading. Stochastics and the RSI are overbought but remain neutral to bullish signaling that sideways to higher prices are possible near-term. If August extends the aforementioned rally, April's high crossing at $121.25 is the next upside target. Closes below the 20-day moving average crossing at $110.13 would signal that a short-term top has been posted. First resistance is last-Friday's high crossing at $118.90. Second resistance is April's high crossing at $121.25. First support is the 10-day moving average crossing at $113.90. Second support is the 20-day moving average crossing at $110.13.
October cattle closed down $0.95 at $142.40
October cattle posted an inside day with a lower close on Tuesday as it consolidated some of the rally off July's low. The low-range close sets the stage for a steady to lower opening on Tuesday. Stochastics and the RSI are overbought but remain neutral to bullish signaling that sideways to higher prices are possible near-term. If October extends the rally off June's low, May's high crossing at $145.10 is the next upside target. Closes below the 50-day moving average crossing at $140.06 would confirm that a short-term top has been posted. First resistance is May's high crossing at $145.10. Second resistance is the top of the April 25th gap crossing at $145.98. First support is the July 15th low crossing at $139.30. Second support is July's low crossing at $138.03.
September Feeder cattle closed down $2.75 at $179.93.
September Feeder cattle closed lower on Tuesday as it consolidated some of the rally off May's low. The low-range close sets the stage for a lower opening when Wednesday's session begins trading. Stochastics and the RSI are overbought diverging and are turning neutral to bearish signaling that sideways to lower prices are possible near-term. Close below last-Monday's low crossing at $178.10 would signal that a short-term top has been posted. If September extends this month's rally, February's high crossing at $188.25 is the next upside target. First resistance is last-Friday's high crossing at $184.90. Second resistance is February's high crossing at $188.25. First support is last-Monday's low crossing at $178.10. Second support is the 50-day moving average crossing at $175.34.
FOOD & FIBERhttp://quotes.ino.com/ex changes/?c=food
September coffee closed higher on Tuesday. The high-range close sets the stage for a steady to higher opening on Wednesday. Stochastics and the RSI have turned neutral to bullish signaling that sideways to higher prices are possible. If September renews the decline off June's high, the 50% retracement level of the 2020-2021 rally crossing at $18.41 is the next downside target. Closes above the 50-day moving average crossing at $22.22 would signal that a short-term low has been posted. First resistance is the 50-day moving average crossing at $22.22. Second resistance is July's high crossing at $22.90. First support is July's low crossing at $19.60. Second support is the 50% retracement level of the 2020-2021 rally crossing at $18.41.
September cocoa closed higher on Tuesday as it extends the rally off July's low. The high-range close sets the stage for a steady to higher opening on Wednesday. Stochastics and the RSI have turned neutral to bullish signaling sideways to higher prices are possible near-term. If September extends the rally off July's low, the 50-day moving average crossing at 24.14 is the next upside target. If September renews the decline off April's high, the July-2021 low crossing at 22.32 is the next downside target.
October sugar closed unchanged on Tuesday as it consolidates some of this month's decline. The low-range close sets the stage for a steady to lower opening on Wednesday. Stochastics and the RSI are oversold but remain neutral to bearish signaling that sideways to lower prices are possible near-term. If October extends this month's decline, the 38% retracement level of the 2020-2022 rally crossing at 16.88 is the next downside target. Closes above the 20-day moving average crossing at 18.50 would signal that a short-term low has been posted.
December cotton closed sharply higher on Tuesday as it extends the rally off July's low. The high-range close sets the stage for a steady to higher opening on Wednesday. Stochastics and the RSI are neutral to bearish signaling that sideways to lower prices are possible near-term. Today's close above the 20-day moving average crossing at 92.45 signals that a short-term low has been posted. If December extends this month's rally, the June 30th high crossing at 99.49 is the next upside target. If December extends the decline off May's high, the 75% retracement level of the 2020-2022 rally crossing at 74.58 is the next downside target.
Thanks tallpine!
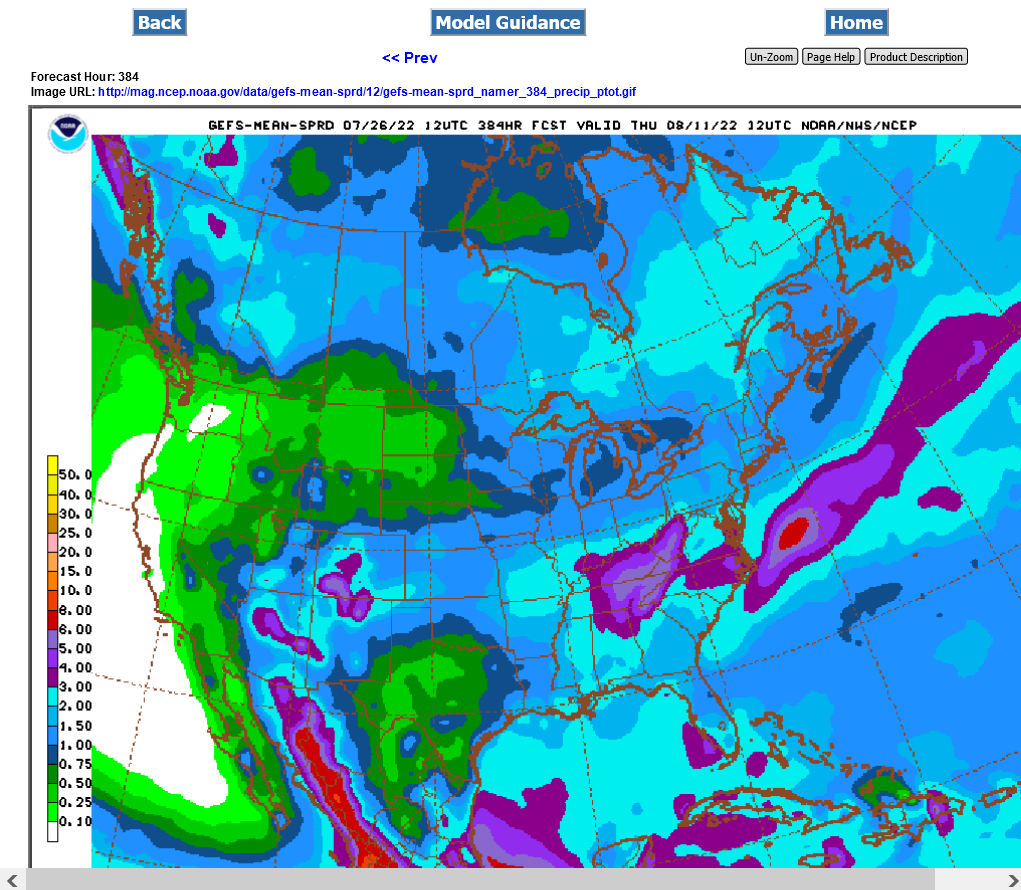
Weather is still bullish.
The heat ridge backs up a bit late in week 2 but that might mainly just make things LESS hot and not really bring a great deal of rain during the first half of August.
However, the GFS keeps trying to sneak in some ridge riders late in the period with rains in the Upper Midwest.
Beans might have the greatest potential upside if August stays dry.
This looks like more rain then will probably fall for the northern half of the cornbelt.
The big rains in the southern half are all this week.
The Southern cornbelt will not need rains for a couple of weeks after this week. It's actually going to be too wet in some places!
7 Day Total precipitation below:
http://www.wpc.ncep.noaa.govcdx /qpf/p168i.gif?1530796126

See the rest of the weather by scrolling down here:
https://www.marketforum.com/forum/topic/83844/