KEY EVENTS TO WATCH FOR:
Monday, July 18, 2022
10:00 AM ET. July NAHB Housing Market Index
Housing Mkt Idx (previous 67)
4:00 PM ET. May Treasury International Capital Data
Tuesday, July 19, 2022
8:30 PM ET. June New Residential Construction - Housing Starts and Building Permits
Total Starts (previous 1.549M)
Housing Starts, M/M% (previous -14.4%)
Building Permits (previous 1.695M)
Building Permits, M/M% (previous -7.0%)
8:55 AM ET. Johnson Redbook Retail Sales Index
Ret Sales Mo-to-Date, M/M%
Ret Sales Mo-to-Date, Y/Y%
Latest Wk, Y/Y%
4:30 PM ET. API Weekly Statistical Bulletin
Crude Stocks, Net Chg (Bbls)
Gasoline Stocks, Net Chg (Bbls)
Distillate Stocks, Net Chg (Bbls)
Wednesday, July 20, 2022
7:00 AM ET. MBA Weekly Mortgage Applications Survey
Composite Idx (previous 300)
Composite Idx, W/W% (previous -1.7%)
Purchase Idx-SA (previous 224.3)
Purchase Idx-SA, W/W% (previous -3.6%)
Refinance Idx (previous 685.3)
Refinance Idx, W/W% (previous +2.2%)
10:00 AM ET. June Existing Home Sales
Existing Sales (previous 5.41M)
Existing Sales, M/M% (previous -3.4%)
Unsold Homes Month's Supply (previous 2.6)
Median Price (USD) (previous 407600)
Median Home Price, Y/Y% (previous +14.8%)
10:30 AM ET. EIA Weekly Petroleum Status Report
Crude Oil Stocks (Bbl) (previous 427.054M)
Crude Oil Stocks, Net Chg (Bbl) (previous +3.254M)
Gasoline Stocks (Bbl) (previous 224.937M)
Gasoline Stocks, Net Chg (Bbl) (previous +5.825M)
Distillate Stocks (Bbl) (previous 113.803M)
Distillate Stocks, Net Chg (Bbl) (previous +2.668M)
Refinery Usage (previous 94.9%)
Total Prod Supplied (Bbl/day) (previous 18.72M)
Total Prod Supplied, Net Chg (Bbl/day) (previous -1.744M)
Thursday, July 21, 2022
8:30 AM ET. July Philadelphia Fed Business Outlook Survey
Business Activity (previous -3.3)
Prices Paid (previous 64.5)
Employment (previous 28.1)
New Orders (previous -12.4)
Prices Received (previous 49.2)
Delivery Times (previous 9.9)
Inventories (previous -2.2)
Shipments (previous 10.8)
8:30 AM ET. Unemployment Insurance Weekly Claims Report - Initial Claims
Jobless Claims (previous 244K)
Jobless Claims, Net Chg (previous +9K)
Continuing Claims (previous 1331000)
Continuing Claims, Net Chg (previous -41K)
8:30 AM ET. U.S. Weekly Export Sales
Corn (Metric Tons) (previous 407.2K)
Soybeans (Metric Tons) (previous -248.9K)
Wheat (Metric Tons) (previous 1047.2K)
10:00 AM ET. June Leading Indicators
Leading Index, M/M% (previous -0.4%)
Leading Index
Coincident Index, M/M% (previous +0.2%)
Lagging Index, M/M% (previous +0.8%)
10:30 AM ET. EIA Weekly Natural Gas Storage Report
Working Gas In Storage (Cbf) (previous 2369B)
Working Gas In Storage, Net Chg (Cbf) (previous +58B)
4:30 PM ET. Federal Discount Window Borrowings
4:30 PM ET. Foreign Central Bank Holdings
Friday, July 22, 2022
9:45 AM ET. July US Flash Manufacturing PMI
PMI, Mfg (previous 52.4)
9:45 AM ET. July US Flash Services PMI
PMI, Services (previous 51.6)
10:00 AM ET. June State Employment and Unemployment
The STOCK INDEXES? http://quotes.ino.com/ex?changes/?c=indexes
The STOCK INDEXES: The September NASDAQ 100 was higher overnight as it extends the trading range of the past four-weeks.The high-range overnight trade sets the stage for a steady to higher opening when the day session begins trading. Stochastics and the RSI are neutral to bullish signaling that sideways to higher prices are possible near-term. Closes above the 50-day moving average crossing at 12,054.93 would open the door for additional gains and a possible test of June's high crossing at 12,973.75. Closes below last-Wednesday's low crossing at 11,479.25 would temper the near-term friendly outlook while opening the door for a test of June's low crossing at 11,068.50. First resistance is the 50-day moving average crossing at 12,054.93. Second resistance is June's high crossing at 12,973.75. First support is the June 30th low crossing at 11,351.00. Second support is June's low crossing at 11,068.50.
The September S&P 500 was higher overnight and sets the stage for a steady to higher opening when the day session begins trading. Stochastics and the RSI are turning neutral to bullish signaling that sideways to higher prices are possible near-term. Closes above the 50-day moving average crossing at 3930.12 would mark an upside breakout of the June-July trading range while opening the door for additional gains near-term. Closes below last-Thursday's low crossing at 3723.75 would signal that a short-term top has been posted while opening the door for a possible test of June's low crossing at 3642.00. First resistance is the 50-day moving average crossing at 3930.12. Second resistance is the May 31st high crossing at 4204.75. First support is last-Thursday's low crossing at 3723.75. Second support is June's low crossing at 3642.00.
INTEREST RATES http://quotes.ino.com/ex changes/?c=interest"
INTEREST RATES: September T-bonds were steady to slightly lower overnight. The low-range overnight trade sets the stage for a steady to lower opening when the day session begins trading. Stochastics and the RSI are neutral signaling that sideways trading is possible near-term. If September renews the rally off June's low, the 38% retracement level of the 2021-2022 decline crossing at 143-25 is the next upside target. Closes below last-Monday's low crossing at 136-24 would signal that a short-term top has been posted. First resistance is the July 6th high crossing at 142-06. Second resistance is the 38% retracement level of the 2021-2022 decline crossing at 143-25. First support is last-Monday's low crossing at 136-24. Second support is June's low crossing at 131-01.
September T-notes was steady to slightly lower overnight and sets the stage for a steady to lower opening when the day session begins trading. Stochastics and the RSI are neutral signaling that sideways trading is possible near-term. Closes below the July 8th low crossing at 117.180 would open the door for additional weakness near-term. If September renews the rally off June's low, the 50% retracement level of the 2021-2022 decline crossing at 122.204 is the next upside target. First resistance is May's high crossing at 120.195. Second resistance is the 50% retracement level of the 2021-2022 decline crossing at 122.204 is the next downside target. First support is the July 8th low crossing at 117.180. Second support is the June 28th low crossing at 116.110.
ENERGY MARKETS? http://quotes.ino.com/ex?changes/?c=energy ""
ENERGIES:August crude oil was higher overnight as it consolidates some of the decline off June's high. Overnight trading sets the stage for a higher opening when the day session begins trading. Stochastics and the RSI are turning neutral to bullish signaling that sideways to higher prices are possible near-term. Closes above the 20-day moving average crossing at $103.77 would signal that a short-term low has been posted. If August extends the decline off June's high, the 38% retracement level of the 2020-2022 rally crossing at $88.16 is the next downside target. First resistance is the 10-day moving average crossing at $99.44. Second resistance is the 20-day moving average crossing at $103.77. First support is last-Thursday's low crossing at $90.56. Second support is the 38% retracement level of the 2020-2022 rally crossing at $88.16.
August heating oil was steady to higher overnight and sets the stage for a higher opening when the day session begins trading. Stochastics and the RSI are neutral to bullish signaling that sideways to higher prices are possible near-term. Closes above the 20-day moving average crossing at $3.8838 would signal that a short-term low has been posted. If August renews the decline off June's high, the 38% retracement level of the 2020-2022 rally crossing at $3.2689 is the next downside target. First resistance is the 20-day moving average crossing at $3.8838. Second resistance is the July 1st high crossing at $4.0264. First support is the July 6th low crossing at $3.3510. Second support is the 38% retracement level of the 2020-2022 rally crossing at 3.2689.
August unleaded gas was higher overnight and sets the stage for a steady to higher opening when the day session begins trading. Stochastics and the RSI are oversold but remain neutral to bearish signaling that sideways to lower prices are possible near-term. If August extends the decline off June's high, the April 25th low crossing at 2.9974 is the next downside target. Closes above the 50-day moving average crossing at 3.6251 would signal that a short-term low has been posted. First resistance is the 10-day moving average crossing at 3.3076. Second resistance is the 20-day moving average crossing at $3.5078. First support is the April 25th low crossing at 2.9974. Second support is the 38% retracement level of the 2020-2022 rally crossing at 2.9354.
August Henry natural gas was higher overnight and sets the stage for a steady to higher opening when the day session begins trading. Stochastics and the RSI are overbought but remain neutral to bullish signaling that sideways to higher prices are possible near-term. If August extends the aforementioned rally, the 50-day moving average crossing at 7.545 is the next upside target. Closes below the 10-day moving average crossing at 6.343 would signal that a short-term top has been posted. If August resumes the decline off June's high, the 62% retracement level of 2020-2022 rally crossing at 5.067 is the next downside target. First resistance is the 50-day moving average crossing at 7.545. Second resistance is the June 16th high crossing at 7.981. First support is the 62% retracement level of the 2020-2022 rally crossing at 5.067. Second support is the 75% retracement level of the 2020-2022 rally crossing at 4.083.
CURRENCIEShttp://quotes.ino.com/ex changes/?c=currencies"
CURRENCIES:The September Dollar was lower overnight and sets the stage for a lower opening when the day session begins trading. Stochastics and the RSI are turning neutral to bearish signaling that sideways to lower prices are possible near-term. Closes below the 20-day moving average crossing at $105.873 would signal that a short-term top has been posted. If September extends this year's rally, the 87% retracement level of the 2001-2008 decline on the monthly continuation chart crossing at $114.782 is the next upside target.First resistance is last-Thursday's high crossing at $109.140. Second resistance is the 87% retracement level of the 2001-2008 decline on the monthly continuation chart crossing at $114.782. First support is the 10-day moving average crossing at $107.401. Second support is the 20-day moving average crossing at $105.873.
The September Euro was higher overnight as it extends the rally off last-Thursday's low. The high-range overnight trade sets the stage for a steady to higher opening when the day session begins trading. Stochastics and the RSI are turning neutral to bullish signaling that sideways to higher prices are possible near-term. If September renews the decline off May's high, the December 2002 low on the monthly continuation chart crossing at $0.98540 is the next downside target. Closes above the 20-day moving average crossing at $1.03722 would signal that a short-term low has been posted. First resistance is the 20-day moving average crossing at $1.03722. Second resistance is the 50-day moving average crossing at $1.05425. First support is last-Thursday's low crossing at $1.00000. Second support is the December 2002 low on the monthly continuation chart crossing at $0.98540.
The September British Pound was higher overnight and sets the stage for a higher opening when the day session begins trading. Stochastics and the RSI are turning neutral to bullish signaling that sideways to higher prices are possible near-term. Closes above the 20-day moving average crossing at 1.2088 would signal that a short-term low has been posted. If September extends this year's decline, the March-2020 low on the monthly continuation chart crossing at 1.1438 is the next downside target. First resistance is the 20-day moving average crossing at 1.2088. Second resistance is the 50-day moving average crossing at 1.2288. First support is last-Thursday's low crossing at 1.1778. Second support is the March-2020 low on the monthly continuation chart crossing at 1.1438.
The September Swiss Franc was slightly higher overnight as it consolidates some of the decline off June's high. The low-range overnight trade sets the stage for a slightly higher opening when the day session begins trading. Stochastics and the RSI are oversold and are turning neutral to bullish signaling that sideways to higher prices are possible near-term. Closes above the 20-day moving average crossing at 1.03815 would signal that a short-term low has been posted. If September extends the decline off June's high, the 87% retracement level of June's rally crossing at 1.00974 is the next downside target. First resistance is the 20-day moving average crossing at 1.03815. Second resistance is June's high crossing at 1.05910. First support is the 75% retracement level of June's rally crossing at 1.01656. Second support is the 87% retracement level of June's rally crossing at 1.00974.
The September Canadian Dollar was higher overnight as it consolidates some of the decline off June's high. The high-range overnight trade sets the stage for a higher opening when the day session begins trading. Stochastics and the RSI are neutral to bullish signaling that sideways to higher prices are possible near-term. Closes above the 50-day moving average crossing at $77.70 would signal that a short-term low has been posted. If September extends the decline off June's high, the 62% retracement level of the 2020-2021 rally crossing at $75.09 is the next downside target. First resistance is the 50-day moving average crossing at $77.70. Second resistance is the June 28th high crossing at $78.02. First support is the 50% retracement level of the 2020-2021 rally crossing at $75.79. Second support is the 62% retracement level of the 2020-2021 rally crossing at $75.09.
The September Japanese Yen was steady to slightly higher overnight as it consolidates some of last-Thursday's decline. Overnight trading sets the stage for a steady to higher opening when the day session begins trading. Stochastics and the RSI are oversold but remain neutral to bearish signaling that sideways to lower prices are possible near-term. If September extends the decline off May's high, the August-1998 low on the monthly continuation chart crossing at 0.068730 is the next downside target. Closes above the 20-day moving average crossing at 0.073706 would signal that a short-term low has been posted. First resistance is the 20-day moving average crossing at 0.073706. Second resistance is the 50-day moving average crossing at 0.075812. First support is last-Thursday's low crossing at 0.072085. Second support is the September-1990 low on the monthly continuation chart crossing at 0.072160.
PRECIOUS METALS http://quotes.ino.com/ex changes/?c=metals"
PRECIOUS METALS: Augustgold was slightly higher overnight and sets the stage for a higher opening when the day session begins trading. Stochastics and the RSI are oversold but remain neutral to bearish signaling that sideways to lower prices are possible near-term. If August extends the decline off June's high, the March-2021 low on the monthly continuation chart crossing at $1673.30 is the next downside target. Closes above the 20-day moving average $1777.40 would signal that a short-term low has been posted. First resistance is the 10-day moving average $1729.70. Second is the 20-day moving average crossing at $1777.40. First support is last-Thursday's low crossing at $1695.00. Second support is the March-2021 low on the monthly continuation chart crossing at $1673.30.
September silver was steady to slightly higher overnight as it consolidates some of last-Thursday's decline. The mid-range trade sets the stage for a steady to higher opening when the day session begins trading later this morning. Stochastics and the RSI are oversold but remain neutral to bearish signaling that sideways to lower prices are possible near-term. If September extends the decline off March's high, the June-2020 low on the weekly continuation chart crossing at $17.015 is the next downside target. Closes above the 20-day moving average crossing at $19.983 would signal that a short-term low has been posted. First resistance is last-Wednesday's high crossing at $19.360. Second resistance is the 20-day moving average crossing at 19.983. First support is last-Thursday's low crossing at $18.010. Second support is the June-2020 low on the weekly continuation chart crossing at $17.015.
September copper was higher overnight as it consolidates some of the decline off March's high. Overnight trading sets the stage for a higher opening when the day session begins trading. Stochastics and the RSI are oversold but remain neutral to bearish signaling that sideways to lower prices are possible near-term. If September extends the decline off June's high, the 75% retracement level of the 2020-2022 rally crossing at 2.8770 is the next downside target. Closes above the 20-day moving average crossing at 3.5933 would signal that a short-term low has been posted. First resistance is the 10-day moving average crossing at 3.3705. Second resistance is the 20-day moving average crossing at 3.5933. First support is last-Friday's low crossing at 3.1315. Second support is the 75% retracement level of the 2020-2022 rally crossing at 2.8770.
GRAINS http://quotes.ino.com/ex changes/?c=grains
December corn was higher overnight as it consolidates some of last-week's decline. Overnight trading sets the stage for a higher opening when the day sessions begins trading. Stochastics and the RSI are neutral to bullish signaling that sideways to higher prices are possible near-term. Closes above the 20-day moving average crossing at $6.32 3/4 would signal that a short-term low has been posted while opening the door for additional gains near-term. If December renews the decline off June's high, the 62% retracement level of the 2020-2022 rally crossing at $5.20 3/4 is the next downside target. First resistance is the 20-day moving average crossing at $6.32 3/4. Second resistance is last-Monday's high crossing at $6.58 1/2. First support is the 50% retracement level of the 2020-2022 rally crossing at $5.74 3/4. Second support is the January low crossing at $5.42 1/2.
September wheat was higher overnight as it consolidates some of the decline off last-Monday's high. Overnight trading sets the stage for a higher opening when the day session begins trading. Stochastics and the RSI are oversold but remain neutral to bearish signaling that sideways to lower prices are possible near-term. If September extends the decline off May's high, the 75% retracement level of the January-May high crossing at $7.23 is the next downside target. Closes above the 20-day moving average crossing at $8.80 would signal that a short-term low has been posted. First resistance is the 20-day moving average crossing at $8.80. Second resistance is last-Monday's high crossing at $9.40 1/4. First support is the last-Friday's low crossing at $7.65 3/4. Second support is the 75% retracement level of the January-May high crossing at $7.23.
September Kansas City wheat was higher overnight as it consolidates some of the decline off last-Monday's high. Overnight trading sets the stage for a steady to higher opening when the day session begins trading later this morning. Stochastics and the RSI are oversold but remain neutral to bearish signaling that sideways to lower prices are possible near-term. If September extends the decline off May's high, February's low crossing at $7.64 1/2 the next downside target. Closes above last-Monday's high crossing at $9.98 1/4 would signal that a short-term low has been posted. First resistance is the 20-day moving average crossing at $9.38. Second resistance is last-Monday's high crossing at $9.98 1/4. First support is the 62% retracement level of the January-May rally crossing at $8.32 3/4. Second support is the February's low crossing at $7.64 1/2.
September Minneapolis wheat was higher overnight as it consolidates some of the decline off last-Monday's high. Overnight trading sets the stage for a steady to higher opening when the day session begins trading. Stochastics and the RSI are neutral signaling that sideways to lower prices are possible near-term. If September renews the decline of May's high, the 75% retracement level of the January-May rally crossing at $8.12 3/4 is the next downside target. Closes above last-Monday's high crossing at $10.44 1/2 would confirm that a short-term low has been posted. First resistance is the 20-day moving average crossing at $9.91. Second resistance is last-Monday's high crossing at $10.44 1/2. First support is the July 6th low crossing at $8.70 1/2. Second support is the 75% retracement level of the January-May high crossing at $8.12 3/4.
SOYBEAN COMPLEX? http://quotes.ino.com/ex?changes/?c=grains "
November soybeans was higher overnight as it consolidates some of the decline off last-Monday's high. Overnight trading sets the stage for a higher opening when the day session begins trading. Stochastics and the RSI are neutral to bearish signaling that sideways to lower prices are possible near-term. If November resumes the decline off June's high, the 38% retracement level of the crossing at $12.99 1/4 is the next downside target. If November renews the rally off last-Wednesday's low, the 20-day moving average crossing at $14.06 3/4 is the next upside target. First resistance is the 20-day moving average crossing at $14.06 3/4. Second resistance is last-Monday's high crossing at $14.38 1/2. First support is the 38% retracement level of the 2020-2022 rally crossing at $12.99 1/4. Second support is January's low crossing at $12.74.
December soybean meal was steady to higher overnight as it consolidates some of last-Friday's decline. The high-range trade overnight sets the stage for a higher opening when the day session begins trading. Stochastics and the RSI are neutral signaling that sideways trading is possible near-term. If December renews the rally off July's low, June's high crossing at $418.00 is the next upside target. If December renews the decline off Monday's high, July's low crossing at $375.30 is the next downside target. First resistance is June's high crossing at $418.00. Second resistance is April's high crossing at $419.10. First support is July's low crossing at $375.30. Second support is the 50% retracement level of the 2020-2022 rally crossing at $365.40.
December soybean oil was higher overnight as it consolidates some of the decline off last-Monday's high. The high-range overnight trade sets the stage for a higher opening when the day session begins trading. Stochastics and the RSI are turning neutral to bullish signaling that sideways to higher prices are possible near-term. Closes above last-Monday's high crossing at 62.65 would signal that a short-term low has been posted. If December extends this month's decline, the 50% retracement level of the 2020-2022 rally crossing at 53.93 is the next downside target. First resistance is last-Monday's high crossing at 62.65. Second resistance is the June 29th high crossing at 67.76. First support is last-Thursday's low crossing at 54.42. Second support is the 50% retracement level of the 2020-2022 rally crossing at 53.93.
Thanks tallpine!
Weather is bullish for grains, especially the WCB but not that much more bullish than Friday.
The heat ridge is far enough west that the most intense heat will be west of where the most people like in East and South but even there it will be VERY warm to make it bullish for NG.
Crude is up sharply which is giving everything a huge boost higher than where it would be.
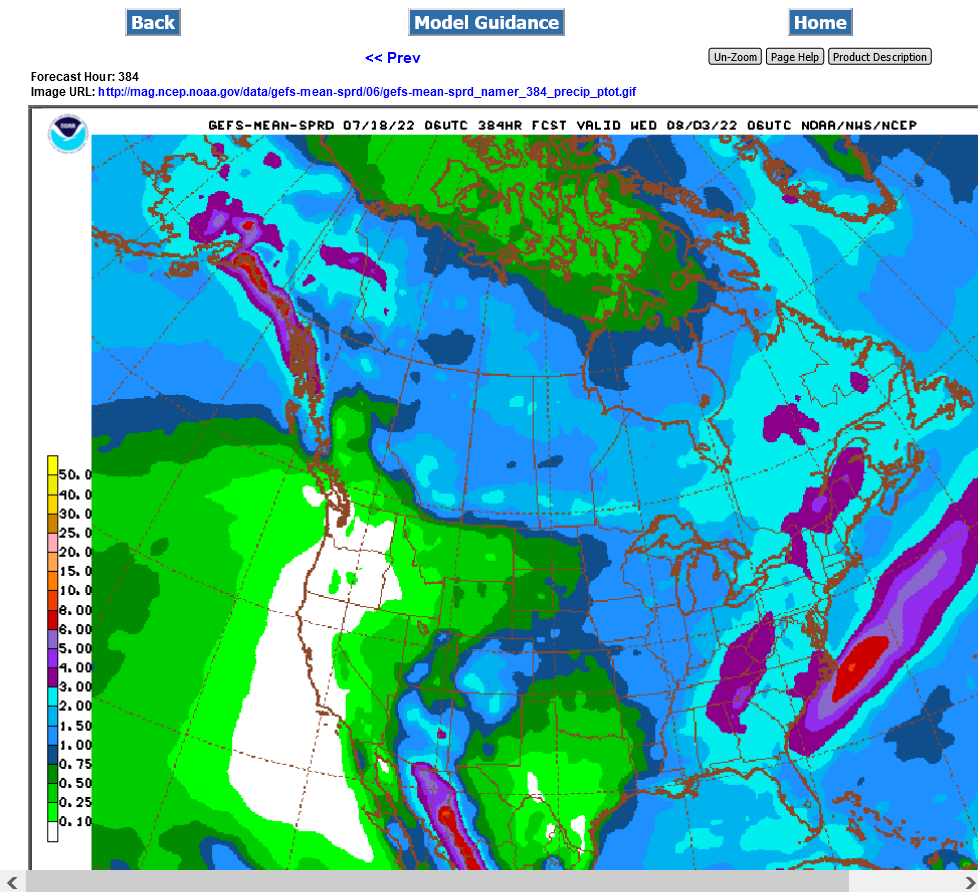
This was the last 6x GFS from several hours ago.
Slightly more rain for the central/western belt, slightly less ECB.
A shift in either direction will make it Mega bullish or LESS bullish by potentially a great amount because of how much rain there is in the East and the fact there is almost no rain to the west.