KEY EVENTS TO WATCH FOR:
Friday, April 22, 2022
9:45 AM ET. April US Flash Manufacturing PMI
PMI, Mfg (previous 58.5)
9:45 AM ET. April US Flash Services PMI
PMI, Services (previous 58.9)
The STOCK INDEXES? http://quotes.ino.com/ex?changes/?c=indexes
The Dow posted a downside reversal as it closed lower on Thursday signaling that the rally off February's low may have come to an end.The low-range close sets the stage for a steady to lower opening when Friday's night session begins trading. Stochastics and the RSI remain neutral to bullish signaling that sideways to higher prices are possible near-term. If the Dow extends the rally off February's low, the 75% retracement level of the January-February decline crossing at 35,783.87 is the next upside target. Closes below the 50-day moving average crossing at 34,289.22 would signal that a short-term top has been posted. First resistance is today's high crossing at 35,492.22. Second resistance is the 75% retracement level of the January-February decline crossing at 35,783.87. First support is the 20-day moving average crossing at 34,748.71. Second support is the 50-day moving average crossing at 34,288.75.
The June NASDAQ 100 closed sharply lower on Thursday while renewing the decline off March's high. The low-range close sets the stage for a steady to lower opening when Friday's night session begins trading. Stochastics and the RSI are oversold but remain neutral to bearish signaling that sideways to lower prices are possible near-term. If June extends the decline off March's high, the 75% retracement level of March's rally crossing at 13,527.67 is the next downside target. Closes above the 20-day moving average crossing at 14,495.11 would signal that a short-term low has been posted. First resistance is the 20-day moving average crossing at 14,495.11. Second resistance is the 62% retracement level of the November-March decline crossing at 15,262.64. First support is the 62% retracement level of March's rally crossing at 13,833.79. Second support is the 75% retracement level of March's rally crossing at 13,527.67.
The June S&P 500 posted a key reversal down as it closed lower on Wednesday. The low-range close sets the stage for a steady to lower opening when Friday's night session begins trading. Stochastics and the RSI are neutral to bullish signaling that sideways to higher prices are possible near-term. Closes above the 20-day moving average crossing at 4490.12 would signal that a short-term low has been posted. If June resumes the decline off March's high, the 62% retracement level of the February-March rally crossing at 4298.43 is the next downside target. First resistance is the 20-day moving average crossing at 4490.12. Second resistance is March's high crossing at 4631.00. First support is the 50% retracement level of the February-March rally crossing at 4362.09. Second support is the 62% retracement level of the February-March rally crossing at 4298.43.
INTEREST RATES? http://quotes.ino.com/ex?changes/?c=interest ""
June T-bonds closed down 20/32's at 140-13.
June T-bonds closed lower on Thursday as it consolidates some of Wednesday's rally. The mid-range close sets the stage for a steady to lower opening when Friday's night session begins trading. Stochastics and the RSI are oversold but remain neutral to bearish signaling that sideways to lower prices are possible near-term. If June extends the decline off March's high, the October-2018 low on the monthly continuation chart crossing at 136-16 is the next downside target. Closes above the 20-day moving average crossing at 144-31 would signal that a short-term low has been posted. First resistance is the 10-day moving average crossing at 141-22. Second resistance is the 20-day moving average crossing at 144-31. First support is Wednesday's low crossing at 138-14. Second support is the October-2018 low on the monthly continuation chart crossing at 136-16.
June T-notes closed down 190 pts. at 118.290.
June T-notes closed lower on Thursday as it extended the decline off March's high. The low-range close sets the stage for a steady to lower opening when Friday's night session begins trading. Stochastics and the RSI are oversold but remain neutral to bearish signaling sideways to lower prices are possible near-term. If June extends the decline off March's high, the October-2018 low on the monthly continuation chart crossing at 117.135 is the next downside target. Closes above the 20-day moving average crossing at 120.297 would signal that a short-term low has been posted. First resistance is the 20-day moving average crossing at 120.297. Second resistance is the March 31st high crossing at 123.040. First support is today's low crossing at 118.140. Second support is the October-2018 low on the monthly continuation chart crossing at 117.135.
ENERGY MARKETS? http://quotes.ino.com/ex?changes/?c=energy ""
June crude oil closed higher on Thursday.The mid-range close sets the stage for a steady to higher opening when Friday's night session begins. Stochastics and the RSI are turning neutral to bearish signaling that sideways to lower prices are still possible. Closes below the 50-day moving average crossing at $98.57 would signal that a short-term top has likely been posted. If June renews the rally off last-Monday's low, the March 24th high crossing at $113.51 is the next upside target. First resistance is the March 24th high crossing at $116.61. Second resistance is March's high crossing at $121.17. First support is April's low crossing at $92.60. Second support is March's low crossing at $92.20.
June heating oil closed slightly lower on Thursday as it extended the trading range of the past four-days. The mid-range close sets the stage for a steady to lower opening when Friday's night trading session begins. Stochastics and the RSI are overbought but remain neutral to bullish signaling that sideways to higher prices are possible near-term. If June extends the rally off the April 7th low, the 87% retracement level of the March decline crossing at 3.8622 is the next upside target. Closes below the 20-day moving average crossing at $3.3810 would signal that a short-term top has been posted. First resistance is the 75% retracement level of the March decline crossing at $3.7170. Second resistance is the 87% retracement level of the March decline crossing at $3.8622. First support is the 20-day moving average crossing at $3.3810. Second support is the 50-day moving average crossing at $3.1503.
June unleaded gas closed slightly higher on Thursday as it consolidated some of the decline off Monday's high. The mid-range close sets the stage for a steady to higher opening when Friday's night session begins trading. Stochastics and the RSI are turning neutral to bearish signaling that a short-term top might be in or is near. Closes below the 20-day moving average crossing at $3.2035 would signal that a short-term top has been posted. If June renews the rally off April's low, the 75% retracement level of March's decline crossing at 3.4806 is the next upside target. First resistance is the 75% retracement level of March's decline crossing at 3.4806. Second resistance is the 87% retracement level of March's decline crossing at 3.5887. First support is the 20-day moving average crossing at $3.2035. Second support is the 50-day moving average crossing at 3.0751.
June Henry natural gas closed slightly lower on Thursday as it extended the decline off Monday's high. The mid-range close sets the stage for a steady to lower opening when Friday's night session begins trading. Stochastics and the RSI are neutral to bearish signaling that sideways to lower prices are possible near-term. Closes below the 10-day moving average crossing at 7.016 would signal that a short-term top has been posted. If June resumes the rally off December's low, the 50% retracement level of the 2005-2020 decline on the monthly continuation chart crossing at 8.606 is the next upside target. First resistance is Monday's high crossing at 8.197. Second resistance is the 50% retracement level of the 2005-2020 decline on the monthly continuation chart crossing at 8.606. First support is the 10-day moving average crossing at 7.016. Second support is the 20-day moving average crossing at 6.371.
CURRENCIES? http://quotes.ino.com/ex?changes/?c=currencies ""
The June Dollar closed higher on Thursday to consolidated some of Wednesday's decline. The high-range close sets the stage for a steady to higher opening when Friday's nights session begins trading. Stochastics and the RSI are overbought but remain neutral to bullish signaling sideways to higher prices are possible near-term. If June extends the rally off January's low, the 87% retracement level of the 2020-2021-decline on the monthly continuation chart crossing at $102.04 is the next upside target. Closes below the 20-day moving average crossing at $99.54 would signal that a short-term top has likely been posted. First resistance is the 87% retracement level of the 2020-2021-decline on the monthly continuation chart crossing at $102.04. Second resistance is the 2020-high on the monthly continuation chart crossing at $103.96. First support is last-Thursday's low crossing at $99.56. Second support is the 20-day moving average crossing at $99.54.
The June Euro closed slightly lower on Thursday. The low-range close sets the stage for a steady to lower opening when Friday's night session begins trading. Stochastics and the RSI are oversold but remain neutral to bearish signaling that sideways to lower prices are possible near-term. If June extends the decline off the March 31st high, the March-2020 low on the weekly continuation chart crossing at $106.71 is the next downside target. Closes above the 20-day moving average crossing at $109.56 would signal that a short-term low has likely been posted. First resistance is the 20-day moving average crossing at $109.56. Second resistance is the 50-day moving average crossing at $110.92. First support is last-Thursday's low crossing at $107.81. Second support is the March-2020 low on the weekly continuation chart crossing at $106.71.
The June British Pound closed lower on Thursday while extending the trading range of the past two-weeks. The low-range close sets the stage for a steady to lower opening when Friday's night session begins trading. Stochastics and the RSI are turning neutral signaling that sideways trading is possible near-term. Closes above last-Thursday's high crossing at 1.3145 would signal that a short-term low has been posted. If June renews the decline off the March 23rd high, the 50% retracement level of the 2020-2021-rally crossing at 1.2894 is the next downside target. First resistance is last-Thursday's high crossing at 1.3145. Second resistance is the 50-day moving average crossing at 1.3222. First support is last-Wednesday's low crossing at 1.2969. Second support is the 50% retracement level of the 2020-2021-rally crossing at 1.2894.
The June Swiss Franc closed lower on Thursday as it extended the decline off the March 31st high. The low-range close sets the stage for a steady to lower opening when Friday's night session begins trading. Stochastics and the RSI are oversold but remain neutral to bearish signaling that sideways to lower prices are possible near-term. If June extends the decline off the March 31st high, the March-2020 low crossing at 1.0415 is the next downside target. Closes above the 20-day moving average crossing at 1.0731 would signal that a short-term low has been posted. First resistance is the 10-day moving average crossing at 1.0660. Second resistance is the 20-day moving average crossing at 1.0731. First support is today's low crossing at 1.0490. Second support is the March-2020 low crossing at 1.0415.
The June Canadian Dollar posted a downside reversal as it closed lower on Thursday as it consolidated some of Wednesday's rally.The low-range close sets the stage for a steady to lower opening when Friday's night session begins trading. Stochastics and the RSI are neutral to bullish signaling that sideways to higher prices are possible near-term. If June extends Wednesday's rally, the April 5th high crossing at 80.61 is the next upside target. Closes below the 50-day moving average crossing at 79.05 would renew the decline off April's high while opening the door for additional weakness near-term. First resistance is today's high crossing at 80.24. Second resistance is the April 5th high crossing at 80.61. First support is the 50-day moving average crossing at 79.05. Second support is the 62% retracement level of the March-April rally crossing at 78.69.
The June Japanese Yen posted an inside day with a lower close on Thursday. The mid-range close sets the stage for a steady to lower opening when Friday’s night session begins trading. Stochastics and the RSI are oversold but remain neutral to bearish signaling that sideways to lower prices are possible near-term. If March extends the aforementioned decline, March's low the February-2002 low on the monthly continuation chart crossing at 0.074150 is the next downside target. Closes above the 20-day moving average crossing at 0.080498 would signal that a short-term low has been posted. First resistance is the 10-day moving average crossing at 0.079347. Second resistance is the 20-day moving average crossing at 0.080498. First support is Tuesday's low crossing at 0.077385. Second support is the February-2002 low on the monthly continuation chart crossing at 0.074150.
PRECIOUS METALS? http://quotes.ino.com/ex?changes/?c=metals ""
April gold closed lower on Thursday as it consolidated some of the rally off March's low. The mid-range close sets the stage for a steady to lower opening when Friday's night session begins trading. Stochastics and the RSI remain neutral to bearish signaling that sideways to lower prices are possible near-term. Closes below the 50-day moving average crossing at $1932.20 would confirm that a short-term top has been posted. If April renews the rally off March's low, the 62% retracement level of the March decline crossing at $2005.50 is the next upside target. First resistance is Monday's high crossing at $1997.10. Second resistance is the 62% retracement level of the March decline crossing at $2005.50. First support is the 50-day moving average crossing at $1932.20. Second support is March's low crossing at $1888.30.
May silver closed lower on Thursday and below the 50-day moving average crossing at 24.974 signaling that a short-term top has been posted. The low-range close sets the stage for a steady to lower opening when Friday's night session begins trading. Stochastics and the RSI remain neutral to bearish signaling that sideways to lower prices are possible near-term. If May extends this week's decline, April's low crossing at 24.200 is the downside target. Closes above the 20-day moving average 25.118 would temper the near-term bearish outlook. First resistance is the 20-day moving average 25.118. Second resistance is Monday's high crossing at 26.495. First support is April's low crossing at 24.200. Second support is March's low crossing at 24.045.
May copper posted an inside day with a higher close on Thursday as it consolidated some of this week's decline. The high-range close sets the stage for a steady to higher opening when Friday's night session begins trading. Stochastics and the RSI have turned bearish signaling that sideways to lower prices are possible near-term. Closes below Wednesday's low crossing at 4.6195 would open the door for additional weakness near-term. If May resumes the rally off March's low, the 75% retracement level of March's decline crossing at 4.8967 is the next upside target. First resistance is the 62% retracement level of March's decline crossing at 4.8214. Second resistance is the 75% retracement level of March's decline crossing at 4.8967. First support is Wednesday's low crossing at 4.6195. Second support is March's low crossing at 4.4685.
GRAINS? http://quotes.ino.com/ex?changes/?c=grains "
July Corn closed down $0.14 3/4-cents at $7.95 1/4.
July corn posted an inside day with a lower close on Thursday as it consolidated some of the rally off the March 16th low crossing at $6.93 1/4. The low-range close sets the stage for a steady to lower opening when Friday's night session begins trading. Stochastics and the RSI are overbought but remain neutral to bullish signaling that sideways to higher prices are possible near-term. If July extends the rally off the March 29th low, the August-2012 high on the monthly continuation chart crossing at $8.43 3/4 is the next upside target. Closes below the 10-day moving average crossing at $7.81 1/2 would signal that a short-term top has likely been posted. First resistance is Tuesday's high crossing at $8.14. Second resistance is the August-2012 high on the monthly continuation chart crossing near $8.43 3/4. First support is the 10-day moving average crossing at $7.81 1/2. Second support is the 20-day moving average crossing at $7.56 1/4.
July wheat closed down $0.21-cents at $10.76.
July wheat closed lower on Thursday as it consolidated some of the rally off March's low. The low-range close sets the stage for a steady to lower opening when Friday's night session begins trading. Stochastics and the RSI have turning neutral to bearish signaling that sideways to lower prices are possible near-term. Closes below the 20-day moving average crossing at $10.62 3/4 would signal that a short-term top has been posted. If July extends the rally off March's low, the 62% retracement level of the March decline crossing at $11.59 1/4 is the next upside target. First resistance is the 62% retracement level of the March decline crossing at $11.59 1/4. Second resistance is the 75% retracement level of the March decline crossing at $12.00 1/4. First support is the 20-day moving average crossing at $10.62 3/4. Second support is the 50-day moving average crossing at $10.12 1/2.
July Kansas City Wheat closed down $0.26-cents at $11.43 1/2.
July Kansas City wheat closed lower on Thursday as it extended the trading range of the past six-days. The low-range close sets the stage for a steady to lower opening when Friday's night session begins trading. Stochastics and the RSI are turning neutral to bearish signaling that sideways to lower prices are possible near-term. Closes below the 20-day moving average crossing at $11.04 3/4 would signal that a short-term top has been posted. If July renews the rally off the 87% retracement level of March's decline crossing at $12.28 is the next upside target. First resistance is Tuesday's high crossing at $12.02 1/4. Second resistance is the 87% retracement level of March's decline crossing at $12.28. First support is the 20-day moving average crossing at $11.04 3/4. Second support is the 50-day moving average crossing at $10.40.
July Minneapolis wheat closed down $0.17 3/4-cents at $11.54 1/2.
July Minneapolis wheat closed lower on Thursday as it consolidated some of the rally off the March 29th low crossing at $10.18 1/4. The low-range close sets the stage for a steady to lower opening when Friday's night session begins trading. Stochastics and the RSI are overbought but remain neutral to bullish signaling that sideways to higher prices are is possible near-term. If July extends the rally off the March 29th low, the 38% retracement level of the 2008-2009 decline on the monthly continuation chart crossing at $12.21 1/2 is the next upside target. Closes below the 20-day moving average crossing at $11.15 1/2 would signal that a short-term top has been posted. First resistance is Monday's high crossing at $11.88 3/4. Second resistance is the March 29th low, the 38% retracement level of the 2008-2009 decline on the monthly continuation chart crossing at $12.21 1/2. First support is the 10-day moving average crossing at $11.50 1/2. Second support is the 20-day moving average crossing at $11.15 1/2.
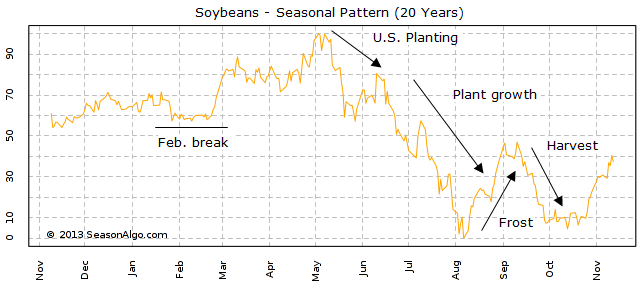
SOYBEAN COMPLEX? http://quotes.ino.com/ex?changes/?c=grains "
July soybeans closed up $0.02 1/2-cents at $17.19 1/2.
July soybeans closed higher on Thursday as it extended Tuesday's breakout above March's high crossing at $17.13 as it extended the rally off April's low. The high-range close sets the stage for a steady to higher opening when Friday's night session begins trading. Stochastics and the RSI are overbought but remain neutral to bullish signaling that sideways to higher prices are possible near-term. If July extends the rally off April's low, February's high crossing at $17.41 is the next upside target. Closes below the 50-day moving average crossing at $16.36 1/2. First resistance today's high crossing at $17.26 1/4. Second resistance is February's high crossing at $17.41. First support is the 50-day moving average crossing at $16.36 1/2. Second support is April's low crossing at $15.60 1/2.
July soybean meal closed down $2.40 at $463.90.
July soybean meal closed lower on Thursday. The mid-range close sets the stage for a steady to lower opening when Friday's night session begins trading. Stochastics and the RSI remain neutral to bullish signaling that sideways to higher prices are possible near-term. If July extends the rally off March's low, the March 29th high crossing at $473.00 is the next upside target. If July renews the decline off March's high, the February 16th low crossing at $435.50 is the next downside target. First resistance is the March 29th high crossing at $473.00. Second resistance is March's high crossing at $484.60. First support is April's low crossing at $441.10. Second support is the February 16th low crossing at $435.50.
July soybean oil closed up 89 pts. at 79.64.
July soybean oil closed higher on Thursday as it extended this year's rally into uncharted territory. The high-range close sets the stage for a steady to higher opening when Friday's night session begins trading. Stochastics and the RSI are overbought but remain neutral to bullish signaling that sideways to higher prices are possible near-term. If July extends the aforementioned rally into uncharted territory, upside targets will be hard to project. Closes below the 20-day moving average crossing at 73.28 would signal that a short-term top has been posted. First resistance is today's high crossing at 80.10. Second resistance is unknown. First support is the 10-day moving average crossing at 75.98. Second support is the 20-day moving average crossing at 73.28.
LIVESTOCKhttp://quotes.ino.com/exchanges/?c=livestock
June hogs closed down $1.58 at $117.18.
June hogs closed lower on Thursday as it extended the decline off Tuesday's high. The low-range close sets the stage for a steady to lower opening when Friday's session begins trading. Stochastics and the RSI are turning neutral to bearish signaling that sideways to lower prices are possible near-term. Today's close below the 50-day moving average crossing at $117.53 signals that a short-term top has been posted. If June renews the rally off the March 5th low, March's high crossing at $127.32 is the next upside target. First resistance is Tuesday's high crossing at $123.08. Second resistance is March's high crossing at $127.32. First support is the 38% retracement level of the September-March rally crossing at $111.94. Second support is the March 7th low crossing at $109.15.
June cattle closed up $1.28 at $139.90
June cattle closed higher on Thursday as it extended the rally off April's low. The high-range close sets the stage for a steady to higher opening on Friday. Stochastics and the RSI are neutral to bullish signaling that sideways to higher prices are possible near-term. If June extends the rally off April's low, the 75% retracement level of the February-March decline crossing at $140.29 is the next upside target. Closes below the 20-day moving average crossing at $136.30 would signal that a short-term top has been posted. First resistance is the 75% retracement level of the February-March decline crossing at $140.29. Second resistance is the the 87% retracement level of the February-March decline crossing at $141.78. First support is the 50-day moving average crossing at $137.15. Second support is the 20-day moving average crossing at $136.30.
May Feeder cattle closed up $2.38 at $164.85.
May Feeder cattle closed higher on Thursday and above the 20-day moving average crossing at $162.99 signaling that a short-term low has been posted. The high-range close sets the stage for a steady to higher opening when Friday's session begins trading. Stochastics and the RSI have turned neutral to bullish signaling that sideways to higher prices are possible near-term. If May extends the rally off April's low, the 50-day moving average crossing at $166.80 is the next upside target. If May renews the decline off the 87% retracement level of the 2021-2022 rally crossing at $156.27 is the next downside target. First resistance is the 50-day moving average crossing at $166.80. Second resistance is the March 29th high crossing at $170.40. First support is Monday's low crossing at $158.65. Second support is the 87% retracement level of the 2021-2022 rally crossing at $156.27.
FOOD & FIBERhttp://quotes.ino.com/ex changes/?c=food
July coffee posted a key reversal up as it closed higher on Thursday as it consolidated some of the decline off April's high. The high-range close sets the stage for a steady to higher opening on Friday. Stochastics and the RSI are poised to turn neutral to bullish signaling that sideways to higher prices are possible near-term. Closes above the 50-day moving average crossing at 23.00 would signal that a short-term low has been posted. If May extends the decline off April's high, the March 28th low crossing at 21.27 is the next downside target.
July cocoa closed slightly lower on Thursday. The mid-range close sets the stage for a steady to slightly lower opening on Friday. Stochastics and the RSI are neutral to bearish signaling that sideways to lower prices are possible near-term. If July extends the decline off last-Monday's high, March's low crossing at 24.87 is the next downside target. Closes above the 50-day moving average crossing at 26.43 would signal that a short-term low has been posted.
July sugar posted a key reversal up as it closed higher on Thursday as it consolidated some of the decline off last-Wednesday's high. The high-range close sets the stage for a steady to higher opening on Friday. Stochastics and the RSI are neutral to bearish signaling that sideways to lower prices are possible near-term. If July extends the decline off April's high, the 50-day moving average crossing at 18.87 is the next downside target. If July renews the rally off February's low, weekly resistance crossing at 20.69 is the next upside target.
July cotton closed lower on Thursday as it extended the decline off last-Thursday's high. The mid-range close sets the stage for a steady to lower opening on Friday. Stochastics and the RSI are neutral to bearish signaling that a short-term top might be in or is near. Closes below the 20-day moving average crossing at 135.11 would confirm that a top has been posted. If July resumes the rally off March's low, the 62% retracement level of the 2011-2020-decline on the monthly continuation chart crossing at 154.43 is the next upside target.
Thanks very much tallpine!
Going to be a wild season for the grains this year!
Let's hope our producers have record crops for C and S.
SRW yields can still be excellent.
The HRW crop is already toast. Even with perfect weather, yields will be bad.
https://www.marketforum.com/forum/topic/83443/
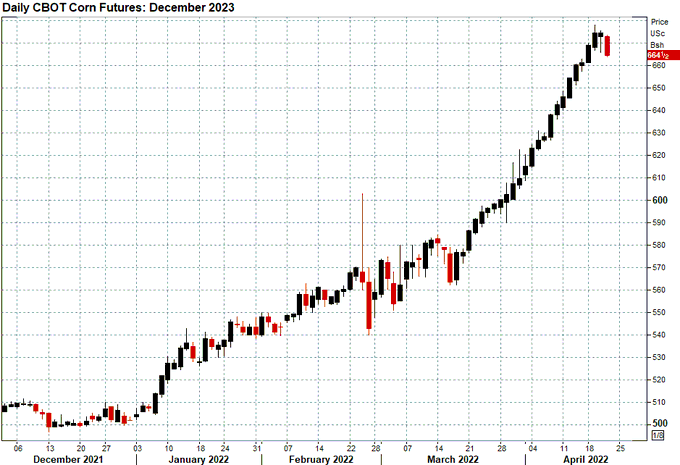
April 21: CBOT December 2023 #corn futures mark their first daily decline since March 16 after reaching a contract high of $6.78 per bushel on Tuesday. However, Thursday's close of $6.64-1/2 is by far red Dec's highest ever for the date. Was right around $6 in 2012.