Weather Tuesday
24 responses | 0 likes
Started by metmike - July 17, 2018, 10:11 a.m.

Happy July 17th!


 Scroll down and enjoy the latest comprehensive weather for trading............ or for any other reason.

Still tons of rain in many key locations, the latest forecasts are below.

Day 1 below:

http://www.wpc.ncep.noaa.gov/qpf/fill_94qwbg.gif?1526306199054

http://www.wpc.ncep.noaa.gov/qpf/fill_94qwbg.gif?1531339983148

Day 2 below:

http://www.wpc.ncep.noaa.gov/qpf/fill_98qwbg.gif?1528293750112


http://www.wpc.ncep.noaa.gov/qpf/fill_98qwbg.gif?1531340045174


Day 3 below:

http://www.wpc.ncep.noaa.gov/qpf/fill_99qwbg.gif?1528293842764

http://www.wpc.ncep.noaa.gov/qpf/fill_99qwbg.gif?1531340092706


Days 4-5 below:

http://www.wpc.ncep.noaa.gov/qpf/95ep48iwbg_fill.gif?1526306162

http://www.wpc.ncep.noaa.gov/qpf/95ep48iwbg_fill.gif?1531339379

 Days 6-7 below:

http://www.wpc.ncep.noaa.gov/qpf/97ep48iwbg_fill.gif?1526306162

http://www.wpc.ncep.noaa.gov/qpf/97ep48iwbg_fill.gif?1531339379


7 Day Total precip below:

http://www.wpc.ncep.noaa.govcdx /qpf/p168i.gif?1530796126

http://www.wpc.ncep.noaa.gov/qpf/p168i.gif?1530796126

Comments
By metmike - July 17, 2018, 10:12 a.m.
Like Reply

Excessive Rainfall threat..........same wet areas as earlier this Summer.


Current Day 1 ForecastCurrent Day 1 Excessive Rainfall Forecast

Day 1 Threat Area in Text Format  


Current Day 2 ForecastCurrent Day 2 Excessive Rainfall Forecast


Day 3 forecast below

Current Day 3 Excessive Rainfall Forecast

By metmike - July 17, 2018, 10:13 a.m.
Like Reply

Severe Storm Risk.   Press your cursor on the map for full screen.

https://www.spc.noaa.gov/products/outlook/

Current Day 1 Outlook
        1300 UTC Day 1 Outlook             
                Forecaster: Hart/Kerr
Issued: 18/1240Z
Valid: 18/1300Z - 19/1200Z
Forecast Risk of Severe Storms: Slight Risk        
      
          Current Day 2 Outlook
          0600 UTC Day 2 Outlook               
                Forecaster: Bunting
Issued: 18/0600Z
Valid: 19/1200Z - 20/1200Z
Forecast Risk of Severe Storms: Marginal Risk        
      
          Current Day 3 Outlook
          0600 UTC Day 3 Outlook               
                Forecaster: Bunting
Issued: 18/0731Z
Valid: 20/1200Z - 21/1200Z
Forecast Risk of Severe Storms: Marginal Risk
      
          Current Day 4-8 Outlook
          Day 4-8 Convective Outlook
By metmike - July 17, 2018, 10:15 a.m.
Like Reply

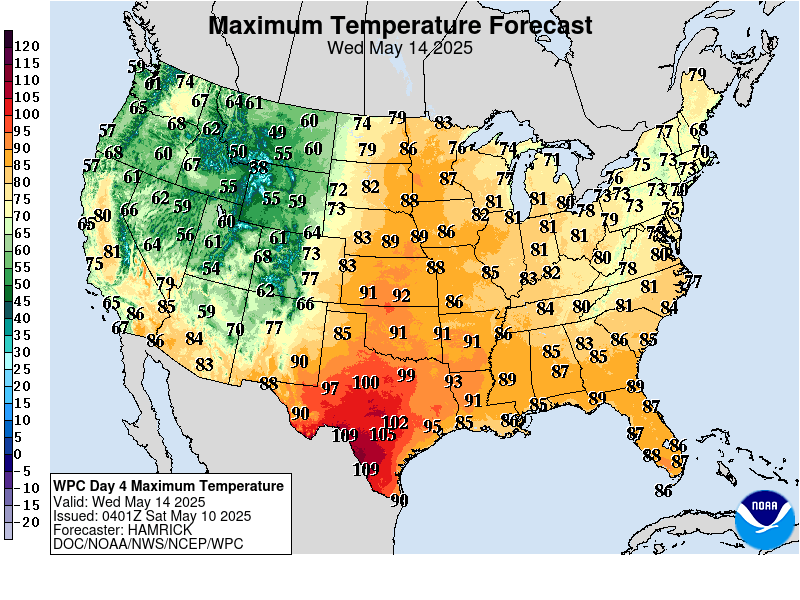
High Temperatures today and Wednesday......comfortable Midwest to Northeast. Triple digit heat in the S.Plains......also Southwest and part of the Northwest.


By metmike - July 17, 2018, 10:17 a.m.
Like Reply

Dew points. 70+ on this scale makes it feel uncomfortable(sticky air)! Nashville TN to NYC but getting pushed southward.

Current Dew Points

By metmike - July 17, 2018, 10:17 a.m.
Like Reply

Heat and high humidity COMBINED .....feels like temperature! Still MUGGY today south and east of Nashville to NYC but dryer air is pushing south.

Current US Heat Index Map


By metmike - July 17, 2018, 10:19 a.m.
Like Reply

Highs days 3-7............Sizzling in the S.Plains. Magnificent Midwest to East Coast.

http://www.wpc.ncep.noaa.gov/medr/DAY3_MAX_filled.gif

http://www.wpc.ncep.noaa.gov/medr/DAY4_MAX_filled.gifhttp://www.wpc.ncep.noaa.gov/medr/DAY5_MAX_filled.gifhttp://www.wpc.ncep.noaa.gov/medr/DAY6_MAX_filled.gifhttp://www.wpc.ncep.noaa.gov/medr/DAY7_MAX_filled.gif

By metmike - July 17, 2018, 10:21 a.m.
Like Reply

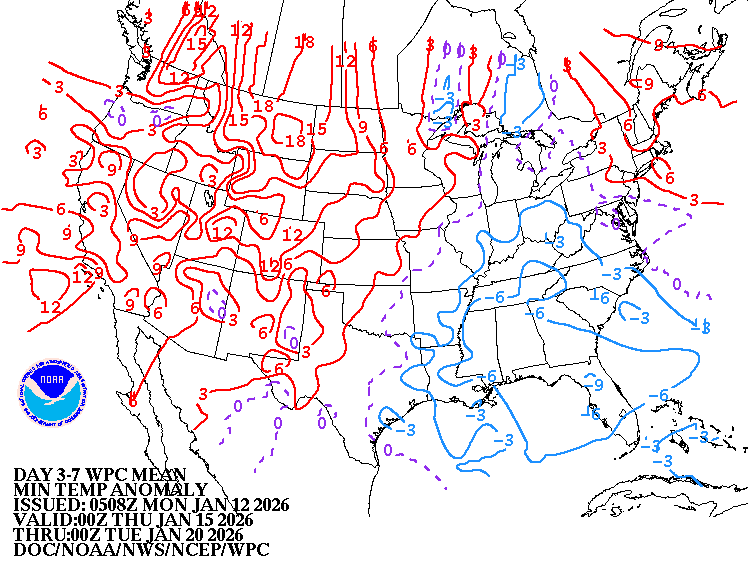
How do these temperatures compare to average at this time of year. Close  to average in the Midwest to East/Coast!

 Heat backs up to the West!  Record heat in the S.Plains.

High temperature departures:
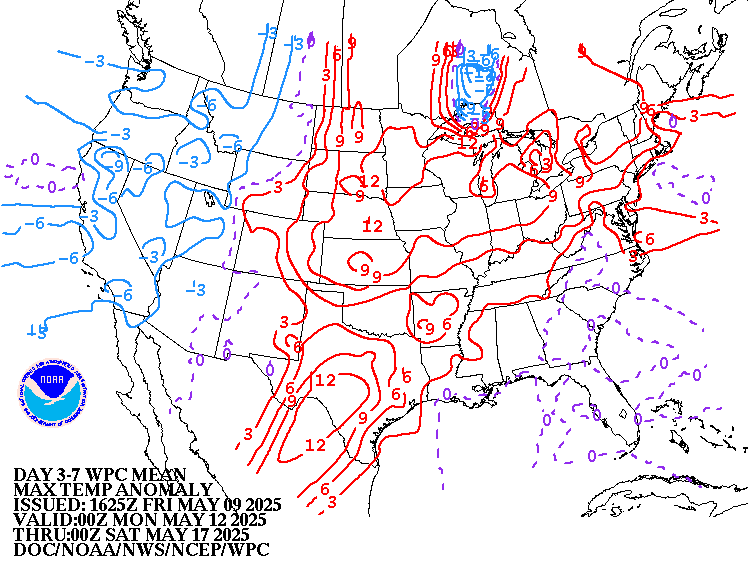
http://www.wpc.ncep.noaa.gov/medr/hpcmaxwbg.gif


Low Temperature Departures:

http://www.wpc.ncep.noaa.gov/medr/hpcminwbg.gif

By metmike - July 17, 2018, 10:22 a.m.
Like Reply

Cold fronts in the Midwest with cooler air!


https://weather.com/maps/currentusweather

Current US Surface Weather Map

By metmike - July 17, 2018, 10:22 a.m.
Like Reply

Here is the latest radar image. 

http://www.nws.noaa.gov/radar_tab.php

Doppler Radar National Mosaic Loop

By metmike - July 17, 2018, 10:23 a.m.
Like Reply

Rains the past 24 hours.  Kansas/Nebraska got the most!     

By metmike - July 17, 2018, 10:26 a.m.
Like Reply

A new map..........thanks mcfarm!

Drying out in a lot of places............but that almost always happens in July                                               


Missouri/Arkansas  to S.Plains in bad shape....bone dry.

NE to s.MN/n. IA...........wet!

http://www.cpc.ncep.noaa.gov/products/Soilmst_Monitoring/Figures/daily/curr.w.anom.daily.gif


http://www.cpc.ncep.noaa.gov/products/analysis_monitoring/regional_monitoring/cmi.gif

By metmike - July 17, 2018, 10:26 a.m.
Like Reply

Rains over the last week, 2 weeks, month and 2 months compared to normal.

https://www.atmos.illinois.edu/~snodgrss/Ag_Wx.html

http://weather.agribleservices.com/ahps/7_day_percent.png


http://weather.agribleservices.com/ahps/14_day_percent.png

http://weather.agribleservices.com/ahps/30_day_percent.pnghttp://weather.agribleservices.com/ahps/60_day_percent.png

By metmike - July 17, 2018, 10:28 a.m.
Like Reply

Drought has worsened in those areas(KS/AR should be getting some relief, OK/TX will get worse yet):

            http://droughtmonitor.unl.edu/Maps/CompareTwoWeeks.aspx    


Drought Monitor for conus

By metmike - July 17, 2018, 10:30 a.m.
Like Reply

The low skill, longer range CFS model, pleasant/cool north, blazing heat south and west in week 3, then heat Midwest and East for week 4. 


http://www.cpc.ncep.noaa.gov/products/people/mchen/CFSv2FCST/weekly/images/wk3.wk4_latest.NAsfcT.gif

Precip below:

http://www.cpc.ncep.noaa.gov/products/people/mchen/CFSv2FCST/weekly/images/wk3.wk4_latest.NAprec.gif

By metmike - July 17, 2018, 10:31 a.m.
Like Reply

Temperature Anomalies from GFS ensembles going out 2 weeks:

Today: Much cooler/Midwest, heat backs up West.
NCEP Ensemble t = 024 hour forecast product


In 5+ days:

Hot West/S.Plains, Pleasant Midwest to East.
NCEP Ensemble t = 144 hour forecast product


In 10+ days   Hot West to S.Plains pleasant Midwest to East.
NCEP Ensemble t = 240 hour forecast product


Day 15  Hot West to High Plains, comfortable Midwest to East.NCEP Ensemble t = 360 hour forecast product

By metmike - July 17, 2018, 10:32 a.m.
Like Reply

Same questions as the last 3 days:

Last 0Z run of Canadian ensembles. How deep will the upper level trough in the Northeast back to Upper Midwest be?

Will the strong upper level ridge in Western Atlantic backing up towards East Coast merge with the heat ridge from the Southwest/S.Plains eastward?  Will this act to keep the trough from deepening?

Just less than half of the members have this idea.


360h GZ 500 forecast valid on Jul 28, 2018 00UTC

GZ 500 forecastGZ 500 forecastGZ 500 forecastGZ 500 forecast

By mcfarm - July 17, 2018, 11:49 a.m.
Like Reply

Just got my update form Dr Atkins. Real heat building in the far south, over 100 in places...but the big news is the  cool air coming down from Canada. Later part of July shows very cool for the major midwest areas with major flooding starting and continuing in the July aug time frame....all the way from Miami north......major battle of air masses sitting up with those caught in between to see mother nature in full control...major cool down in 60 days with some snow days 61 to 70 in Montana,,,snow to get into chicago outskirts in early october a real possiblity

By metmike - July 17, 2018, 1:12 p.m.
Like Reply

Last 12z GFS operational model has latched on to the idea of alot of the Canadian ensembles...........it builds the W. Atlantic ridge back............way back. And squeezes the upper level trough in the Northeast/Midwest out of the picture as it merges with the dome to the west.


gfs_namer_360_200_wnd_ht
      gfs_namer_360_200_wnd_ht_s.gif   
      gfs_namer_360_500_vort_ht
      gfs_namer_360_500_vort_ht_s.gif   
      gfs_namer_360_1000_500_thick
      gfs_namer_360_1000_500_thick_s.gif   
      gfs_namer_360_850_temp_ht
      gfs_namer_360_850_temp_ht_s.gif
By metmike - July 17, 2018, 1:15 p.m.
Like Reply

This is much warmer(hot) than the previous solution and the consensus of models. Below was the previous, 6z run of the operational GFS:


gfs_namer_372_200_wnd_ht
      gfs_namer_372_200_wnd_ht_s.gif   
      gfs_namer_372_500_vort_ht
      gfs_namer_372_500_vort_ht_s.gif   
      gfs_namer_372_1000_500_thick
      gfs_namer_372_1000_500_thick_s.gif   
      gfs_namer_372_850_temp_ht
      gfs_namer_372_850_temp_ht_s.gif
By metmike - July 17, 2018, 1:27 p.m.
Like Reply

Interestingly, the 12z Canadian model ensembles/average have gone slightly in the opposite direction.........the trough in the Midwest to East is deeper.

Big contrast/disagreement though. Just a few members build the ridge, a few have a very deep trough. 


372h GZ 500 forecast valid on Aug 2, 2018 00UTC

GZ 500 forecastGZ 500 forecastGZ 500 forecastGZ 500 forecast

Forecasts for global GEM, control (GEM 0) and the 20 ensemble members

By metmike - July 17, 2018, 3:24 p.m.
Like Reply

The NWS extended forecasts are below.

 Cool Midwest. Hot West to S.Plains to possibly deep South. 

A dry spell in the Central Cornbelt early in week 2, but followed by rain chances returning and the short term forecast for later this week, has rain chances before the dry spell.


Temperature Probability 6-10 day

6 to 10 Day Outlook - Temperature Probability
 Precipitation Probability

  6 to 10 Day Outlook - Precipitation Probability

Temperature Probability 8-14 day

8 to 14 Day Outlook - Temperature Probability
 Precipitation Probability

  8 to 14 Day Outlook - Precipitation Probability
By metmike - July 17, 2018, 8:48 p.m.
Like Reply

Extreme weather days 3-7:  Heat S.Plains and just east. Heat Southwest and Northwest. Heavy rains East.

http://www.cpc.ncep.noaa.gov/products/predictions/threats/hazards_d3_7_contours.png

By metmike - July 17, 2018, 8:50 p.m.
Like Reply

Extreme weather days 8-14:

Heat from TX westward.

http://www.cpc.ncep.noaa.gov/products/predictions/threats/hazards_d8_14_contours.png

By james - July 18, 2018, 4:16 a.m.
Like Reply

Hi Mike

Thank you very much for the information


My impression is that all is well with the soya bean  crop  and  continue as such for the next few days ?