4-30-22: I stumbled on this just now and realized it related to our first discussion with Larry on the record GA snowfall on April 25 over a century ago that I'd completely forgotten about:
https://www.marketforum.com/forum/topic/83627/
+++++++++++++++++++++++++++++++++++++++
Addition: It appears that there was an even later event on April 24/25 in 1910!
So yesterday was a MODERN DAY record and the 2nd latest snow date ever going back to 1880.
It was colder in the 1800's, so if we could go back another 100 years, I would bet we would find that there were several snow events even later than this.
Meteorologist Mike
I listened to the TV meteorogists tell us that this will be THE latest measurable snow since records have been kept earlier this week, if it happens.
The NWS said today that it was the latest snow in their record books.
However, they didn't go back far enough in their own records to find a bigger snow on the same date,
so it was actually tied!
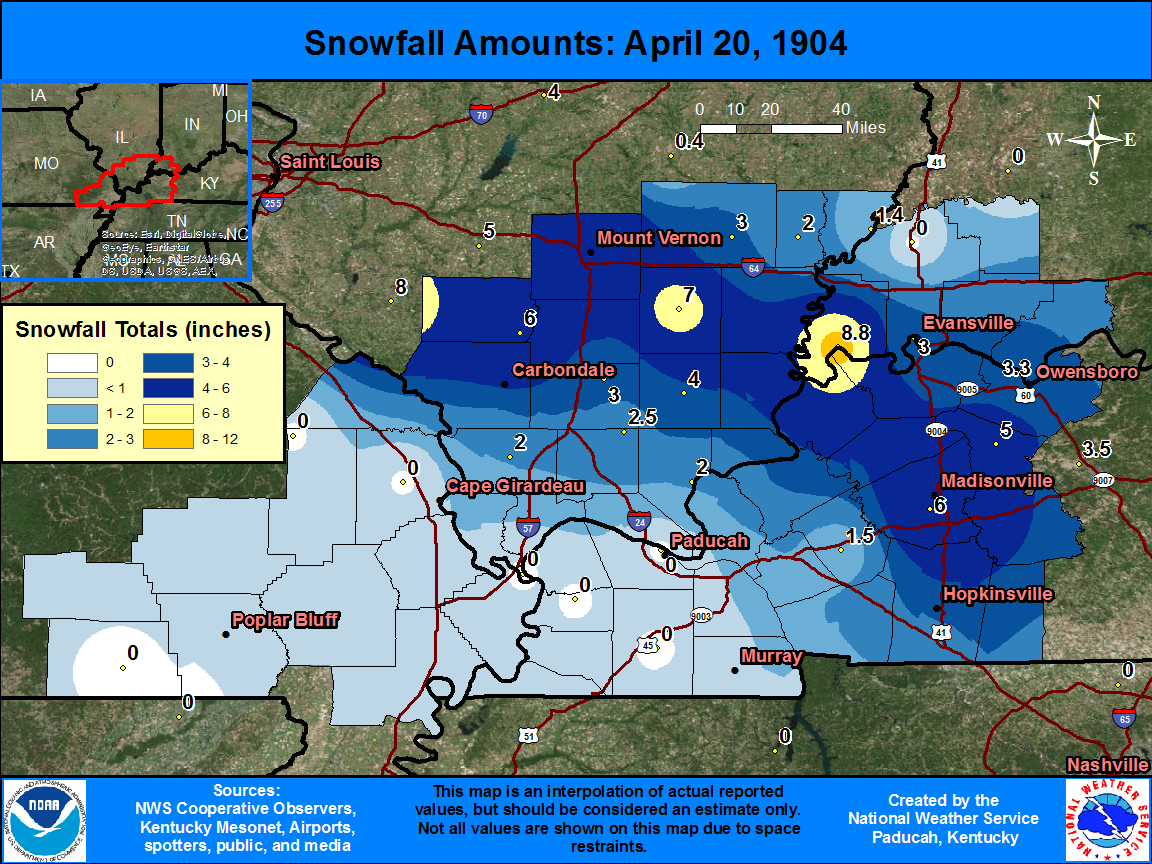
See their statement this morning, followed by the 1904 event below (that had more snow-3 inches compared to 1.3 inches yesterday).
https://w2.weather.gov/climate/getclimate.php?wfo=pah
These data are preliminary and have not undergone final quality control by the National Climatic Data Center (NCDC). Therefore, these data are subject to revision. Final and certified climate data can be accessed at the NCDC - http://www.ncdc.noaa.gov.
014 SXUS73 KPAH 210937 REREVV
RECORD EVENT REPORT NATIONAL WEATHER SERVICE PADUCAH 437 AM CDT WED APR 21 2021

...RECORD DAILY MAXIMUM SNOWFALL SET AT EVANSVILLE INDIANA...
A RECORD SNOWFALL OF 1.3 INCHES WAS SET AT EVANSVILLE YESTERDAY, APRIL 20TH. IN SNOWFALL RECORDS THAT GO BACK TO 1948, MEASURABLE SNOWFALL HAS NOT PREVIOUSLY OCCURRED ON THIS DATE.
https://www.weather.gov/pah/SnowApr20_1904
That is amazing!
But I have something that is even more amazing:
April 25, 1910 snowfall in northern Georgia | Climate and Agriculture in the Southeast (uga.edu)
ATL got 1.5" of snow and the high was only 39!! The low was 32, still the latest 32 on record. Even more amazing: Americus, GA, way down at 32N latitude had a trace in official records: see the "T" at the end of the 4/25/1910 line (this didn't copy and paste well):
| 1910-04-25 | 66 | 34 | 50.0 | -15.2 | 15 | 0 | 0.13 | T |
from: https://w2.weather.gov/climate/xmacis.php?wfo=ffc
Although I can't verify, this article mentions "it has been mentioned" that a trace fell way down at Pensacola!
Lows on 4/26/1910 were as low as 33 way down at Waycross, GA, and Lake City, FL! Ocala, FL, got down to 38!
Thanks much Larry, wow! It would be pretty amazing to see the weather maps those days.............if they existed.
and light flurries were predicted today.....well its a white out right now, cannot see across the road the flurry is so light
Daily weather maps from the "Weather Bureau" go way back before then. There are daily wx maps that exist back to the early 1870s (I've seen them, myself). What started them?
History of the National Weather Service
Edit: However, upper level maps didn't start til around the late 1940s I think. I think that the 500 mb maps would be more interesting for 4/25/1910 as I have long suspected a vigorous closed upper level low caused this, which may not have reflected too well at the sfc.
Yes, surface plot maps for sure but I thought not much from the upper levels.
But it turns out that data from as high up as 3KM was available from weather kites in the 1800's.
This is actually mind boggling amazing.
https://www.weather.gov/upperair/reqdahdr
Upper air observations began as early as 1749 in Europe with the use of a kite to carry aloft a thermometer. A few years later, in the American Colonies, Ben Franklin conducted a very dangerous experiment by flying a kite near a thunderstorm to demonstrate the electrical nature of lightning. With the invention of hot air and hydrogen balloons in France in the early 1780's, scientists ascended aloft taking with them barometers, thermometers, and other instrumentation to investigate the structure and chemistry of the upper-atmosphere.
Manned ascents to study the upper atmosphere continued through the 1800's (and continued to the early 1960's). However, some of the early flights were very dangerous. In 1862, two men ascended to an altitude of about 11 km over Great Britain and nearly died from the extreme cold and lack of air. In a later flight taken over Europe in 1875, two French "Aeronauts" died as a result of inadequate breathing equipment.
Meanwhile, the use kites for observing the upper-atmosphere continued and by the end of the 1800's kite observation stations were established by the United States Weather Bureau (National Weather Service today) and elsewhere for taking observations. The kites carried aloft meteorological instruments or "meteorographs" that recorded pressure, temperature, and relative humidity data on a clockwork driven chart recorder. Yet, use of kites had several disadvantages:
By the end of the 1800's, meteorographs had developed to a point where they could be carried aloft by free, unmanned balloons. Such soundings reached the stratosphere that was a much greater height than that achieved with manned balloons or kites. After the balloon burst, the meteorograph returned to Earth and preserved the recorded data for days or weeks until it was found. The major drawback to this sounding approach was that the data was not readily available for weather forecasting and was lost if the meteorograph could not be recovered. A means of solving this problem was keeping the balloon captive, but this limited the maximum altitude that could be achieved.
The advent of aircraft carrying meteorographs brought an end to routine kite observations by 1933. From about 1925 to 1943 the Weather Bureau and Army Air Corps operated a network of up to 30 aircraft stations across the country that collected aircraft observations or "APOBS". However, like the kite, the aircraft could not be flown in poor weather and the data could not be analyzed until the plane landed. Furthermore, the maximum altitude achieved was only about 5 km.
To supplement the kite and aircraft data, Weather Bureau stations in 1909 began to track small, free balloons (i.e., pilot balloons) with an optical theodolite to obtain winds aloft information. At night a small light was attached to the balloon to aid tracking. Although winds aloft data could be obtained in near real-time, the balloons could only be tracked to about 5 km under good sky conditions. Moreover, when clouds or poor weather were present, sight of the balloon could be lost resulting in little or no data.
The inability of kite and aircraft meteorographs to achieve high altitudes, operate in all weather, and provide data in real-time helped foster the development for the radio transmission of upper-air data. In the late 1920's, scientists began suspending crude radio transmitters from free balloons and by the early 1930's the first radio-meteorographs or "radiosondes" were being flown into the stratosphere. In 1937 the Weather Bureau established a network of radiosonde stations that has continued to the present day. Click here to see maps of current radiosonde station locations in the United States.
World War II increased the needs for upper-air data and accelerated the development of radiosonde components and the growth of observational networks. Furthermore, advances were made in radio-direction finding or radio-theodolite technology that allowed the radiosonde to be tracked in flight so that winds aloft could be obtained. Such observations became known as "rawinsonde" observations. Initially, radio-theodolites were adjusted by hand to track the in-flight radiosonde, but by the 1950s automated radio-theodolites (ART) were implemented, which are still used today.
The early rawinsonde stations lacked computerized data processing systems, which resulted in a significant amount of manual labor and time needed to process and disseminate the upper-air data. The observation process was generally a two-person effort. However, a third person was frequently involved for quality control, general oversight of procedures, and assistance during periods of difficult weather or data analysis conditions.
It should also be noted that after World War II scientists and engineers developed Sounding Rockets, which provide scientific data well beyond the reach of balloons and into outer space. This program continues today.
That is correct. Only surface maps til around the late 1940s as I recall.
I think that the 500 mb maps would be more interesting for 4/25/1910 as I have long suspected a vigorous closed upper level low caused this, which may not have reflected too well at the sfc.
Larry that is exactly what I was thinking about a 500 mb low that no way they could have detected over a century ago. I think that I might have updated that last post when you were typing your new one.
I really enjoyed the weather history on this thread
In our operation planting/spraying /harvesting etc. crops with out weather information would really be different to what we take for granted
Old timers would look for signs of coming weather which I suppose was an educated guess over yrs of observation and old time myths
I know when the leaves of certain trees turned over that was supposed to mean something, but modern weather for cast is so much better, even if not perfect, still told us to expect cold for this time frame, which meant park the corn planter in the shed, and keep it dry
3" of wet, cold snow and cold tonite also. A week for snow to disappear and warm up soil conditions around this location, I expect
Going to be normal [for us] planting date. No early corn planting for us. We looked at weather forcast and made the decision to wait
Tks very much for the history of weather
Glad that you enjoyed it Wayne! A farmer for more than 50 years like you, living by the weather would definitely have followed it closely for longer than anybody!
The technology today, just compared to when I first started practicing professional meteorology, in 1982 is incredible.
Back then, we had one, main short range forecasting model, the LFM(Limited Fine Mesh) out to 48 hours.....and it only showed the United States.
Then we had the more global spectral model that went out to 72 hours and mainly just a 60 and 72 hour upper level plot.
They came out every 12 hours and you had to have a satellite dish on your roof to get this data and pay some decent money for it because there was no internet.
Now we have several global models from different countries going out 2 weeks, with the US model coming out every 6 hours with tons of detailed elements shown.
And all of them delivered to you conveniently on your computer, Ipad or cell phone screen if you hook up to the internet.
https://en.wikipedia.org/wiki/History_of_numerical_weather_prediction
Weather forecasting thru the ages
https://earthobservatory.nasa.gov/features/WxForecasting/wx2.php
https://www.softschools.com/facts/weather_instruments/weather_balloons_facts/3123/
Hey Larry,
I haven't been able to confirm it with the records, but it appears that Evansville also may have received some measurable snow on April 24/25 1910 from the same event that you mentioned!
So yesterday was a MODERN DAY record and the 2nd latest snow date ever going back to 1880.
It was colder in the 1800's, so if we could go back another 100 years, I would bet we would find that there were several snow events even later than this.
Meteorologist Mike
They also had shorter growing seasons and frequent crop failures,especially in the higher latitudes before we had the beneficial warming that defines the current much better for crops/plants(and most life) climate change regime.