Advertised pattern change about to start.
Heat ridge backs up west, rains get skinnier.
Forecast for rains below:
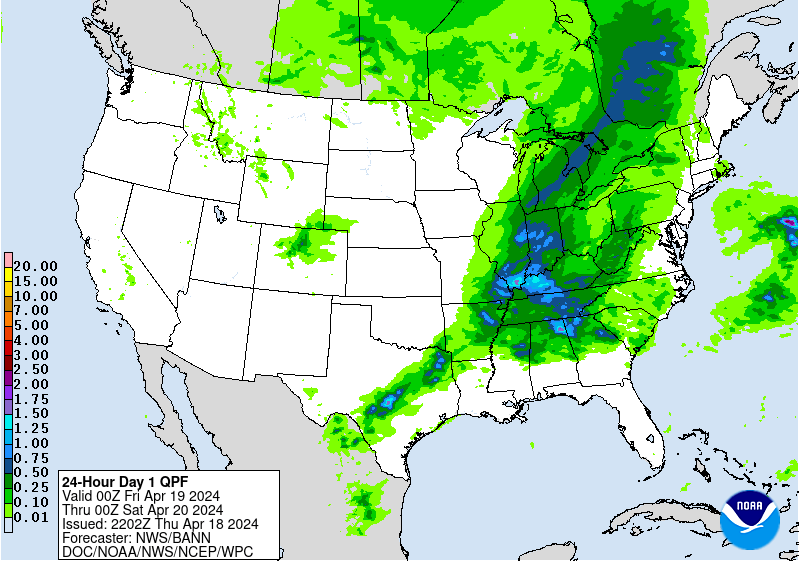
Day 1:
http://www.wpc.ncep.noaa.gov/qpf/fill_94qwbg.gif?1526306199054
 |
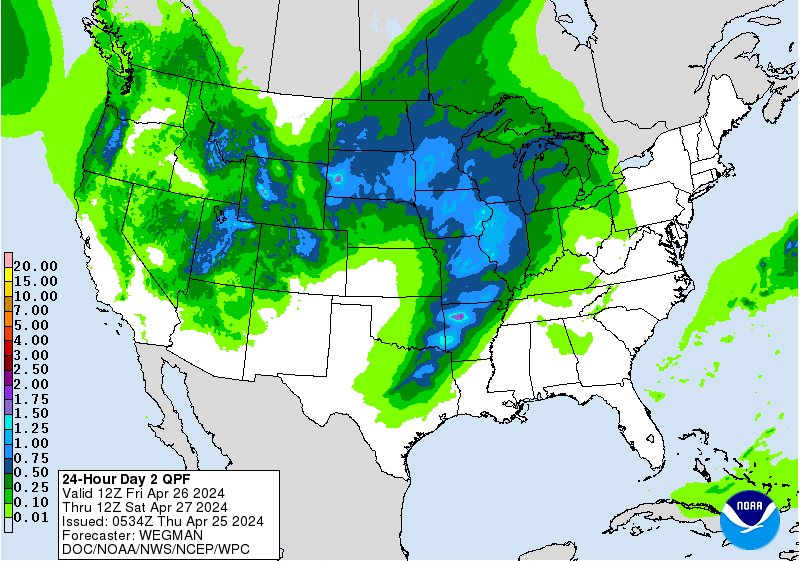
Day 2:
http://www.wpc.ncep.noaa.gov/qpf/fill_98qwbg.gif?1528293750112
 |
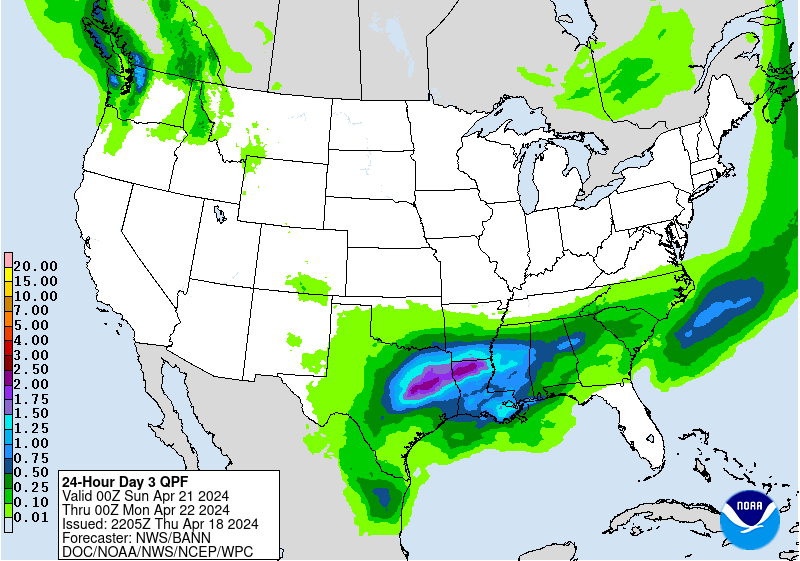
Day 3:
http://www.wpc.ncep.noaa.gov/qpf/fill_99qwbg.gif?1528293842764
 |
Days 4-5:
http://www.wpc.ncep.noaa.gov/qpf/95ep48iwbg_fill.gif?1526306162
Days 6-7:
http://www.wpc.ncep.noaa.gov/qpf/97ep48iwbg_fill.gif?1526306162
Days 4-5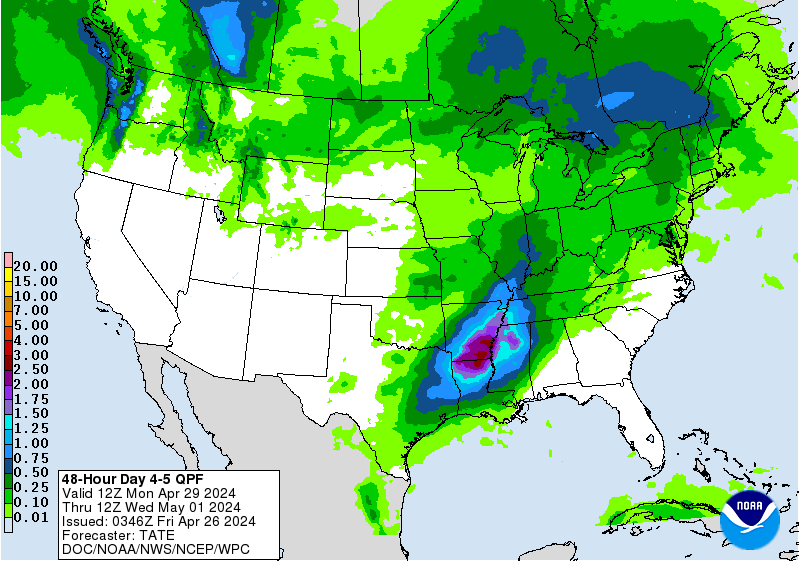 Valid 12z 07/06/18 - 12z 07/08/18 [contours only] | Days 6-7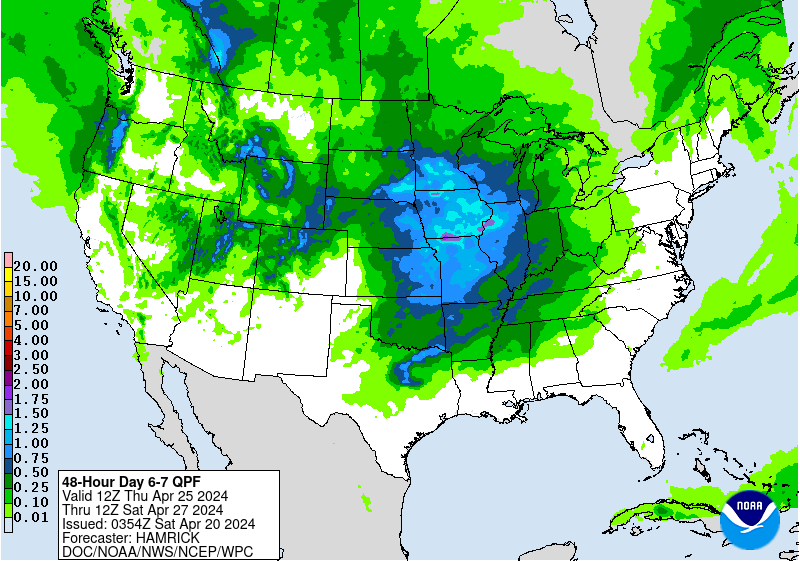 Valid 12z 07/08/18 - 12z 07/10/18 |
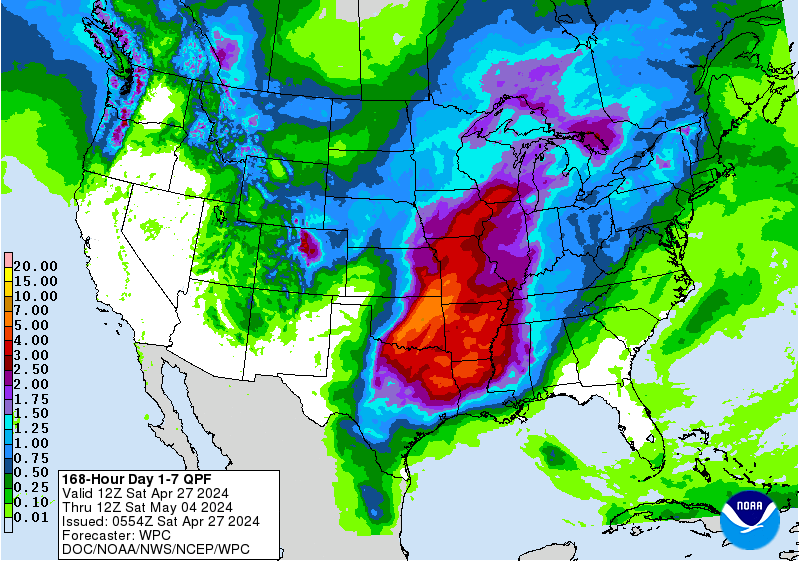
Total accumulation
http://www.wpc.ncep.noaa.gov/qpf/p168i.gif?1526397762
Severe Storm Risk. Plains and Upper Midwest. Push your cursor on the map for full screen.
https://www.spc.noaa.gov/products/outlook/
Current Day 1 Outlook | Forecaster: Hart/Kerr Issued: 18/1240Z Valid: 18/1300Z - 19/1200Z Forecast Risk of Severe Storms: Slight Risk |
Current Day 2 Outlook | Forecaster: Bunting Issued: 18/0600Z Valid: 19/1200Z - 20/1200Z Forecast Risk of Severe Storms: Marginal Risk |
Current Day 3 Outlook | Forecaster: Bunting Issued: 18/0731Z Valid: 20/1200Z - 21/1200Z Forecast Risk of Severe Storms: Marginal Risk |
Current Day 4-8 Outlook |
Most weather maps on MarketForum are updated constantly, from radar images every few minutes to daily precip/models. This causes descriptions of some of the maps to be outdated later on or the next day. Every day, we just start over again with new descriptions and new maps. Please enjoy the comprehensive coverage of your weather here!
High Temperatures today and wednesday, hot in much of the country...cool N.Rockies.


Highs days 3-7 shows The most intense Heat backing up..... but still very warm/hot in most places.


How do these temperatures compare to average at this time of year:
High temperature departures:

Low Temperature Departures:

From the GFS ensemble mean products. Temperature anomalies for Tuesday.

Temperature anomalies at the end of week 2.....most intense heat shifted west.

Last operational 6z GFS has an extremely deep trough in the Midwest/East.
The models have not had alot of consistency on the amplitude of the week 2 pattern......but they mostly agree on heat ridge-west..........trough-east.
 | gfs_namer_360_500_vort_ht |
gfs_namer_360_1000_500_thick | gfs_namer_360_850_temp_ht |
Last European model:
Canadian ensembles still have a few members below with a bullish dome farther east:
384h GZ 500 forecast valid on Jul 19, 2018 00 UTC


Forecasts for the control (GEM 0) and the 20 ensemble members (global model not available)
NWS guidance for 8-14 day forecast for this afternoon(sneak peak at what it will show). Very Warm across the country but this tool shows much more precip than before...........from ridge riders???
Precip below:
CFS week 3 and 4. 
Precip below

Satellite picture.

Rains the past 24 hours. N.Plains and Upper Midwest.
![]()
You can go to this link to see rain totals from recent time periods:
https://water.weather.gov/precip/
Go to precipitation, then scroll down to pick a time frame. Hit states to get the borders to see locations better. Under products, you can hit "observed" or "Percent of normal".
This is typical dry for us in July
Some chance of rain but not holding my breath
90% chance keeps getting smaller chance as time comes closer
Our corn is starting to show effects of drought
1st planted has stronger root system, even though it needs more water
but last planted looks bad
Your map shows chance of rain for us
Hope it happens
I would be lost with out your daily maps
Tks once again Mike
You are very welcome Wayne!
Extreme weather days 3-7:
The intense heat is farther west.

NWS extended maps: Above temps, below rain in the Cornbelt........same as the previous 10 days of extended maps..........though the latest guidance is cooling things off later in week 2, more than these maps show.
Temperature Probability 6-10 day |
Precipitation Probability |
Temperature Probability 8-14 day |
Precipitation Probability |
https://www.atmos.illinois.edu/~snodgrss/Ag_Wx.html metmike, here is some stuff from eric Snodgrass, University of Illinois
Thanks mcfarm,
I can use some of that stuff!


![[contours only]](http://www.wpc.ncep.noaa.gov/qpf/95ep48iwbg.gif?1530626894)