Ima gonna have to learn to save images of these maps. It changed to much warmer in the last hour. Open down tonight.

You nailed that one Mark!
We saw a massive gap lower on the open. Unless the models show a big change to colder, this should be a bearish/downside breakaway gap.
Previous ng thread.
https://www.marketforum.com/forum/topic/60537/
Natural gas futures traded sharply lower early Monday as the latest forecasts lowered weather-driven demand expectations and signaled that mild weather could stretch into early December. The December Nymex contract was off 15.1 cents to $2.844/MMBtu at around 8:40 a.m. ET. Weather data was “decidedly” bearish trending over the weekend, with forecast demand dropping compared…
November 16, 2020
metmike: Breakaway downside gap on the charts last night. Extremely bearish with huge downside potential if the forecasts stay mild for the rest of the month.
Bullish fundamentals outside of weather though, so when the forecast shifts much colder, things will reverse strongly upward.
I think that if the European model comes in colder than the NOAA model, it will run up hard.
And when it comes out warmer, we accelerate on the downside!
Despite robust export demand, bearish weather patterns and increased production weighed down natural gas futures on Monday. The December Nymex contract dropped 29.8 cents day/day and settled at $2.697/MMBtu to start the trading week. January fell 25.8 cents to $2.864. NGI’s Spot Gas National Avg. rose 3.0 cents to $2.630, as demand in the Northeast
Coming off a dramatic sell-off in the previous session, natural gas futures held their ground early Tuesday, although bearish themes continued in the latest forecasts. The December Nymex contract was up 1.2 cents to $2.709/MMBtu at around 8:45 a.m. ET. The temperature outlook to start the winter heating season has been thoroughly disappointing from the…
November 17, 2020
metmike: Still mild temps out 2 weeks.
Well, the weather map sure hasn't changed. Is there anything in the AO that could lend a clue as to when an arctic cold air mass may drop?
No sign of any cold as far as the maps go out Mark.
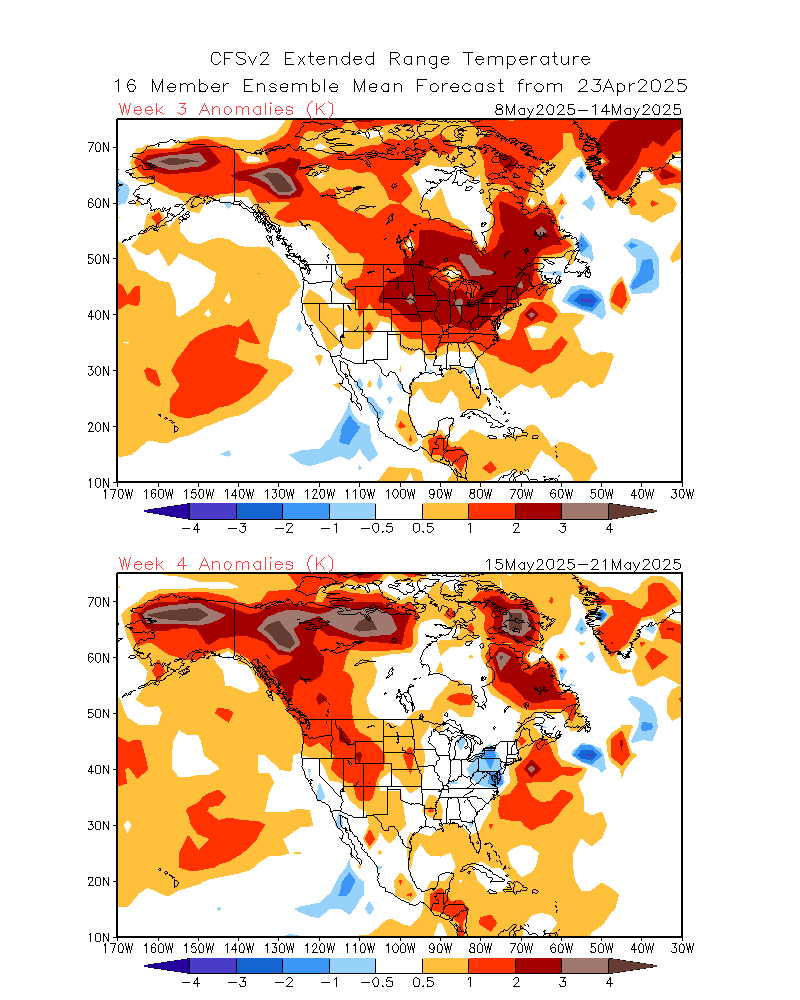
Even the week 3-4 maps look extremely mild:
Surprise!
The very early morning European model was colder(not as mild)!
Wednesdays weather:
https://www.marketforum.com/forum/topic/61339/
Last EIA report:
![]()
for week ending November 6, 2020 | Released: November 13, 2020 at 10:30 a.m. | Next Release: November 19, 2020
+8 BCF............Bearish vs expectations
| Working gas in underground storage, Lower 48 states Summary textCSVJSN | |||||||||||||||||||||||||
|---|---|---|---|---|---|---|---|---|---|---|---|---|---|---|---|---|---|---|---|---|---|---|---|---|---|
| Historical Comparisons | |||||||||||||||||||||||||
| Stocks billion cubic feet (Bcf) | Year ago (11/06/19) | 5-year average (2015-19) | |||||||||||||||||||||||
| Region | 11/06/20 | 10/30/20 | net change | implied flow | Bcf | % change | Bcf | % change | |||||||||||||||||
| East | 942 | 947 | -5 | -5 | 932 | 1.1 | 912 | 3.3 | |||||||||||||||||
| Midwest | 1,127 | 1,119 | 8 | 8 | 1,107 | 1.8 | 1,094 | 3.0 | |||||||||||||||||
| Mountain | 243 | 240 | 3 | 3 | 207 | 17.4 | 216 | 12.5 | |||||||||||||||||
| Pacific | 322 | 320 | 2 | 2 | 291 | 10.7 | 316 | 1.9 | |||||||||||||||||
| South Central | 1,293 | 1,293 | 0 | 0 | 1,195 | 8.2 | 1,212 | 6.7 | |||||||||||||||||
| Salt | 345 | 348 | -3 | -3 | 310 | 11.3 | 335 | 3.0 | |||||||||||||||||
| Nonsalt | 948 | 945 | 3 | 3 | 885 | 7.1 | 877 | 8.1 | |||||||||||||||||
| Total | 3,927 | 3,919 | 8 | 8 | 3,731 | 5.3 | 3,751 | 4.7 | |||||||||||||||||
Totals may not equal sum of components because of independent rounding. | |||||||||||||||||||||||||
Working gas in storage was 3,927 Bcf as of Friday, November 6, 2020, according to EIA estimates. This represents a net increase of 8 Bcf from the previous week. Stocks were 196 Bcf higher than last year at this time and 176 Bcf above the five-year average of 3,751 Bcf. At 3,927 Bcf, total working gas is within the five-year historical range.
For information on sampling error in this report, see Estimated Measures of Sampling Variability table below.

Note: The shaded area indicates the range between the historical minimum and maximum values for the weekly series from 2015 through 2019. The dashed vertical lines indicate current and year-ago weekly periods.
https://www.investing.com/economic-calendar/natural-gas-storage-386
Latest Release Nov 13, 2020 Actual8B Forecast-3B Previous-36B
| Release Date | Time | Actual | Forecast | Previous | |
|---|---|---|---|---|---|
| Nov 19, 2020 | 10:30 | 8B | |||
| Nov 13, 2020 | 10:30 | 8B | -3B | -36B | |
| Nov 05, 2020 | 10:30 | -36B | -26B | 29B | |
| Oct 29, 2020 | 09:30 | 29B | 37B | 49B | |
| Oct 22, 2020 | 09:30 | 49B | 52B | 46B | |
| Oct 15, 2020 | 09:30 | 46B | 55B | 75B |
7 day temperatures for last Thursdays EIA report:
Very warm, West to Midwest vs average. Cool Southeast..............vs average.
Temperatures for tomorrow's EIA report.
Near record warmth East. An injection in mid November is bearish but the market already knew about and traded this weather a long time ago.
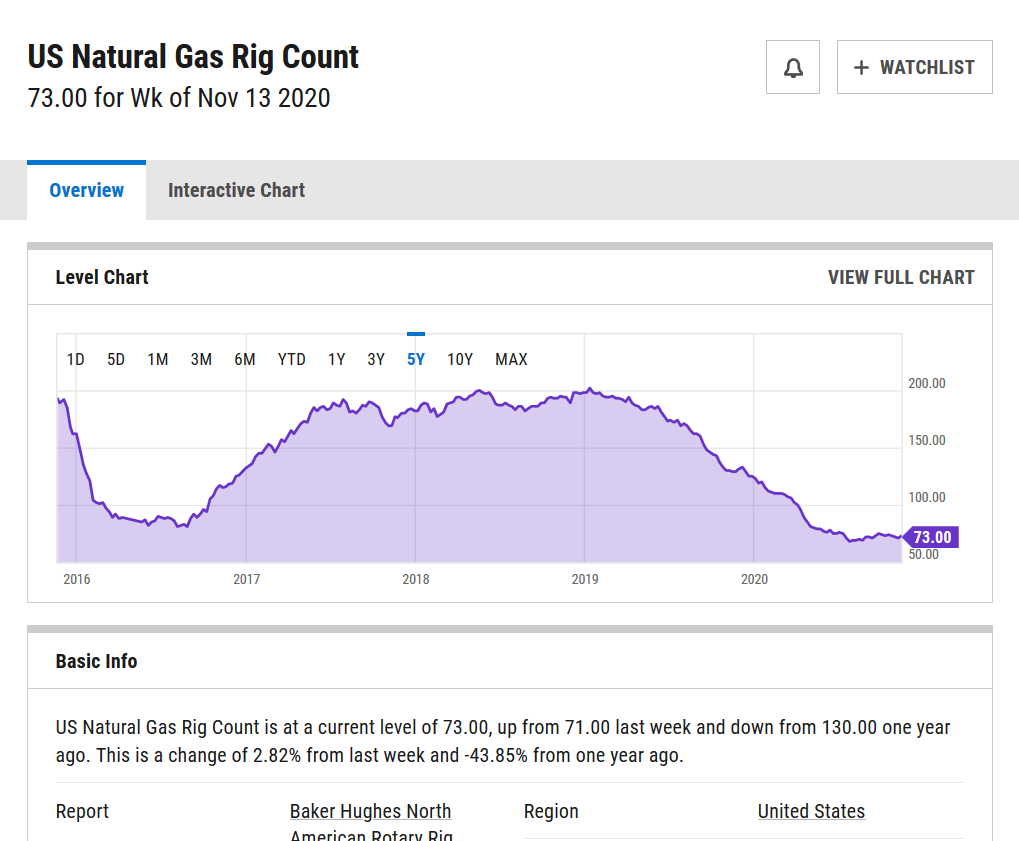
metmike: NG rig count still below the previous record low of 83 rigs from August 2016.
https://ycharts.com/indicators/us_gas_rotary_rigs
Thursday early:
November 19, 2020
![]()
for week ending November 13, 2020 | Released: November 19, 2020 at 10:30 a.m. | Next Release: November 25, 2020
+31 BCF Bearish!!!!
| Working gas in underground storage, Lower 48 states Summary text CSV JSN | |||||||||||||||||||||||||
|---|---|---|---|---|---|---|---|---|---|---|---|---|---|---|---|---|---|---|---|---|---|---|---|---|---|
| Historical Comparisons | |||||||||||||||||||||||||
| Stocks billion cubic feet (Bcf) | Year ago (11/13/19) | 5-year average (2015-19) | |||||||||||||||||||||||
| Region | 11/13/20 | 11/06/20 | net change | implied flow | Bcf | % change | Bcf | % change | |||||||||||||||||
| East | 953 | 942 | 11 | 11 | 916 | 4.0 | 902 | 5.7 | |||||||||||||||||
| Midwest | 1,139 | 1,127 | 12 | 12 | 1,080 | 5.5 | 1,086 | 4.9 | |||||||||||||||||
| Mountain | 241 | 243 | -2 | -2 | 206 | 17.0 | 215 | 12.1 | |||||||||||||||||
| Pacific | 319 | 322 | -3 | -3 | 291 | 9.6 | 315 | 1.3 | |||||||||||||||||
| South Central | 1,306 | 1,293 | 13 | 13 | 1,173 | 11.3 | 1,208 | 8.1 | |||||||||||||||||
| Salt | 350 | 345 | 5 | 5 | 303 | 15.5 | 335 | 4.5 | |||||||||||||||||
| Nonsalt | 956 | 948 | 8 | 8 | 870 | 9.9 | 873 | 9.5 | |||||||||||||||||
| Total | 3,958 | 3,927 | 31 | 31 | 3,665 | 8.0 | 3,727 | 6.2 | |||||||||||||||||
Totals may not equal sum of components because of independent rounding. | |||||||||||||||||||||||||
Working gas in storage was 3,958 Bcf as of Friday, November 13, 2020, according to EIA estimates. This represents a net increase of 31 Bcf from the previous week. Stocks were 293 Bcf higher than last year at this time and 231 Bcf above the five-year average of 3,727 Bcf. At 3,958 Bcf, total working gas is within the five-year historical range.
For information on sampling error in this report, see Estimated Measures of Sampling Variability table below.
Note: The shaded area indicates the range between the historical minimum and maximum values for the weekly series from 2015 through 2019. The dashed vertical lines indicate current and year-ago weekly periods.
https://prc.investingchannel.com/#/dashboard
Latest Release Nov 19, 2020 Actual 31B Forecast 15B Previous 8B
| Release Date | Time | Actual | Forecast | Previous | |
|---|---|---|---|---|---|
| Nov 19, 2020 | 10:30 | 31B | 15B | 8B | |
| Nov 13, 2020 | 10:30 | 8B | -3B | -36B | |
| Nov 05, 2020 | 10:30 | -36B | -26B | 29B | |
| Oct 29, 2020 | 09:30 | 29B | 37B | 49B | |
| Oct 22, 2020 | 09:30 | 49B | 52B | 46B | |
| Oct 15, 2020 | 09:30 | 46B | 55B | 75B |
The U.S. Energy Information Administration (EIA) on Thursday reported an injection of 31 Bcf into natural gas storage for the week ending Nov. 13. The result exceeded the midpoint of analysts’ bearish estimates and punctuated market concerns about weak weather demand, keeping pressure on Nymex natural gas futures. “It was warmer than normal over the…
By Kevin Dobbs
November 19, 2020
By Kevin Dobbs
November 19, 2020
Just wait til La Nina gets here. lol
Did the European models just come out at 11:30pm est our time? If so, damned inconsistant of them.
Mark,
That is closer to when the GFS/American model guidance comes out.
The La Nina has been affecting the weather since early in the Summer and maybe before then.
Its not officially declared by NOAA until being there for 3 months straight, which was in September but the atmosphere does not wait for NOAA to tell it those conditions were there. It responds immediately to Pacific Ocean water temperatures and they were cooling already back in the late Spring to the point where they started affecting our weather downstream in the US.
The wildfires in the West got blamed on climate change(as usual) because of the drought out there and nobody told us the drought out there was caused by the natural La Nina.
"Climate Fires" they were called.
Crazy world we live in.
I explain the real reasons (La Nina):
California governor blames wildfires on climate 'emergency'
33 responses |
Started by metmike - Sept. 14, 2020, 12:08 a.m.
https://www.marketforum.com/forum/topic/59093/
La Niña has formed
6 responses |
Started by metmike - Sept. 11, 2020, 11:32 a.m.
https://www.marketforum.com/forum/topic/59007/
My Summer Forecast/La Nina this Summer!
39 responses |
Started by metmike - May 23, 2020, 11:33 p.m.
https://www.marketforum.com/forum/topic/52701/
West Coast/Oregon fires
20 responses |
Started by metmike - Sept. 12, 2020, 2:48 a.m.
With weather models teasing the prospect of some cooler temperatures reaching the eastern Lower 48 next month, natural gas futures pared their losses in early trading Friday. After falling 12.0 cents in the previous session, the December Nymex contract was up 7.3 cents to $2.665/MMbtu at around 8:45 a.m. ET. In terms of projected demand,…
November 20, 2020
Winter WILL come....it is inevitable.
The actual EIA was a whopping 21 bcf to the bearish side of the mean WSJ survey mean. that was the most bearish in that way of measuring since way back on 12/28/18! However, I do think the average guess of +10, which was a mere 2 bcf higher than the actual of last week, was clearly too low based on the Fr-Thu drop in HDD of 24. What were the guessers thinking?
Thanks Larry,
We put in a spike low that was the low for the week and are closing closer to the high today(probably because the 12z EEnsemble has 8 more HDD's).
All the NWS human created maps show it very mild, even the 3 and 4 week forecast. However:
https://www.marketforum.com/forum/topic/61339/
Re: Re: Re: Re: Re: Weather November 18, 2020
By metmike - Nov. 20, 2020, 12:17 p.m.
" Ridge West, Trough East couplet may be forming and amplifying in week 2 which could signal a pattern change to colder in the Eastern half of the country in week 2 and beyond."
I have not updated the weather page but just make this comment.........and its very speculative/uncertain.
Temps are turning cooler in the SE.
Yes Mark and the NWS outlook is behind the models and pattern change.
My confidence is going up rapidly of the pattern change to a ridge/West, trough/East couplet amplifying in early December.
Initially, there may not be a great deal of cold to tap into. This is a La Nina signature.
It means no help for the drought in the West.
El Nino's bring wet Winters out there and often wet weather to the US any time of year.
La Nina's are often dry and associated with most droughts. We often see the ridge west and trough east pattern. The atmospheric river from the tropical jet stream associated with heavy rains and energized by El Nino's is blocked by the ridge in the West.
La Nina's are from COLD water in the tropical Pacific. Global warming cannot cause cold water in the tropical Pacific. We are hearing this drought and the wildfires or "climate fires" are from global warming/climate change.
This is not true. It's the exact opposite.
Global warming causes more El Ninos, more rain and less drought in the US.
This is the current La Nina(the blue in the East/Central tropical Pacific):
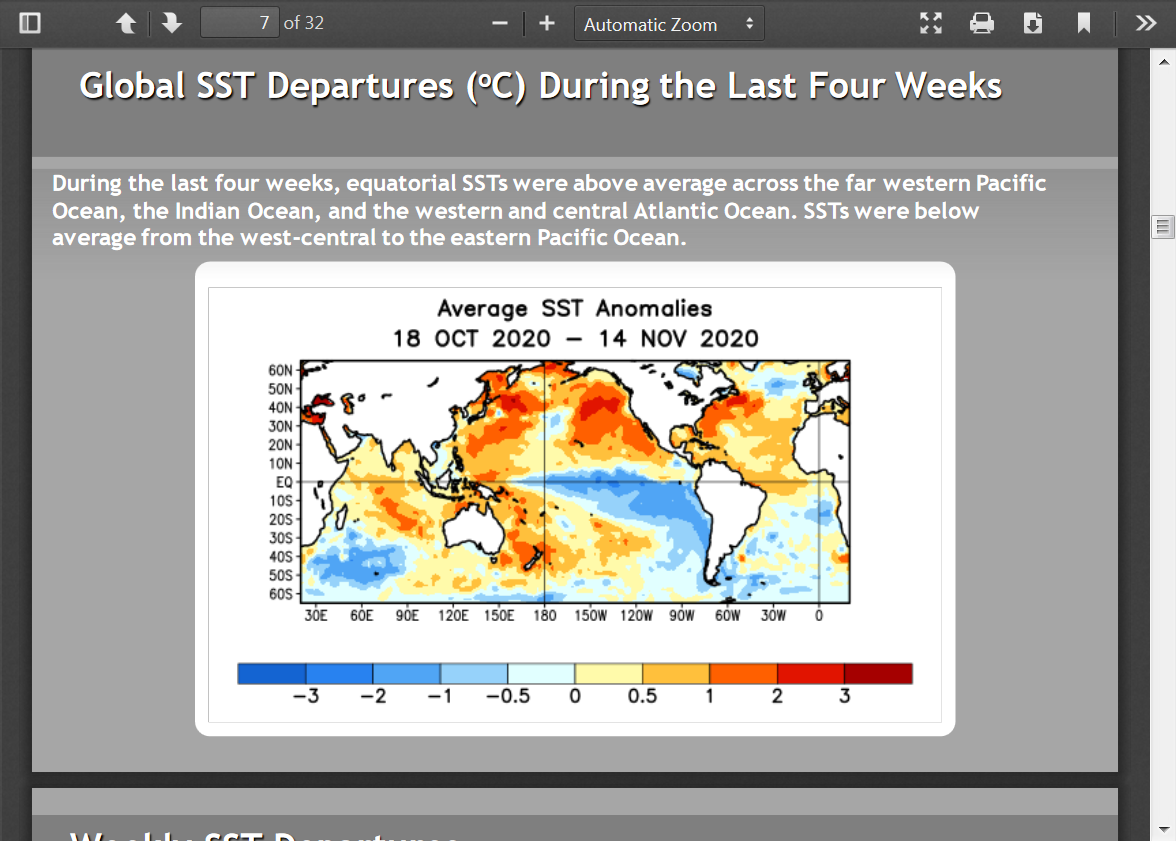
.png)
From these maps, it would seem that all the cold water is mostly south of the equator. Leaving warmer water north. Which means higher air temps in the streams in the northern hemisphere.
Those warm anomalies represent 1 deg. C above average in the surface water so yes air masses in the northwest US to western Canada and Alaska with origins from that location will even milder than usual.
Those oceanic air masses usually feature pretty mild air in the Winter when we have zonal, west to east flow.
When the flow is more meriodianal, north to south, then it comes from higher latitudes where there has been less daylight and longs nights that brew colder and colder air over land......until it gets displaced southward.
Southerly flow obviously taps into warmer air and more moist if it’s from the gulf.
NG should gap higher on the open
December NG expires on Wednesday. We often see wild spikes close to expiration at this time of year.
Worst case scenario at this point? The weather models warm back up. JMHO
Mark,
Still looks like we are gradually morphing colder to the ridge/west, trough/east configuration in early December but there won't be a great deal of cold air to tap into.
This weeks EIA should be another bearish one compared to that week historically. It was a bit chilly in the Northeast but very mild in the center of the country.
It will be released on Wednesday this week because of Thanksgiving, the same day as expiration. Last I read, some weeks ago, funds had a record long position. Not sure if that plays a role here. Might depend on Open Interest in the front month, December contract.
1. In 2016, we topped out at 4.047 BCF
2. In 2015, we topped out at 4.009 BCF
3. In 2020, we have 3,958 BCF in storage. This puts us at the 3rd highest in history for this date.
4. Passing up 2012 which topped out at 3,928 BCF.
https://www.eia.gov/dnav/ng/hist/nw2_epg0_swo_r48_bcfw.htm
.png)
Heading into what analysts see as a potentially volatile week of trading going into the Thanksgiving holiday, natural gas futures climbed early Monday amid expectations for some colder temperatures next week. The December Nymex contract was up 4.4 cents to $2.694/MMBtu at around 8:50 a.m. ET. January was up 3.8 cents to $2.808. The near-term…
November 23, 2020
metmike: Still confident in the ridge/West, trough/East pattern change coming up but this is why its not initially very bullish.
1. As mentioned before, it will not access very cold air initially because the ridge will be a mid latitude ridge, not a high latitude ridge. To have very cold air in a ridge/trough couplet, the high latitudes must be involved. It's there, when you get air going from from north to south, that transports the real cold thats been brewing in the north from reduced daylight hours.
2. Initially, the ridge will be a bit farther east, in the Plains than is ideal and as more of a mid latitude ridge, will actually cause unseasonable, to record warmth in S.Canada/N.US Plains, so cold fronts coming from that region, will not be very cold at all like they would usually be at this time of year. This, again is related to #1. Until we get the upper level ridge to amplify to, at least Central Canada but mainly Northern Canada, it won't be a source for very cold air downstream. Temps can be a bit below normal in the East, especially the Southeast for a few days with this pattern because the air, downstream of the ridge will be coming from S.Canada with a northerly component in the steering currents but it will be modest cold at best.
The upper level anomaly below(from the 11-23-20 0z run GFS ensemble) depicts this exactly.
We need that impressive positive anomaly to amplify north by 1,000 miles..........then it will be a source of COLD air, not mild air. The farther north that it amplifies, the colder the air will be downstream!!!
Mike,
I'm sure you know that all models at 12Z are significantly colder than 0Z /quite bullish for NG allowing it to now be at session highs. GEFS 13-14 HDD colder and EPS 11 HDD colder. Pretty rarely do we see BOTH cool off that much from 0Z to 12Z. Today's 12Z EPS is ~20 HDD colder than the 0Z of Fri run just for the common days. And it is even quite a bit colder than that when looking at the entire run as the Fri 0Z run was vs normal -37 HDD while today's 12Z is only -6! The 12Z CDN ens was also colder than its 0Z.
Classic +PNA/Canadian blocking, which is what these models have in week 2, is as Mike knows about the most efficient pattern to get it cold deep into the SE US, which is one of the more populous regions for NG demand. When it gets cold in the SE US, a lot of NG is used partially because we're not used to cold and tend to use a lot of heat per HDD. Note that much of Canada is solidly warmer than normal, a Canadian blocking pattern. If one were to look back in history, they'd find that many of the coldest US periods had a warmer than normal Canada. That's because the cold air is blocked in Canada and forced down below it into the US. In actuality, it isn't warmer in Canada as their normals are much colder. But when that Canadian air is forced south where normals are much warmer, the anomalies become much colder.
Also, much of the NE and Midwest is now near normal vs the warmer than normal on Friday's runs/forecasts.
So, we've gone from a near nationwide warmer than normal US outlook as of Friday's forecast to now a BN to MBN SE (also TX is pretty cold) and near normal NE/much of Midwest outlook at 12Z today, which is obviously a very bullish wx change for NG.
What's interesting as Mike knows is that this +PNA is typical of an El Nino, not of a moderate to strong La Nina like we have now!
12Z EPS 11-15 day temperature anomalies : compare this to FRI at 0Z, which had no colder than normal and more widespread warmer than normal as well as stronger warm anomalies in many areas

Some excellent points in there about cool anomalies in the deep South, feeling like COLD would to folks in the north.
On this current pattern. I think that it has limited bullish potential until the La Nina ridge amplifies farther north. The source region for the "cold" in Canada will be at near record warmth levels. As it travels into the Midwest, it will be pretty mild, then gradually feel colder based on it hitting areas that consider mild temps in Canada(where it came from) to be chilly.
This is not the recipe for market moving demand and big drawdowns.
Those come when Arctic air masses that feel cold to everybody, are bodily transported to large high population centers in the US(Midwest/East/South).
I believe strongly that this is a La Nina ridge even though I read in other places that this is an El Nino pattern. You mentioned that.
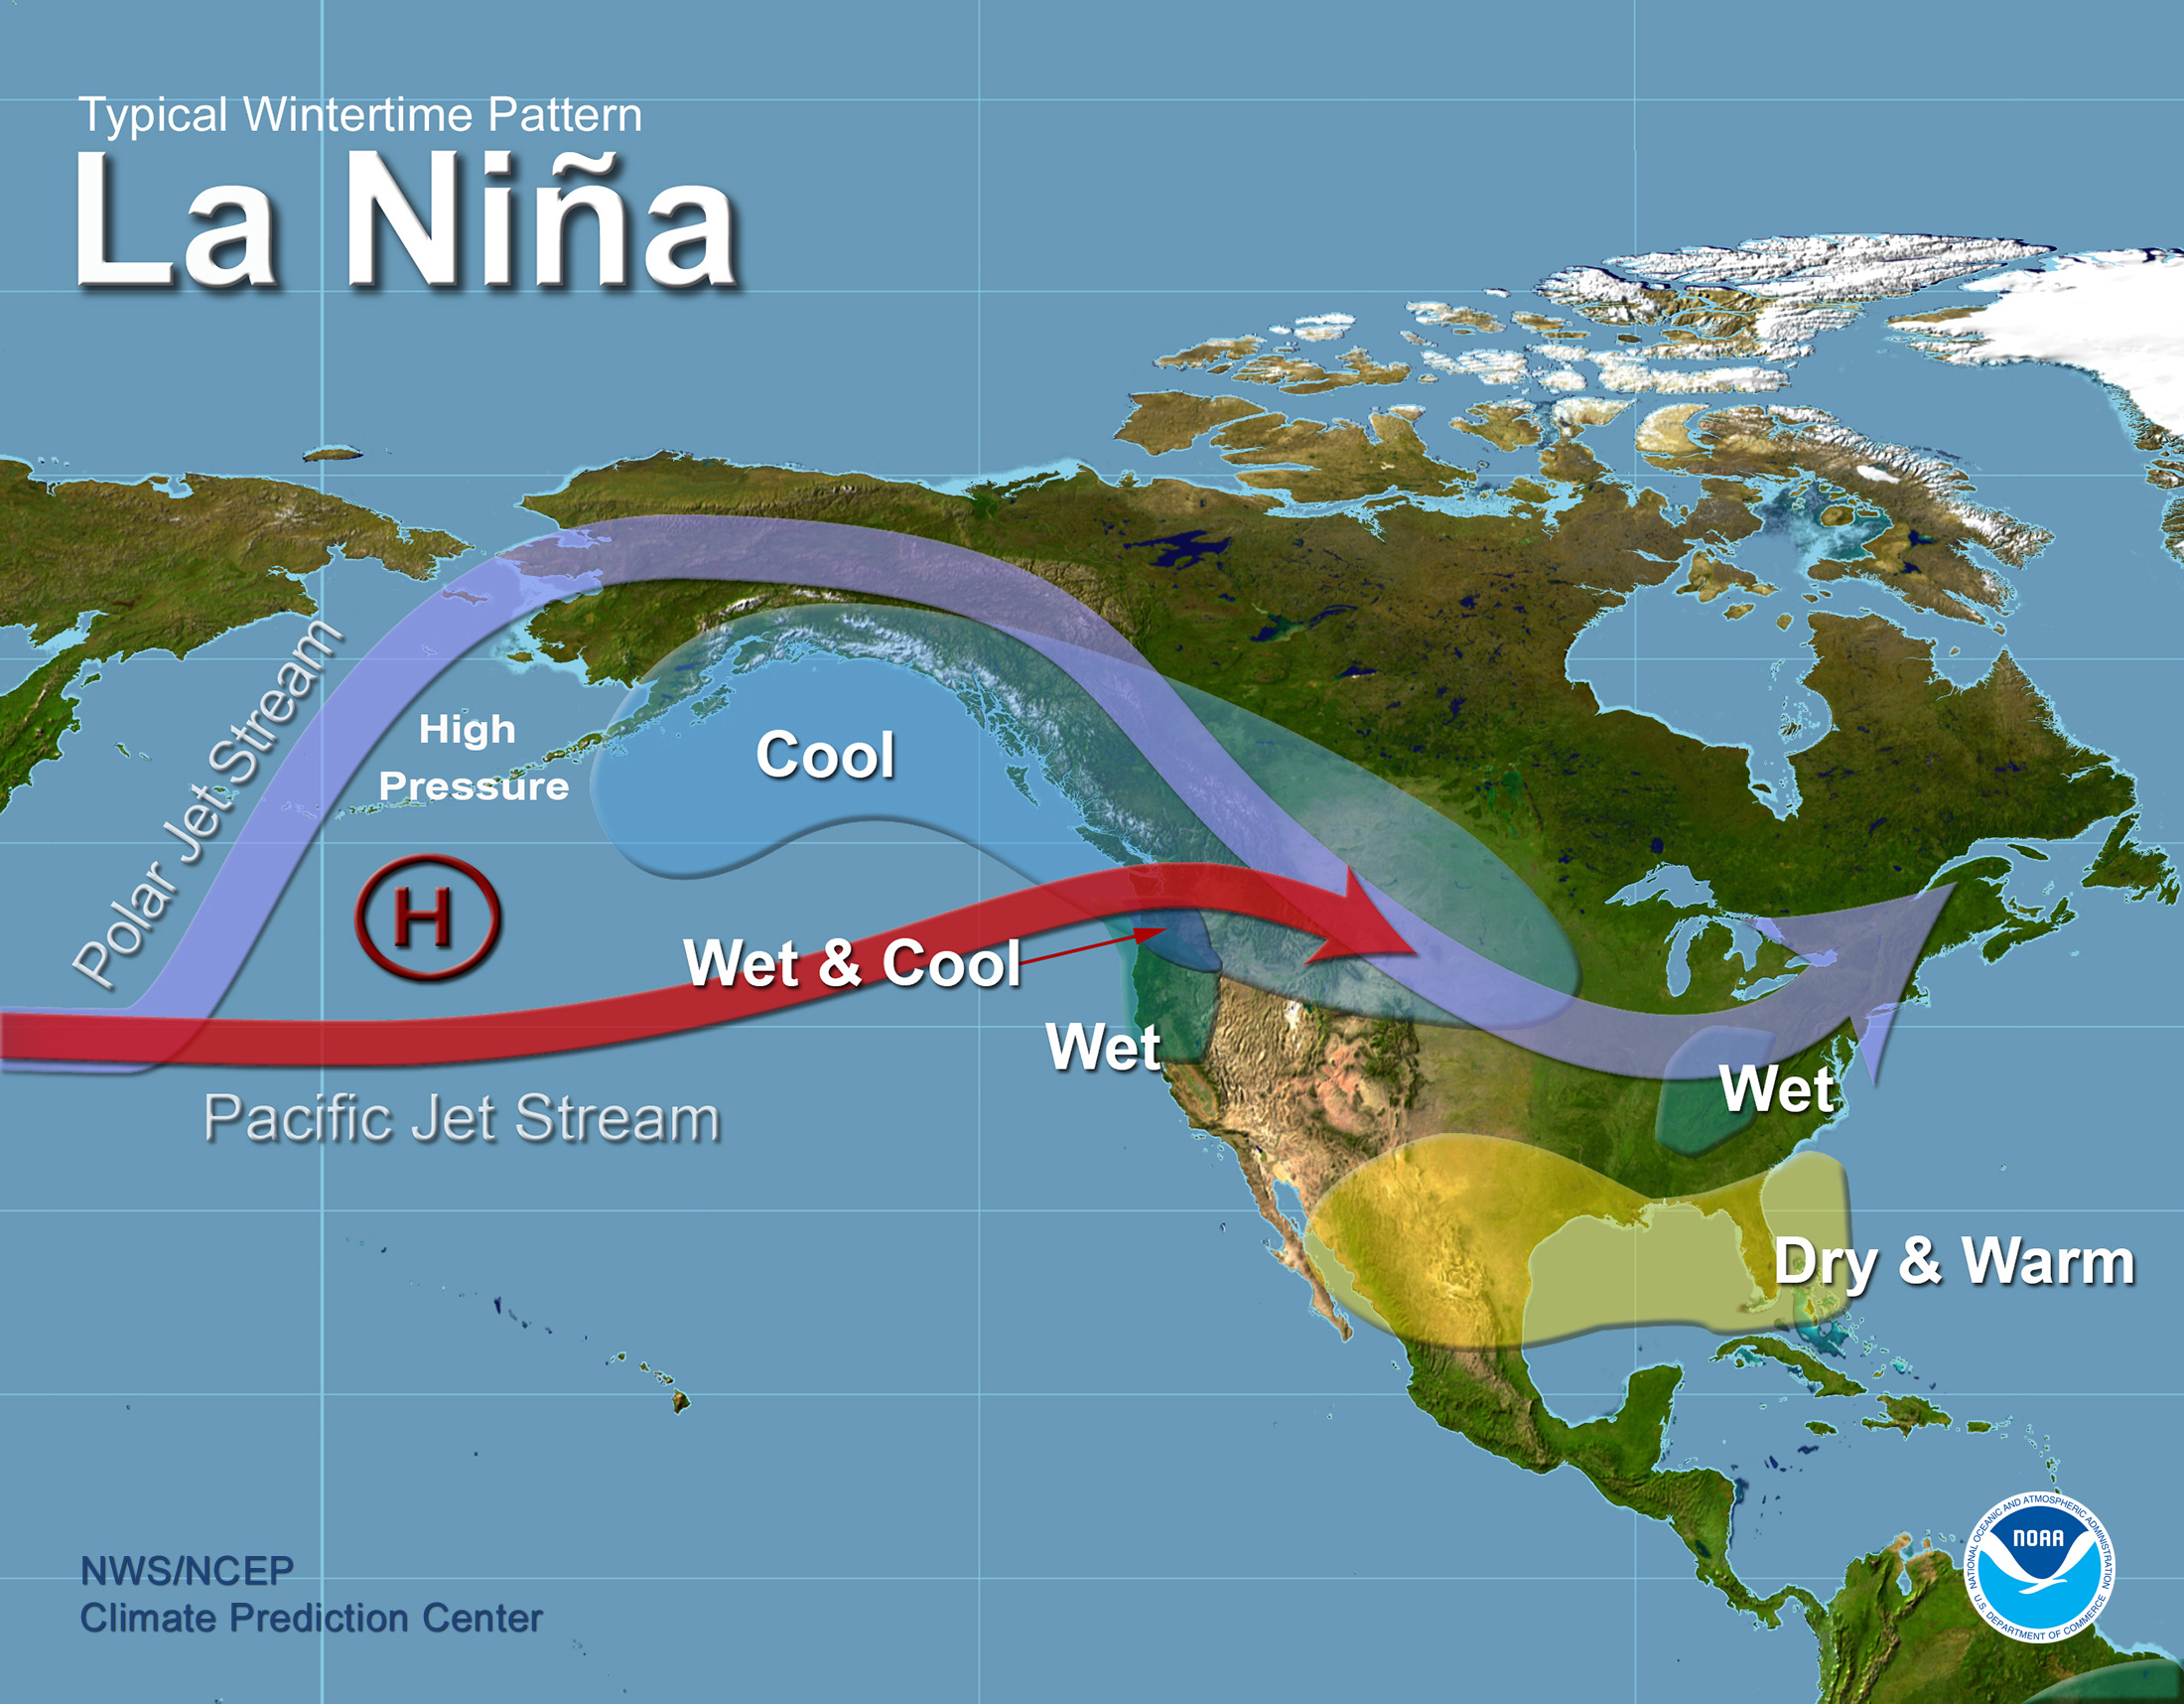
This is what a La Nina ridge looks like when we have a +AO and +NAO.
The mistake that many weather experts make is using an average of analog years of El Nino or La Nina and basing expectations of all of them on that.............as if the conditions in the east/central tropical Pacific control the entire atmosphere and everything on the rest of the planet bows down and obeys.
La Nina's cause ridging in the West and then, naturally troughing downstream. But there are a ton of factors that play a role in where this sets up(temps in the Pacific can be entirely different with each La Nina, other than that one key area has cold anomalies and the configuration of those temps, determines the track of the streams in the Pacific, which in turns determines where they "try to" shape a ridge down stream in Western North America.
In addition, you have an opposing force/resistance to this coming from the huge land mass of North America and even push back from the Atlantic. This can cause the La Nina forces coming in from the Pacific to get blocked and, instead of progressing eastward, they get pushed northward(path of least resistance). This causes the La Nina ridge to build northward, like we often see and like whats depicted above. This happens with a -AO and -NAO when you have a push from the north and back from the east, not allowing the La Nina ridge to get farther east than the West Coast, so it builds north.
Right now, we have a +AO and +NAO, the complete opposite of that and temps in the Pacific are not a typical La Nina(outside of the eastern tropics) so the La Nina ridge has no resistance going east and can flex itself much farther east than its typical position. See the anomaly map above.
Each La Nina is different. Many have similar features and affects but the downstream major weather features and patterns can vary by thousands of miles.
If/when we see the AO/NAO go from the current positive to negative, then we will see it block and force the energy in the Pacific, trying to follow the La Nina influence there to take on a different configuration downstream. This should build the ridge farther north and everybody will say "hey, it's the La Nina pattern!"
It is the La Nina signature in the atmosphere right now but some meteorologists will only see it when it confirms what they think its supposed to look like.
La Nina's are supposed to be cold in the NorthCentral US, not warm like the period coming up............if you go by the book and don't look at pattern recognition, using the big/entire picture.
You will always be warm under a La Nina ridge and colder east of that.
It's actually quite simple. We are just shifting the La Nina ridge farther east so the warm is farther east too............into the N.Plains/Canada, where people think it should be cold during a La Nina.
Look at the chart below and just imagine the same ridge being displaced farther east and not nearly so far north..............that's what we have right now.
I also noted the significant increase in HDD's in all the 12z models that you mentioned and the positive affect that it had in prices late morning/early afternoon.
The next 2 days could be unpredictable because Dec expires on Wednesday but to get a sustained rally with good upside, the rest of this month, I think we need some legit cold air. Not just chilly in the South by alot of cold sensitive folks standards, who want their thermostats a few degrees higher (and use more natural gas) than folks in the north.
Mike,
Thanks but I respectfully disagree with much of what you said in your last 2 posts
1. La Nina is typically associated with a frequent -EPO or -PNA ridge, which is what your La Nina diagram shows and leads to a cold Canada/W and N US:


2. In contrast, El Nino is typically associated with a frequent +PNA ridge like this and what the models are showing for early Dec (warm Canada and cold SE US) and which is typically ~2,000 miles E of where a -EPO ridge is:

3. The typical association of El Nino with a +PNA is documented in this NOAA paper:
From this,
"Because tropical heating can cause changes in the jet stream, it is not surprising that ENSO also has a relationship with the PNA, where La Niña can be associated with the negative state of the PNA, and El Niño is linked to the positive state of the PNA. This link doesn’t always occur (and it certainly didn’t this past winter), but they are correlated, which is why the images shown above have some similarities to ENSO (4).
4. You said:
"This is not the recipe for market moving demand and big drawdowns."
When we look for NG market moves, we look for big pattern changes/large DD changes. When you go from the near nationwide current and recent weeks' warmth/way below normal HDD to the potential of near to slightly above normal HDDs in week 2, that is the recipe for a potential market move, especially early in the season. You normally don't need to have a widespread major Arctic outbreak to move the market up. You normally need a big pattern change just like is being projected, which would result in a large increase in demand. It may not lead to "big" draws, but it would lead to much bigger draws than we've been having and vs what would have been the case with no pattern change.
Of course what the market actually does in each situation will vary widely due to a variety of factors. I'm talking potential.
5. You said:
"to get a sustained rally with good upside, the rest of this month, I think we need some legit cold air. Not just chilly in the South by alot of cold sensitive folks standards, who want their thermostats a few degrees higher (and use more natural gas) than folks in the north. "
It is also turning much colder than before in much of the NE and Midwest. So, they'll be using way more NG than before. Remember it is all about change and changes are being projected for there too.
Nobody knows if there will be a "sustained" rally. Regardless, to make money as a long, one wouldn't need a "sustained rally". One would just need a rally. And with it being early in the season, rallies on colder forecasts are more likely to occur and be stronger vs if it had been late in the season. You know this as much as anyone. I know this because you say this all the time!
By the way, the 18Z GEFS is a whopping 17 HDD colder than the 0Z GEFS. That is not a small projected demand change. Oh, and the new +PNAish pattern remains through the end of the run. So, it may even be longlasting. I'm mentioning this because you often emphasize the end of the runs.
Thanks for more good stuff Larry.
I see those points but the problem is that I don't see an El Nino signature in the current atmosphere. I see temperatures in the Pacific outside the El Nino/La Nina region that are likely causing the current jet stream configuration but no El Nino influence.
In the jet stream map below, I don't seen anything coming for the east/central tropics that would be a major feature or signature of an El Nino.
I agree that you can say that farther north, it looks more like an El Nino type pattern in many ways but how is El Nino causing this?
If we get a --NAO, it will back things up, buckle the current jet stream farther west, along with the ridging that amplifies farther west and north and suddenly it will look more like the La Nina pattern that we expect to have.
I am open to hearing more of your thoughts on this and can always learn a few things.
I too have noticed the increase in HDD's for 6 runs in a row now for the GFS ENS, adding up to alot.
.png)
Mike said:
"I agree that you can say that farther north, it looks more like an El Nino type pattern in many ways but how is El Nino causing this?"
------------------------------------------------------------
Hey Mike,
I think you're misunderstanding me. Maybe I'm not saying it well. This is what got the whole El Nino discussion started. I had earlier said:
"What's interesting as Mike knows is that this +PNA is typical of an El Nino, not of a moderate to strong La Nina like we have now!"
-----------------------------------------
That was my point. it is an El Nino like atmospheric (not oceanic) pattern with the +PNA, which is a common pattern in El Nino, not in La Nina. So, El Nino isn't causing this because El Nino doesn't exist right now and won't exist anytime soon.
OK, sorry about that Larry. It was my fault getting confused and misinterpreting what you meant after reading it and giving my response based on something that you didn't say.
Monday comment:
Natural gas futures climbed higher Monday as export levels held strong, prospects for weather-driven demand improved slightly and continued positive news on the coronavirus vaccine front bolstered confidence across markets. The December Nymex contract gained 6.1 cents day/day to start the abbreviated trading week and settled at $2.711/MMBtu. January rose 5.3 cents to $2.823. NGI’s…
Tue am early:
Boosted by a colder look to forecasts for early December, natural gas futures extended their recent gains in early trading Tuesday. The December Nymex contract was up 5.5 cents to $2.766/MMBtu at around 8:40 a.m. ET. January was up 6.3 cents to $2.886. After “not being quite as bearish” in Monday’s runs, the weather data…
November 24, 2020
metmike: As Larry mentioned yesterday, the models have been adding more and more HDD's and that continued overnight. If we get a more bearish model run and with Dec. expiring tomorrow, a spike lower is possible. A spike higher is also possible(with a colder model(s) ) because of the approaching expiration.
Hopefully, Mike and other members made some good money (via longs) since yesterday whether still in or not! Forecasts keep adding HDDs and have been doing so almost continuously since the 12Z Fri EPS run!
This was a textbook near perfect opportunity since the US has been and still is quite warm overall, which had lead to a plunge in NG prices in recent weeks while the models/forecasts since the weekend have been increasing HDDs via a persistent +PNA for early Dec along with no indication of the end of it! The SE/TX gets the coldest relative to normal but even much of the NE/Midwest cools from much warmer than normal now to near to sometimes a little colder than normal in early Dec. This is being done even with a solidly warmer than normal Canada and even upper Midwest continuing. But a cold Canada and upper Midwest aren't needed when the Canadian air is forced so far south. Actually, many of the coldest US outbreaks in history occurred with a warmer than normal Canada. Look back at old maps to see this. That's how classic +PNA patterns often look.
12Z EPS 11-15: this may not cause a "huge" NG draw but it would cause a big draw. Besides, a "huge" draw isn't needed to rally a market that has had to deal with injections in early Nov and only a small draw this week. The 11-15, the period just before, and probably just after will, regardless, lead to much bigger draws than we've had so far and big draws, period, especially considering the much tighter S/D vs recent years as this map would lead to a 2.5 HDD/day colder than normal US on a pop. weighted NG usage basis, which would be ~200 HDD for the Fri-Thu week ending 12/10. A 200 HDD week with the current tightness would likely result in over a 175 bcf and possibly 190-200 bcf draw. For the same period last year, there were only ~173 HDD. Furthermore, last year's mild winter resulted in only one draw over 161 bcf! Also, last year's winter had only these Fri-Thu weekly HDDs over 200: 201, 202, and 222.

Thanks Larry!
Yes on that.
What we are seeing is the air coming from higher latitudes and the amount of push southward is with greater magnitude on each model solution as the pattern morphs into one with the upper level pressure anomaly shifting farther north with time.
Often, with pattern changes they happen with the models spelling it out loud and clear.
This potential pattern change is sort of sneaking up, with the models recognizing it just a bit more on each model run for the last few days.
What is especially advertising this new regime of air coming from higher latitudes that have some real cold potential is the plunging AO(and NAO).
In a situation like this, it's like superimposing a condition (colder in this case) on whatever the model solutions show because they don't fully dial in the changing AO/NAO and how it affects the big picture.
More amplification with time and the current ridge position and northern branch of the jet stream may look more like a La Nina as the current +AO/NAO goes to -AO/NAO.
++++++++++++++++++++++++++++++
Get the latest predictions for those indices here:
Latest, updated graph/forecast for AO and NAO and PNA here, including an explanation of how to interpret them...............mainly where they stand at the end of 2 weeks
https://www.marketforum.com/forum/t
-AO and -NAO regimes have tremendous potential for giving us a major move higher, especially when it starts incorporating enough colder air to expand beyond just cold in the south(as its in the process of doing right now).
That being said, it's never a given.
Here's a good illustration in the change from the +AO/-NAO to -AO/-NAO and the models dialing that in the last 2 days.
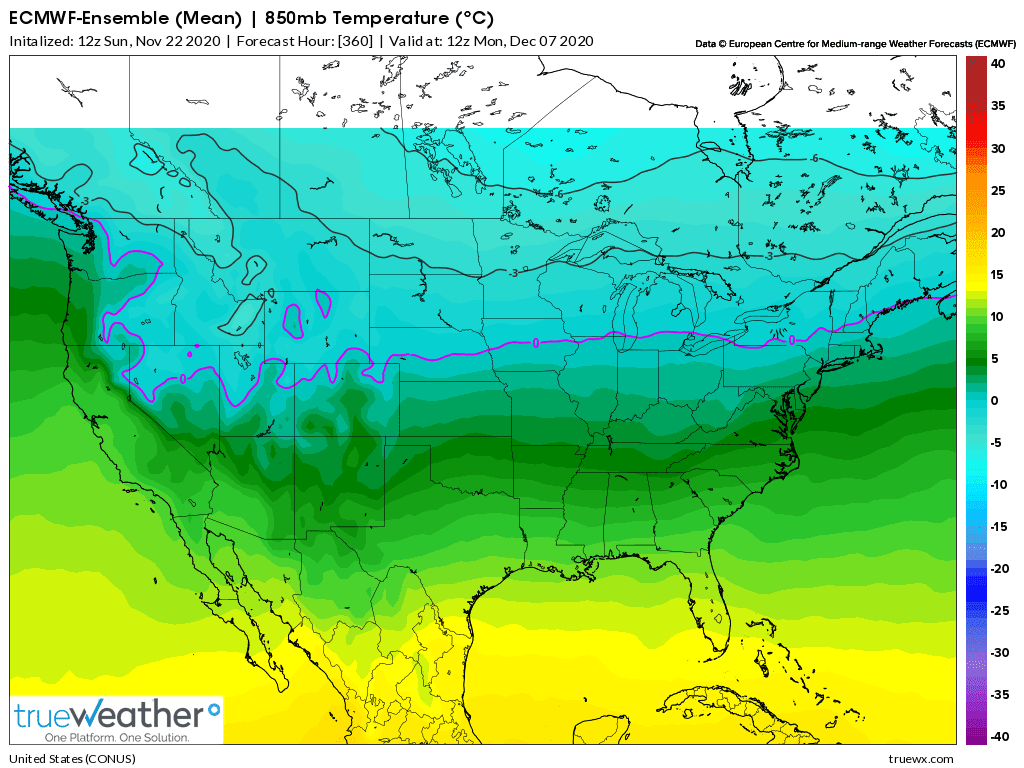
1.The first map below is the predicted 850 temp for Dec 7 made 2 days ago(Sunday 12z run) by the EEnsemble.
Note the 0 deg. C isotherm, from west to east from IA, to Chi/Det then north of NYC....pretty mild for this time of year for those locations.
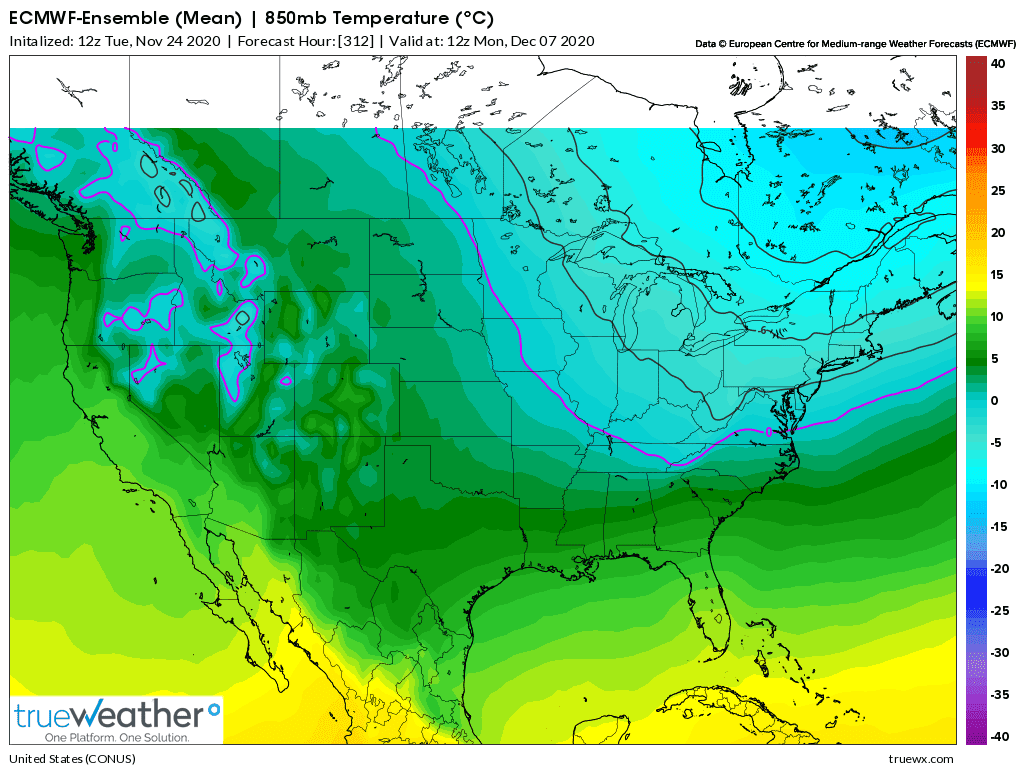
2. The second map is for the same time Dec 7 but made 2 days later. Wow, the 0 deg. C isotherm is pushed all the was down to TN! Look at the legit cold in the Northeast where the most people live. Now NYC has a -6 deg C isotherm. The -12 deg C isotherm is even showing up at the very top right of the screen.
3. This model goes out 2 additional days (vs Sunday) now to Dec 9 and you can note the significant southward movement of the -12 deg. C, 2 days later(getting close to Maine), along with even colder air behind it.
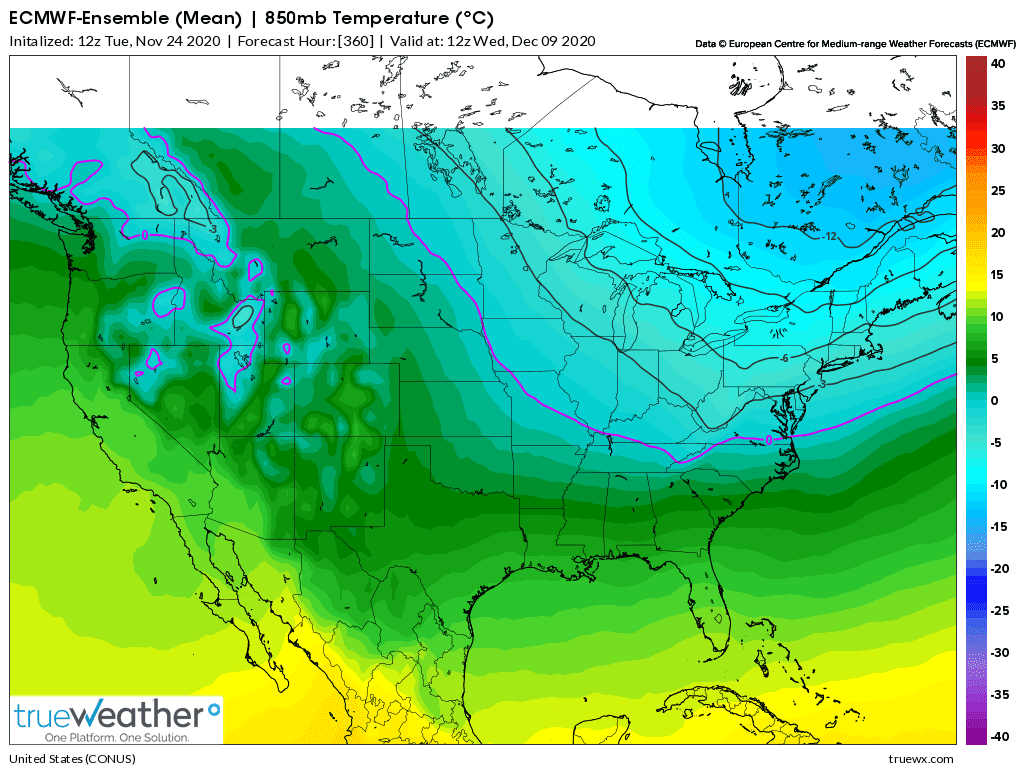
The last map looks exactly like the temperature profile for a -NAO, -AO regime.
If the pattern is shifting to that type of regime, future models runs will catch on and amplify the affects.
What are the seasonal tendencies for NG this time of year?
Mike,
Good stuff and glad you've done well!
Regarding AO/NAO, the GEFS has a longterm negative bias. So, that's something to always be aware of. In any one situation though, the bias may not show up as it is just a longterm average bias. Also, the more negative it goes on the GEFS, the better chance that a negative regime will actually occur
The biggest driving factor toward the colder US, especially SE US/TX, has been the El Nino-like +PNA (ridge into W Canada) as earlier mentioned. Look how high it is projected to go, near +2.0, which is very strong! Also, unlike the AO/NAO, the GEFS has had very little bias in its PNA predictions:

Thanks Larry!
"Regarding AO/NAO, the GEFS has a longterm negative bias."
Thanks for pointing that out. You follow some of those things closer than me.
The maps I used above to demonstrate what the temperature profile of the potential upcoming -AO/-NAO may look like are from the European Ensemble model. Do you see a bias in that model?
Good point on the +PNA being favorable for driving cold deeply into the Southern US. As you mentioned(and I showed with the link earlier to these indices) that's an impressive ++PNA and I should have pointed that out also.
The most noteworthy changes, if we see a pattern change during week 2, especially late would be the injection of major cold that would be cold by everyones standards and really cold for the South with their less tolerance for cold.
The ++PNA is shown to drop a bit but still be at lofty levels.
Most of the biggest drawdowns historically feature either very widespread cold over the entire eastern half of the country of at least moderate intensity in the Winter or record cold over a major portion of it(for other readers info).
Mike,
Thanks. I don't know if the Euro has a -AO/-NAO bias. My educated guess would be less of one, if any.
The GEFS AO/NAO bias at day 14 has averaged -0.9/-0.4 over the last 3 months. So, ideally I'd like to see a sub -1.0/sub -0.5 for the GEFS at day 14 to feel like there's a good chance a -AO/-NAO will actually be there on day 14.
Regarding NGI, I feel like they're sort of minimizing the colder model changes as they've been more than slight HDDwise:
"The forecaster said the slight weather shift, along with continued solid liquefied natural gas (LNG) volumes, was enough to boost futures. NGI data showed LNG export levels hovering above 10 Bcf on Tuesday, near 2020 highs."
I think that what matters the most by far is the AO/NAO is dropping pretty hard and not just the absolute value at any one point.
If we were/are headed to a -4, for instance (not my forecast) from the current level close to +3, we have to do some dropping to get there and it will gradually play out every day with incremental drops in the daily forecast.
So as long as its dropping, regardless of the absolute value at any point like today, it's telling us the pattern is getting colder.
The 0z GFS ensemble just ended the long stretch of model runs in a row that were adding HDD's. The market was already quite weak before that.
The last GFS ensemble had 10 fewer HDD and the one prior actually had 2 less HDD's. However the Canadian ensemble is COLDER that before.
It looks like we had gone 9 solutions in a row(every 6 hours) prior to that with an increase in HDD's.
We're back down to the major support that held early Tue afternoon at 2.865.
Dec expires on Wed and we have the EIA number a day early and those factors could easily dominate since the brand of cold coming up is not yet the type which fuels major moves higher(Arctic air).
for week ending November 20, 2020 | Released: November 25, 2020 at 12:00 p.m. | Next Release: December 3, 2020
-18 BCF Neutral
| Working gas in underground storage, Lower 48 states Summary text CSV JSN | |||||||||||||||||||||||||
|---|---|---|---|---|---|---|---|---|---|---|---|---|---|---|---|---|---|---|---|---|---|---|---|---|---|
| Historical Comparisons | |||||||||||||||||||||||||
| Stocks billion cubic feet (Bcf) | Year ago (11/20/19) | 5-year average (2015-19) | |||||||||||||||||||||||
| Region | 11/20/20 | 11/13/20 | net change | implied flow | Bcf | % change | Bcf | % change | |||||||||||||||||
| East | 934 | 953 | -19 | -19 | 898 | 4.0 | 887 | 5.3 | |||||||||||||||||
| Midwest | 1,133 | 1,139 | -6 | -6 | 1,057 | 7.2 | 1,072 | 5.7 | |||||||||||||||||
| Mountain | 242 | 241 | 1 | 1 | 204 | 18.6 | 214 | 13.1 | |||||||||||||||||
| Pacific | 320 | 319 | 1 | 1 | 293 | 9.2 | 314 | 1.9 | |||||||||||||||||
| South Central | 1,312 | 1,306 | 6 | 6 | 1,165 | 12.6 | 1,203 | 9.1 | |||||||||||||||||
| Salt | 356 | 350 | 6 | 6 | 302 | 17.9 | 336 | 6.0 | |||||||||||||||||
| Nonsalt | 956 | 956 | 0 | 0 | 863 | 10.8 | 867 | 10.3 | |||||||||||||||||
| Total | 3,940 | 3,958 | -18 | -18 | 3,618 | 8.9 | 3,690 | 6.8 | |||||||||||||||||
Totals may not equal sum of components because of independent rounding. | |||||||||||||||||||||||||
Working gas in storage was 3,940 Bcf as of Friday, November 20, 2020, according to EIA estimates. This represents a net decrease of 18 Bcf from the previous week. Stocks were 322 Bcf higher than last year at this time and 250 Bcf above the five-year average of 3,690 Bcf. At 3,940 Bcf, total working gas is within the five-year historical range.
For information on sampling error in this report, see Estimated Measures of Sampling Variability table below.
Note: The shaded area indicates the range between the historical minimum and maximum values for the weekly series from 2015 through 2019. The dashed vertical lines indicate current and year-ago weekly periods.
https://www.investing.com/economic-calendar/natural-gas-storage-386
Latest Release Nov 25, 2020 Actual-18B Forecast-18B Previous31B
| Release Date | Time | Actual | Forecast | Previous | |
|---|---|---|---|---|---|
| Nov 25, 2020 | 12:00 | -18B | -18B | 31B | |
| Nov 19, 2020 | 10:30 | 31B | 15B | 8B | |
| Nov 13, 2020 | 10:30 | 8B | -3B | -36B | |
| Nov 05, 2020 | 10:30 | -36B | -26B | 29B | |
| Oct 29, 2020 | 09:30 | 29B | 37B | 49B | |
| Oct 22, 2020 | 09:30 | 49B | 52B | 46B |
-AO/-NAO getting more impressive.
https://www.marketforum.com/forum/topic/15793/
Looking more like a potential Greenland type block setting up, which can be very cold for the East.
Positive anomalies in Eastern Canada (Hudson Bay) to just south of Greenland.
Spike higher from expiring December giving the Jan an extra boost higher.
GFS ensemble was colder, so was the euro but the euro ens came in a bit milder and took away a big chunk of the gains.
Also potential for some heavy snows from Ohio River northeastward starting in 5 days.
New 12Z GEFS coldest yet as a whole and here's a snapshot of temp anomalies at 264 to best illustrate:

Almost the entire high population E 1/3 of the US is solidly cold, despite well above normal upper MW and Canada (normal for a strong +PNA block...look back in history) and thus that would use a lot of NG.
Here 500 mb/surface:

If it weren't a holiday, NG would very likely be up now.
Yep, coldest yet.
The plunging AO/NAO is bringing down the coldest air of the season along the East Coast which has been increasing the area affected by cold and greatly increasing the intensity of the cold, now coming from higher latitudes:
Thanksgiving 2020 Weather
1. Today's 12Z GEFS, the coldest yet, has ~14 more HDD than yesterday's GEFS, which itself was ~12 HDD colder than yesterday's 0Z GEFS. So, today's 12Z GEFS is a whopping ~26 colder than yesterday at 0Z.
Based on the 12Z GEFS, a 190 HDD week ending 12/10 is quite possible, which would likely yield close to a 175 bcf draw.
2. Today's 12Z EPS is ~6 HDD warmer than yesterday at 12Z and `8 warmer than yesterday at 0Z.
3. The EPS had been quite a bit colder than the GEFS but now it is slightly warmer. Both are slightly colder than normal for the entire run.
4. The 12Z GEFS of 11/16 was a whopping 60 HDD warmer than normal! Today's 12Z run, just 10 days later, is 13 HDD colder than normal, meaning a +73 HDD anomaly change!
The 12Z EPS of 11/16 was a whopping 41 HDD warmer than normal. Today's 12Z run, just 10 days later, is 7 HDD colder than normal, meaning a +48 HDD anomaly change!
Winter is moving in. Best to be long, with a short covering plan.
The European model and Ensemble were a bit milder overnight but the pattern still looks to be morphing colder. The -AO/-NAO not quite as impressive looking at the end of 2 weeks but still look much colder vs what we've seen recently and much colder than models showed early this week and especially a week ago.
This amount of selling looks way overdone considering one would think the models all just shifted back to a mild pattern again.
As mentioned on the weather page though, this potential change to colder and colder in week 2 is extremely uncertain. Several keep it fairly mild in week 2 and half turn it frigid along the East Coast.
The market must believe the mild models.
Or else there is too much supply, prices too high and not enough cold with funds already having a record long. Some of the spike higher recently could have been induced from short covering ahead of the Dec expiring and we thought it was all from weather, so it could have spiked the price much higher ahead of when it would have without the expiration of the front month on Wednesday.
What do you think Larry?
Others?
I'm not Larry, but I'll give you my 2 cents. There are other factors at work here as well. Prices got dragged up by the December contract going off the board, so you have some correction going on in that regard.
It would be foolish to think there aren't going to be any shutdowns. Major ones. The hospitals in NE Ohio are full. A close relative of mine is in the hospital and was shuttled an hour away from home to find a bed.
Wait until all these Thanksgiving travelers come home, unfortunately some of them won't live to see Christmas...as brutal as that sounds. There is no way there won't be a surge of covid cases.
Record high storage, looming shutdowns, so so weather demand, unemployment creeping back up. I don't think we are going to see $4 NG anytime soon. It would be aggressive to say we might not see $3 NG for the rest of the winter, but I wouldn't be surprised.
Thanks Jim!
Appreciate your views.
I forgot about COVID. Not sure how that plays out but it might be a big factor.
https://www.marketforum.com/forum/topic/61206/
New NG thread including my answer to Mike's question found here: