USDA Oct. 9 2020
11 responses | 0 likes
Started by metmike - Oct. 8, 2020, 11:26 a.m.

@kannbwx

Analysts see big cuts to U.S. 2020/21 ending stocks on Friday following Sept. 1 grain stocks. There are some sub-2 bln bu estimates on #corn, and it is crazy to think that estimates topped 4 bln bu back in May. Some analysts even had 3+ as recently as August. Tide has shifted.


Image

Comments
By metmike - Oct. 8, 2020, 11:45 a.m.
Like Reply

@kannbwx

·

Would #corn stocks be even lower had it not been for covid/ethanol? Maybe, maybe not, but don't forget that farmers responded to the terrible prices by cutting 5 mln acres off intentions. That's worth close to a billion bushels on production.

By metmike - Oct. 9, 2020, 12:11 p.m.
Like Reply

Yield for U.S. #corn and #soybeans was very similar to/unchanged from last month, but harvested area was reduced for both after a review of certified acreage data from FSA. Corn and soy production both come in below trade expectations as a result.


Image

By metmike - Oct. 9, 2020, 12:14 p.m.
Like Reply

metmike: Extremely bullish beans!

@kannbwx

Ending stocks for U.S. #soybeans come in at 290 mln bushels for 2020/21, well below trade expectations, on a harvest reduction, increase in exports, and a smaller carryin. #Corn comes in slightly above the trade guess, though close, and #wheat is a hair below.


Image

By metmike - Oct. 9, 2020, 12:18 p.m.
Like Reply

metmike: Very bullish for beans!

@kannbwx

World ending stocks were generally lighter than expected (especially for #soybeans), though new-crop #wheat lands much higher. #Russia's 2020 harvest was increased 5 mmt. #Ukraine's #corn harvest was cut by 2 mmt. #China's 20/21 bean demand +1 mmt to 100 mmt.


Image

By metmike - Oct. 9, 2020, 12:34 p.m.
Like Reply

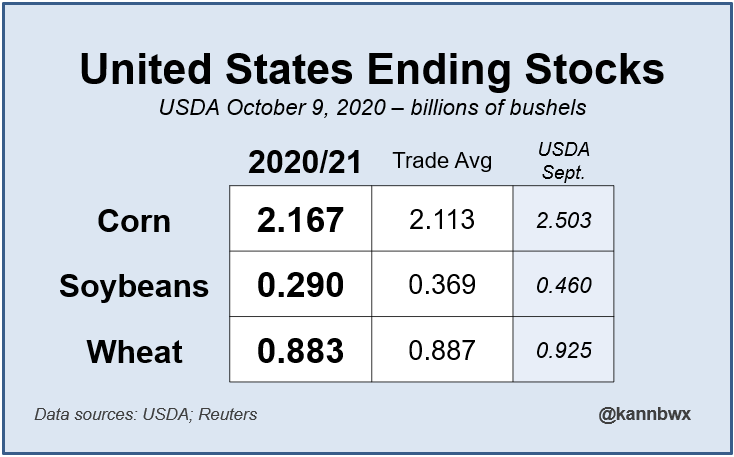
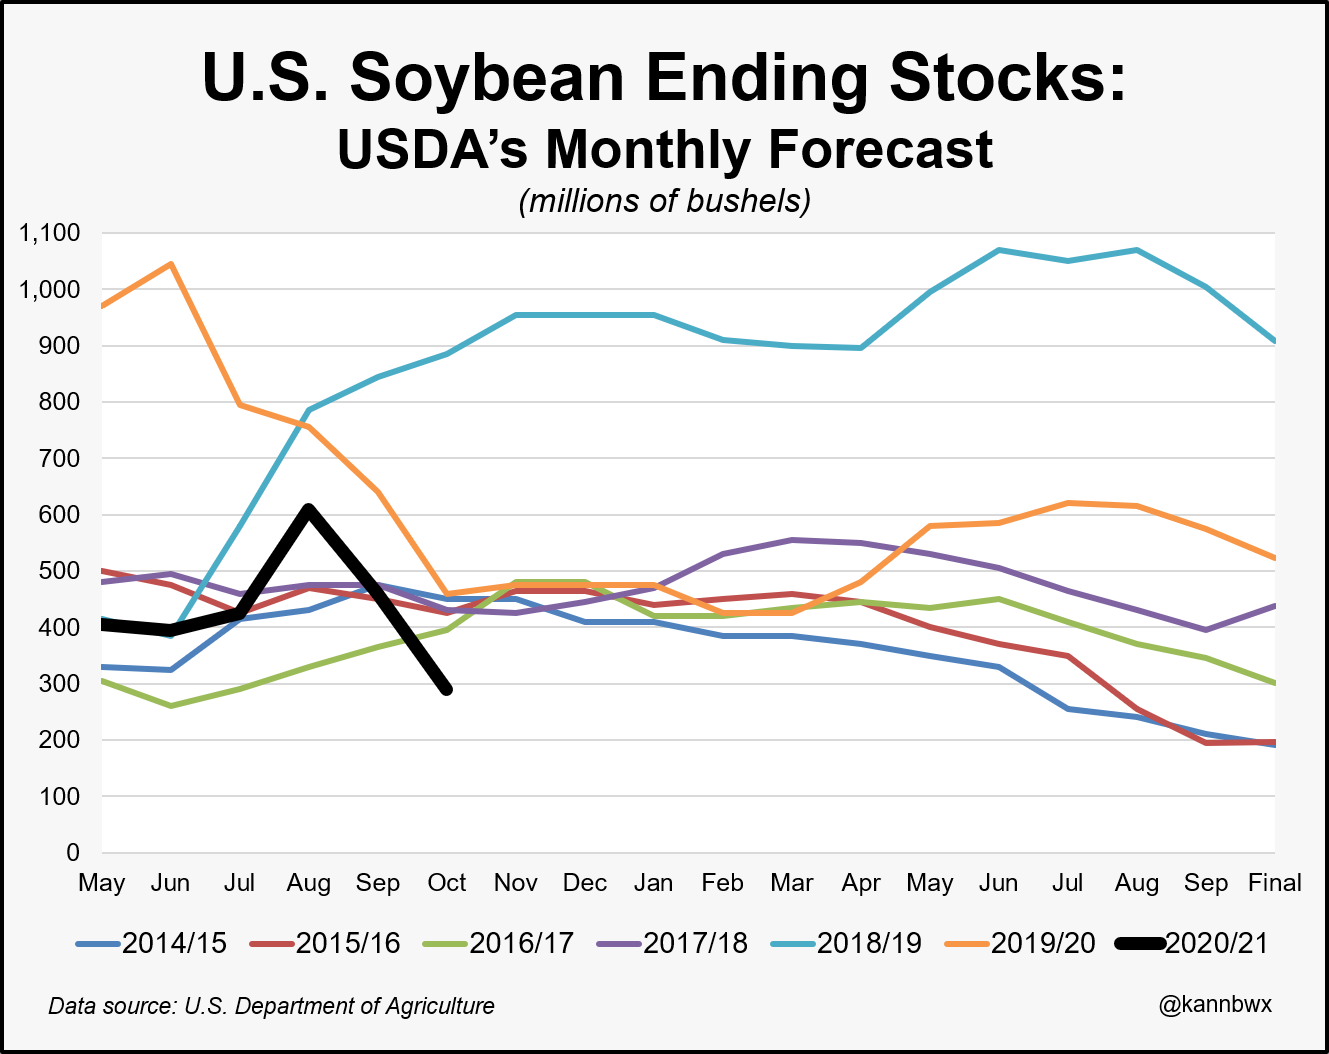
USDA puts 2020/21 ending stocks for U.S. #soybeans at 290 million bushels, down 37% from the Sept. estimate.

 The last time USDA printed a number below 290 mbu? June 2016 for the 2016/17 MY (final 301 mbu). 

The last time stocks were 290 mbu or lower? 2015/16 (final 197 mbu).

Image

By metmike - Oct. 9, 2020, 12:59 p.m.
Like Reply

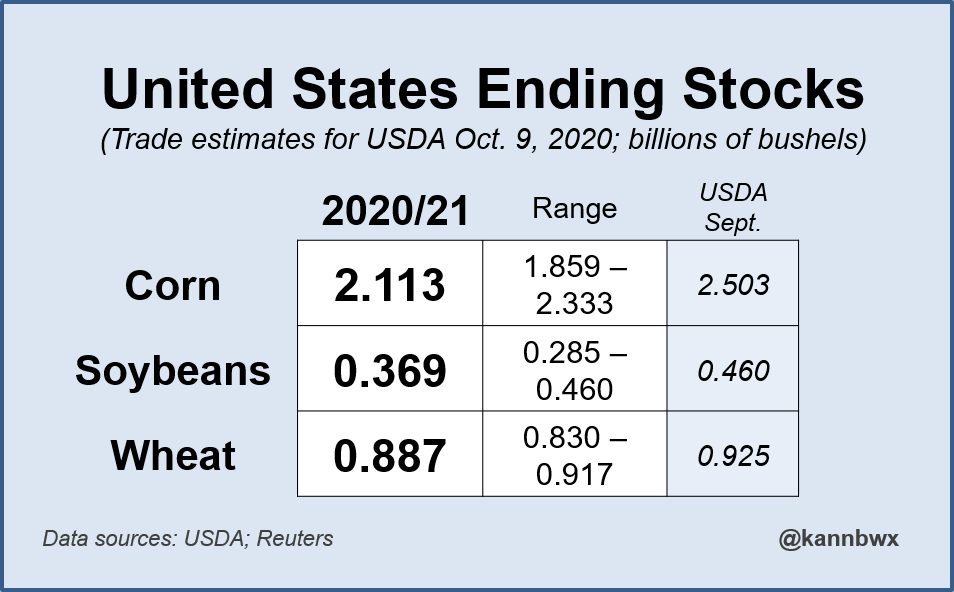
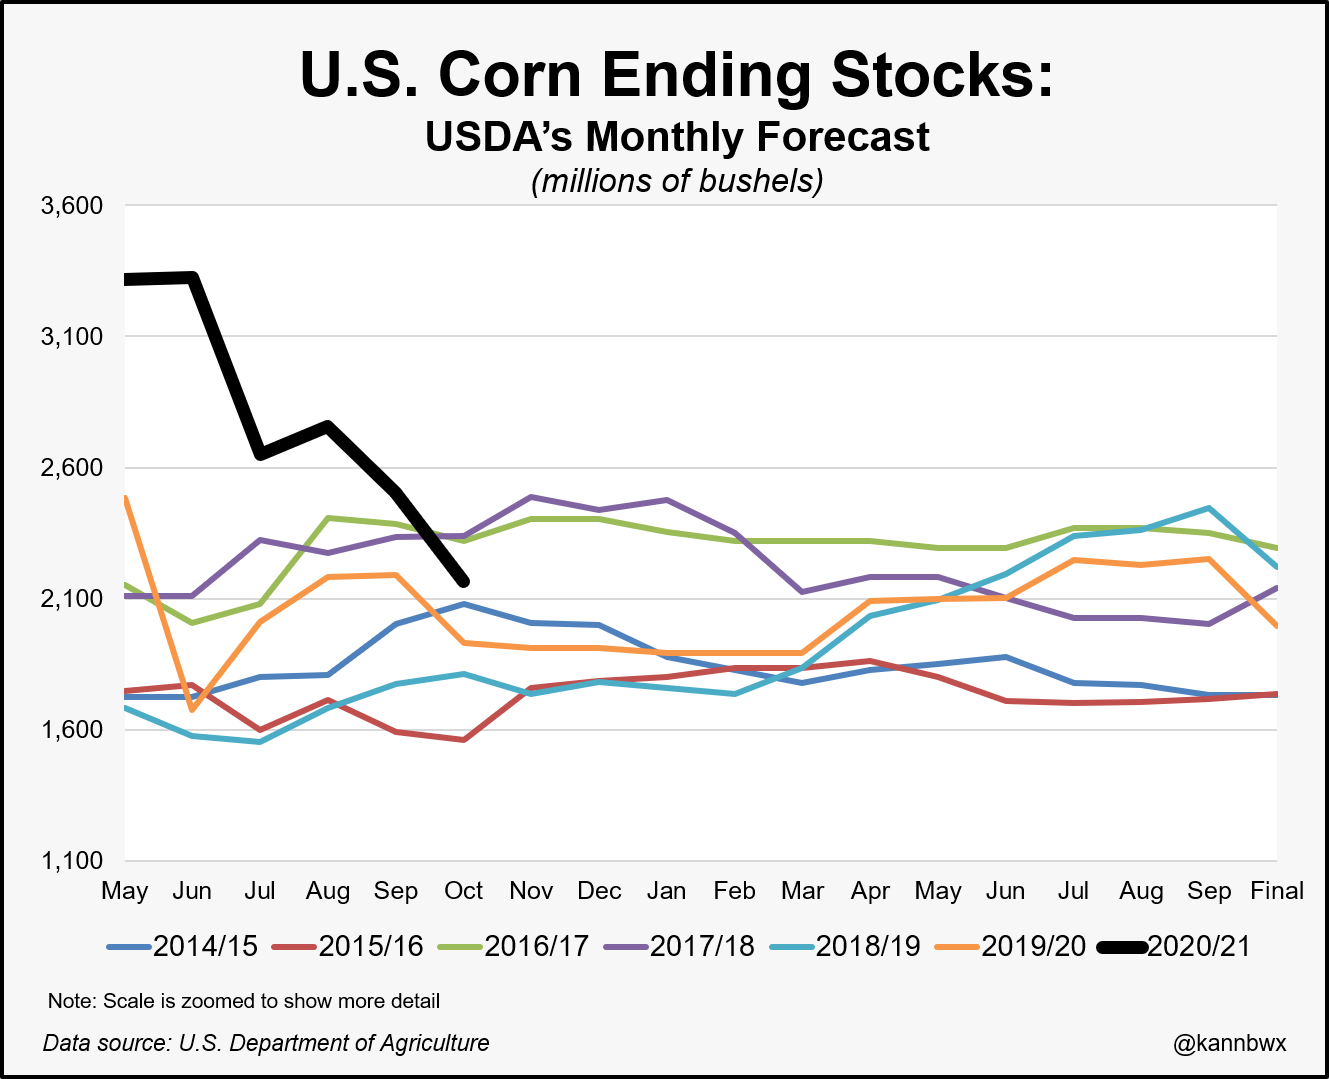
U.S. #corn carryout 2020/21: from 3.3 billion bushels in June to 2.17 billion in October, a decline of 35%.

 The June-Oct 2012 decline was larger, both by % and bu (-67% and -1.26 bln bu). But a major crop disaster did not befall the 2020 harvest like it did in 2012.


Image

By Jim_M - Oct. 9, 2020, 2:21 p.m.
Like Reply

Throw in a little La Nina dryness in SA and things could get very interesting for beans.  

By metmike - Oct. 9, 2020, 2:58 p.m.
Like Reply

Yes Jim, the market will be keying on rain forecasts and amounts for huge producer Mato Grosso!


https://www.marketforum.com/forum/topic/59680/

By metmike - Oct. 9, 2020, 3:04 p.m.
Like Reply

Yield for U.S. #corn and #soybeans was very similar to/unchanged from last month, but harvested area was reduced for both after a review of certified acreage data from FSA. Corn and soy production both come in below trade expectations as a result.

Image

By WxFollower - Oct. 9, 2020, 5:38 p.m.
Like Reply

 CT was reduced by under 1%, which was actually bearish vs expectations of ~2%. So, despite the bullish effect on CT this week from H Delta (about a 3 cent rise) due to the expected damage on the Mississippi Delta crop, a major region, prices fell back almost a penny after the report to not far above session lows. However, there still was a small gain today due to the storm having earlier affected the market.

By metmike - Oct. 9, 2020, 9:51 p.m.
Like Reply

Thanks much Larry!

I considered starting a cotton thread this week and especially appreciate your comments on that market.

Am in Detroit with Dad for a couple more days.