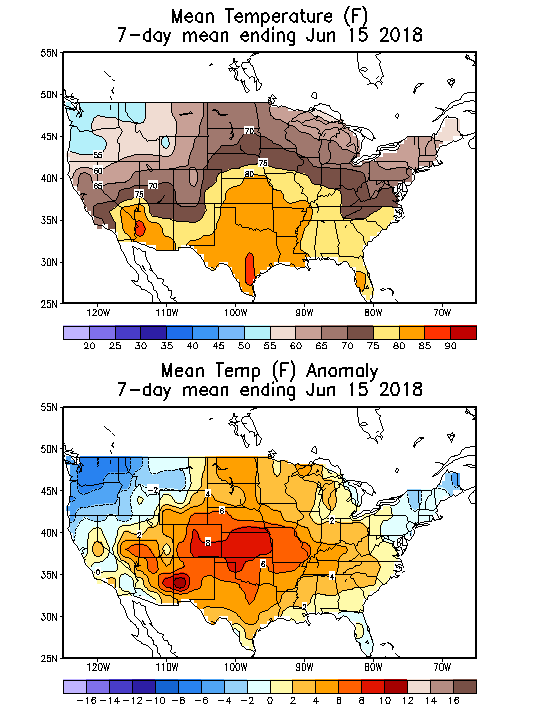
July natural gas futures were set to open about 3 cents lower at $2.945 Friday morning as weather models turned slightly cooler for the South and Gulf Coast in the medium term.
The Nymex July contract fell as low as $2.951, down from Thursday’s settle of $2.975, and retreated a bit just ahead of Friday’s open. Weather model guidance overnight Thursday remained mostly the same as it reflected slightly less heat risks across the South and Gulf Coast with increasing confidence in the core of the strongest hot anomalies being across the northern tier, Bespoke Weather Services said.
“Heat still looks intense enough for cooling demand to approach record levels for a couple of days, although the South would likely need to heat further for those records to fall,” Bespoke chief meteorologist Jacob Meisel said. Still, after a cool short term, the forecaster expects to see heat pick up next week and likely peak next weekend, although there are only few signs yet of the pattern breaking long-term.
Some guidance into week 3 has begun to show that core ridging would shift into the Pacific Northwest and begin cooling the East, “a trend we expect to limit heat into the second half of July,” and forecasters are increasingly concerned that despite these hot forecasts, there are not many gas-weighted degree day (GWDD) additions left.
The modest cooling in the long term comes after the Energy Information Administration (EIA) delivered another bearish surprise to the gas market on Thursday. The EIA reported a 91 Bcf injection into storage inventories for the week ending June 15. The reported build was 6 Bcf above market consensus and lifted inventories to 2,004 Bcf, which is still 757 Bcf below year-ago levels and 499 Bcf below the five-year average of 2,503 Bcf.
In recent years, misses of 6-8 Bcf have become common and often are quickly reversed, EBW Analytics said. “Two consecutive misses, however, suggest that current production may be as much as 1 Bcf/d above estimates using pipeline scrape reports.” If next week's storage report (for the week ending June 22) continues the trend, downward price pressure could intensify, the company said.
ICAP Technical Analysis analyst Brian LaRose said as far as seasonal cycles are concerned, the market is currently “dead smack in the middle of the window” of a seasonal cycle advance. The question is whether market bears will be able to use that to their advantage. Resistance, however, is causing some trouble. “The first step for bears is to take out $2.90 to open up the door for further downside.”
Then it will be up the bears to take out another support zone at $2.85 zone after taking out $2.90. If $2.85 can hold, however, then the market could actually see another round of fresh highs, he said. There has been selling pressure in the $3 neighborhood so far, but LaRose said he’s been “impressed by the bulls’ resilience. Each and every time we have tried to sell off, the bulls have come fighting back.”
As for Friday, Bespoke expects a range-bound trading day from $2.92-3.00 as the natural gas market balances hot forecasts for the next two weeks against cooler risks likely to arrive late July, as well as production that is recovering back to near-record highs.
“Risk on a longer-term basis remains skewed lower in the natural gas market, thanks to loose balances and elevated production, but heat should at least keep support intact” on Friday, Meisel said.
Heat ridge much farther west on latest guidance...........nw flow and upper level trough in Northeast US.
Last 6Z GFS:
gfs_namer_312_200_wnd_ht | gfs_namer_312_500_vort_ht |
gfs_namer_312_1000_500_thick | gfs_namer_312_850_temp_ht |
Late Week 2 heat anomalies.....farther west today.

CFS week 3 and 4...........MUCH cooler than it has been in a long time......especially Northeast.
Still some heat SCentral and West.

Very short term:
Temperatures cooled off now thru the Midwest and East:


Highs days 3-7 shows pleasant temps Upper Midwest, then warming back up.


By metmike - June 21, 2018, 10:43 a.m.
EIA storage report +91 bcf..........bearish. More than the market expected. Spike down to close to the lows after the release.
Sustained heat in extended still bullish. Low storage still bullish. Seasonals bearish from now thru July.
http://ir.eia.gov/ngs/ngs.html
| Working gas in underground storage, Lower 48 states Summary textCSVJSN | |||||||||||||||||||||||||
|---|---|---|---|---|---|---|---|---|---|---|---|---|---|---|---|---|---|---|---|---|---|---|---|---|---|
| Historical Comparisons | |||||||||||||||||||||||||
| Stocks billion cubic feet (Bcf) | Year ago (06/15/17) | 5-year average (2013-17) | |||||||||||||||||||||||
| Region | 06/15/18 | 06/08/18 | net change | implied flow | Bcf | % change | Bcf | % change | |||||||||||||||||
| East | 406 | 377 | 29 | 29 | 510 | -20.4 | 518 | -21.6 | |||||||||||||||||
| Midwest | 401 | 372 | 29 | 29 | 653 | -38.6 | 560 | -28.4 | |||||||||||||||||
| Mountain | 127 | 125 | 2 | 2 | 181 | -29.8 | 155 | -18.1 | |||||||||||||||||
| Pacific | 246 | 239 | 7 | 7 | 280 | -12.1 | 294 | -16.3 | |||||||||||||||||
| South Central | 824 | 800 | 24 | 24 | 1,137 | -27.5 | 976 | -15.6 | |||||||||||||||||
| Salt | 258 | 252 | 6 | 6 | 344 | -25.0 | 289 | -10.7 | |||||||||||||||||
| Nonsalt | 566 | 547 | 19 | 19 | 793 | -28.6 | 687 | -17.6 | |||||||||||||||||
| Total | 2,004 | 1,913 | 91 | 91 | 2,761 | -27.4 | 2,503 | -19.9 | |||||||||||||||||
The period below, ended last Friday was used for the EIA number. That's a pretty big (bearish #) injection considering the amount of heat we experienced. ..........though the intense heat was not in the high population centers of the East, Southeast and Midwest.
By WxFollower - June 21, 2018, 6:29 p.m.
I posted this yesterday (today's update is below this copy of yesterday's):
"On a CDD equivalent basis at this time of year, a +84 would be:
- ~20-25 more bearish than 2017 and 2016, both of which had far more storage
- pretty comparable to 2015 and 2013
- ~20-25 more bullish than 2014, which at the time was having a very long string of 100+ injections
Based on the above, I'd call a +84 ~4-5 bcf looser than the average supply/demand balance of the last 5 years near the same time of year (late spring/early summer). Assuming about the same # of CDDs/HDDs for the next 21 weeks as the average CDDs/HDDs of the last 5 years and considering the current 507 bcf deficit to the 5 year average, the next 21 weeks will need to average 24 bcf/week larger than the 5 year average to get 11/2/18 storage to the 5 year average. So, the current supply/demand balance is nowhere near that."
--------------------------------------------------------------------------------------------------
TODAY'S UPDATE: The actual was +91 rather than +84. Mike win this week with his +87 vs my +86. Congrats!
Now, I'm going to take what I wrote yesterday in relation to the average DJ guess of +84 and modify it to reflect on a +91 instead:
On a CDD equivalent basis at this time of year, the +91 is:
- Around 27-32 more bearish than 2017 and 2016, both of which had far more storage
- Around 7 more bearish than 2015 and 2013
- Around 13-18 more bullish than 2014, which at the time was having a very long string of 100+ injections
Based on the above, I'm calling the +91 about 11-12 bcf looser than the average supply/demand balance of the last 5 years near the same time of year (late spring/early summer).
With the bearish +91, the deficit vs the 5 year average shrunk slightly from 507 to 499. There are now 20 weeks to get to 11/2/18. Considering the current 499 deficit to the 5 year average, the next 20 weeks will need to average 25 bcf/week larger than the 5 year average to get 11/2/18 storage to the 5 year average. So, assuming near the 5 year average for weather, the current supply/demand balance, even just based on today's bearish report, alone, is still nowhere near that as 11/2/18 would come in near 270 lower than the 5 year average or near 3,559. That would actually be slightly lower than the 5 year minimum of 3,582.
By metmike - June 21, 2018, 7:13 p.m.
Terrific analysis Larry.
I think that we get even looser with time. There are several projects that are ready to increase gas production, the market price is decent, the market NEEDS as much gas as possible and very high residential demand can't last forever.
We have another period of unusually high CDD demand coming up, which will just make it tougher to get to the 5 year average later this year...........making it even more imperative to ramp up supplies as soon as possible.
Considering how much heat is coming up and storage this low its interesting that prices are LOWER for the week. The market obviously recognizes how much supply lies ahead.
However, increasing supplies can only come to the rescue to close the storage gap over an extended period. If we are hit with extreme heat thru July, for instance and actually increase the storage gap, then it becomes almost impossible to get to the 5 year average without some immediate help from the weather turning sharply cooler(lets assume that it doesn't just for this example) or supplies are really going to have to ramp up.
Often, the best way to accomplish that is with higher prices. Considering how extreme the residential demand has been the last several months, ng prices have been pretty tame.
Amazing that with so much heat and low storage that we are below $3 and lower than where we closed last week. Seasonals turn very weak here thru July, so its usually a bad time of year to be long natural gas.
Last Sunday Night had a gap and crap................then strong reversal lower.
We gapped higher than Fridays highest price, then filled the gap and closed sharply lower. This was mostly from temperatures being cooler for around a 5-6 day period in the middle of the forecast............but with intense heat still early this week and maybe even more intense heat later in week 2.
It shows how easily we can drop fast if the forecast is not wall to wall intense heat.
When it does have increasing intense heat, we claw our way back. We managed to top $3 again early today on that but the bearish storage report poured a bunch of cold water on that rally.
We are below $3 at the moment(because of the bearish EIA report). If forecasts overnight get hotter again, I would think that we will be above $3 on Friday.
I think the biggest $s/contract risk to having a position over the weekend would be if the maps turned sharply colder. There is an enormous amount of intense heat in the forecast right now. Adding more will cause prices to go higher but going from Intense heat to more intense heat is less of a change than Intense heat to much cooler.
But storage is low and in markets like that, reactions can be amplified.
Another thing to consider is that we don't have to get to the 5 year average at the end of the injection season. If we don't make it, the supply side will still be gushing into the drawdown season and cause drawdowns to be smaller.
In other words, the market will not be recalculating how much bigger the injections must be every week to get to the 5 year average by the end of the injection season but, instead will just be adding how many more weeks into the withdrawal season it will take to happen..........but with the assumption that it WILL happen because the fundamentals/dynamics, in the absence of extreme weather(which the market knows won't last forever), say so.
Last 0z Canadian model ensemble average and individual members.........shifting heat ridge farther west?
Weak trough far northeast?
Not all agree and there is room for something extreme with the dome scenario. The latest solution is a COOLER pattern for the East:
384h GZ 500 forecast valid on Jul 08, 2018 00 UTC


Forecasts for the control (GEM 0