
Rains the past 24 hours.......IA and points west and east over the top of the heat ridge.![]()
Most importantly........forecast rains.
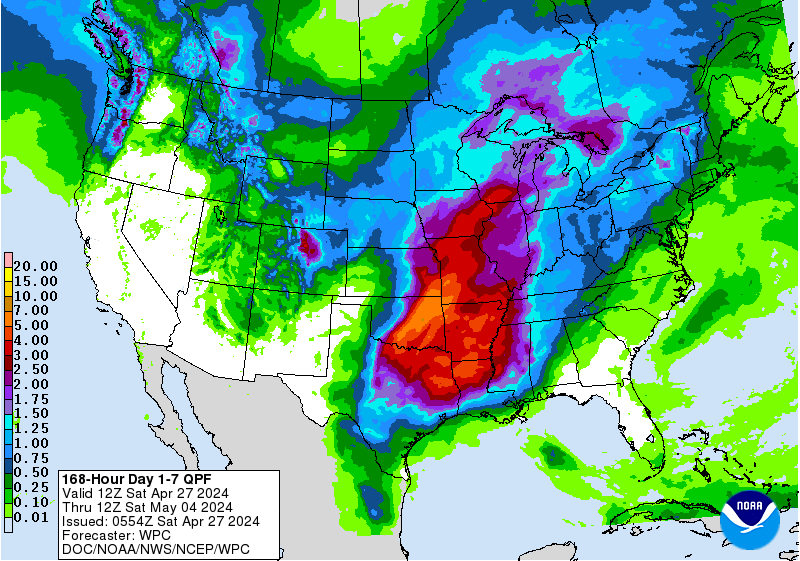
Rains the next 7 days .........will shift farther south and now are predicted to bomb, key growing areas for corn/beans over the top of the heat ridge in the south. Some places will have excessive rains but rain makes grain now.
Day 1:
http://www.wpc.ncep.noaa.gov/qpf/fill_94qwbg.gif?1526306199054
Day 2:
http://www.wpc.ncep.noaa.gov/qpf/fill_98qwbg.gif?1528293750112
Day 3:
http://www.wpc.ncep.noaa.gov/qpf/fill_99qwbg.gif?1528293842764
Days 4-5:
http://www.wpc.ncep.noaa.gov/qpf/95ep48iwbg_fill.gif?1526306162
Days 6-7:
http://www.wpc.ncep.noaa.gov/qpf/97ep48iwbg_fill.gif?1526306162
Total accumulation
http://www.wpc.ncep.noaa.gov/qpf/p168i.gif?1526397762
Pretty decent threat area for excessive rains but at this time of year, rain makes grain.
Excessive rain threat too
Current Day 1 Forecast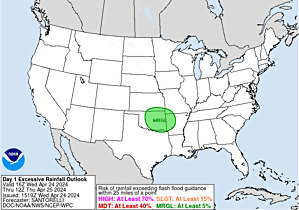 Valid 15Z 06/11/18 - 12Z 06/12/18 |
Day 1 Threat Area in Text Format
| Day 2 and Day 3 Forecasts |
Current Day 2 Forecast Valid 12Z 06/12/18 - 12Z 06/13/18 |
Day 2 Threat Area in Text Format
Current Day 3 Forecast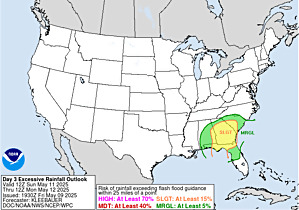 Valid 12Z 06/13/18 - 12Z 06/14/18 |
Severe Storm Risk for the next few days:
Current Day 1 Outlook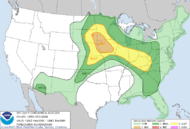 | Forecaster: Hart/Kerr Issued: 18/1240Z Valid: 18/1300Z - 19/1200Z Forecast Risk of Severe Storms: Slight Risk |
Current Day 2 Outlook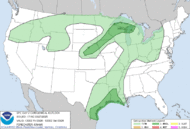 | Forecaster: Bunting Issued: 18/0600Z Valid: 19/1200Z - 20/1200Z Forecast Risk of Severe Storms: Marginal Risk |
Current Day 3 Outlook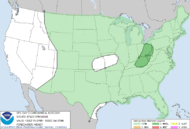 | Forecaster: Bunting Issued: 18/0731Z Valid: 20/1200Z - 21/1200Z Forecast Risk of Severe Storms: Marginal Risk |
Current Day 4-8 Outlook | Forecaster: Bunting Issued: 18/0856Z Valid: 21/1200Z - 25/1200Z Note: A severe weather area depicted in the Day 4-8 period indicates a 15%, 30% or higher probability for severe thunderstorms (e.g. a 15%, 30% chance that a severe thunderstorm will occur within 25 miles of any point). |
By cfdr - June 19, 2018, 7:27 a.m.
Looks like where I'm headed shortly it will stay very cool - on the west slope of mountains in Banff. I heard from a friend that the bug hatch is late this year, so the fishing is slow yet. That's perfect, as we are a bit delayed. (g)
Still can't help but see this as a very unusual global picture
https://earth.nullschool.net/#current/wind/isobaric/1000hPa/orthographic=-93.90,34.80,400
I've never seen such chaotic air flow patterns. But, as long as the water is pumped up out of the Gulf, a drought (obviously) cannot set up. Even though the pattern in this country appears to be perfectly setting up for an eastern corn belt drought.
Chaotic systems - like weather and climate - not predictable for anything but short term
This is what the dome looked like on the last GFS.
gfs_namer_384_200_wnd_ht | gfs_namer_384_500_vort_ht |
gfs_namer_384_1000_500_thick | gfs_namer_384_850_temp_ht |
CFS weeks 3 and 4 really heats things up.

Turns drier in some places

Total rains from the last GFS, mostly week 1.
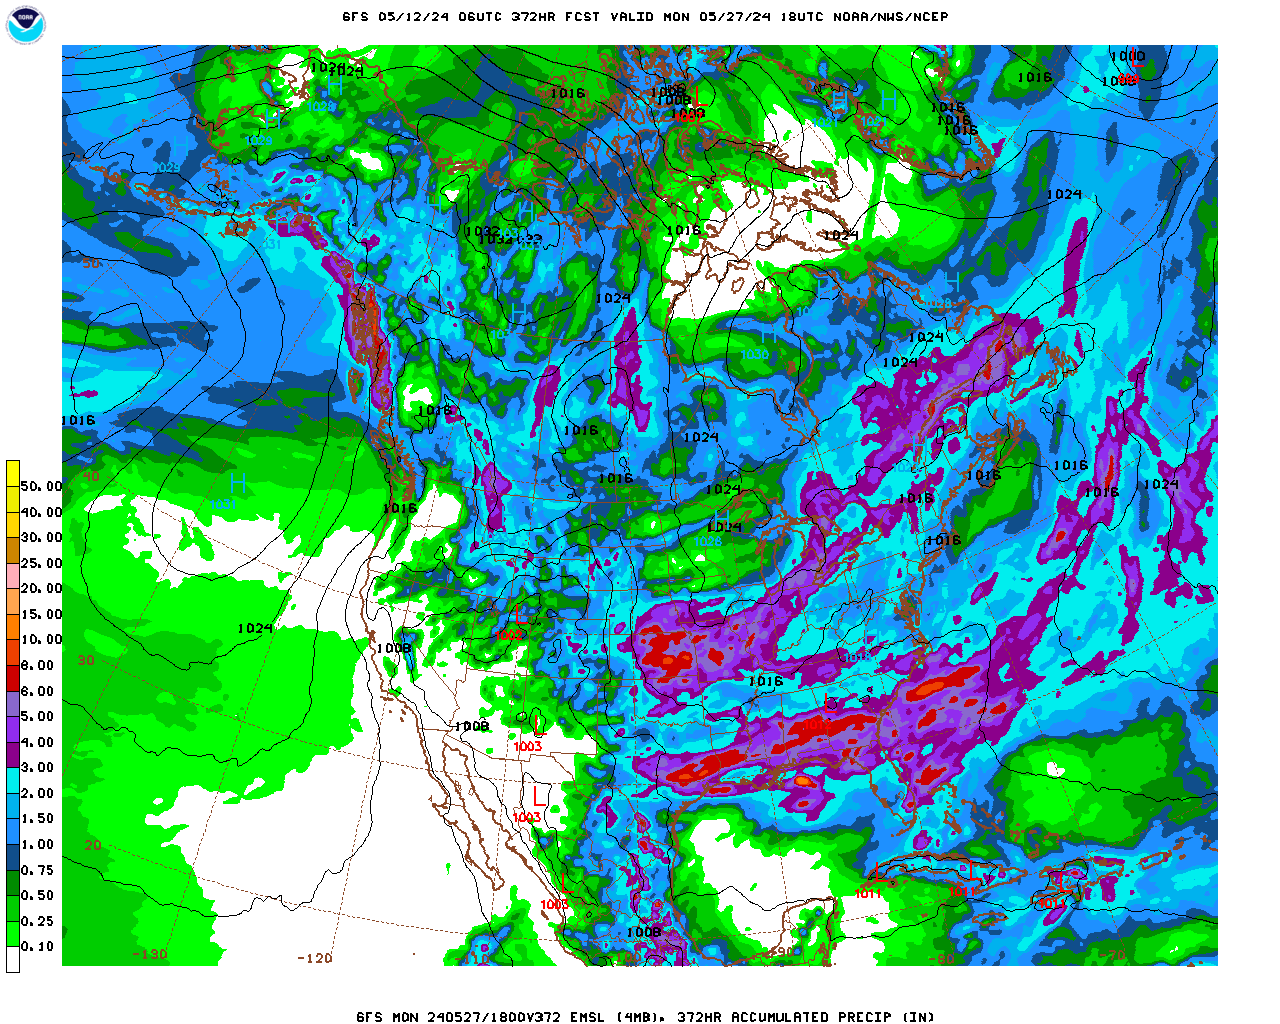
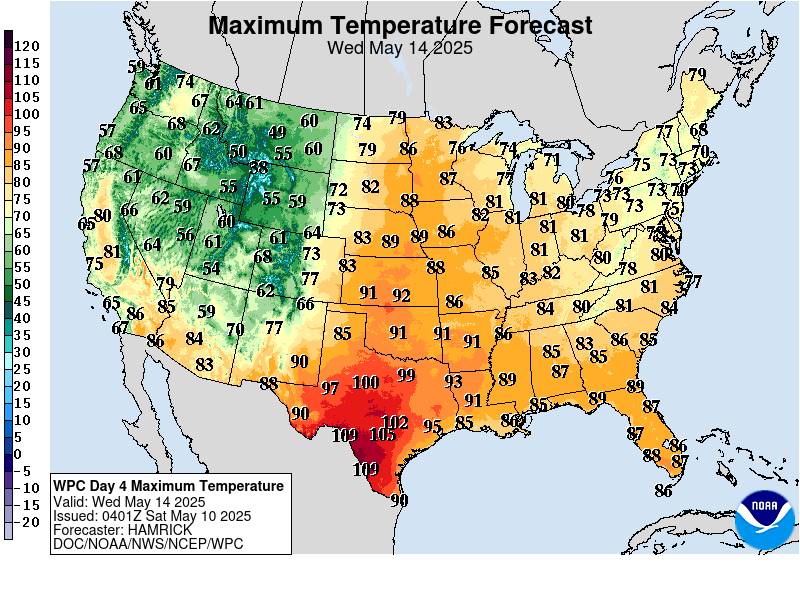
Temperatures cooling off now in the Upper Midwest and cooling spreads south:


Highs days 3-7 shows even more cooling in the Midwest that wasn't there on forecasts yesterday.



Week 2 temperature anomalies from the GFS ensemble mean are still impressively positive for much of the country.
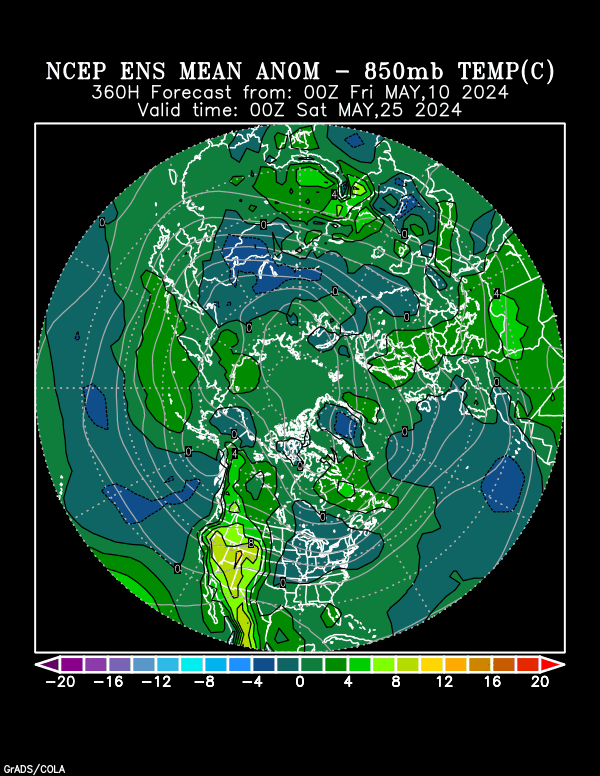
Extreme weather for days 3-7

Last GFS has impressive dome in week 2. So whats new?
gfs_namer_360_200_wnd_ht | gfs_namer_360_500_vort_ht |
gfs_namer_360_1000_500_thick | gfs_namer_360_850_temp_ht |