The heat is on today..........but with changes on Sunday: heat ridge shifts south and huge rains on top the heat ridge to bombard the main Cornbelt later this week. Cooler temps for Midwest and Plains with that.


Rains the past 24 hours.......Upper Midwest. ![]()
YYou can go to this link to see rain totals from recent time periods:
https://water.weather.gov/precip/
Go to precipitation, then scroll down to pick a time frame. Hit states to get the borders to see locations better. Under products, you can hit %normal.
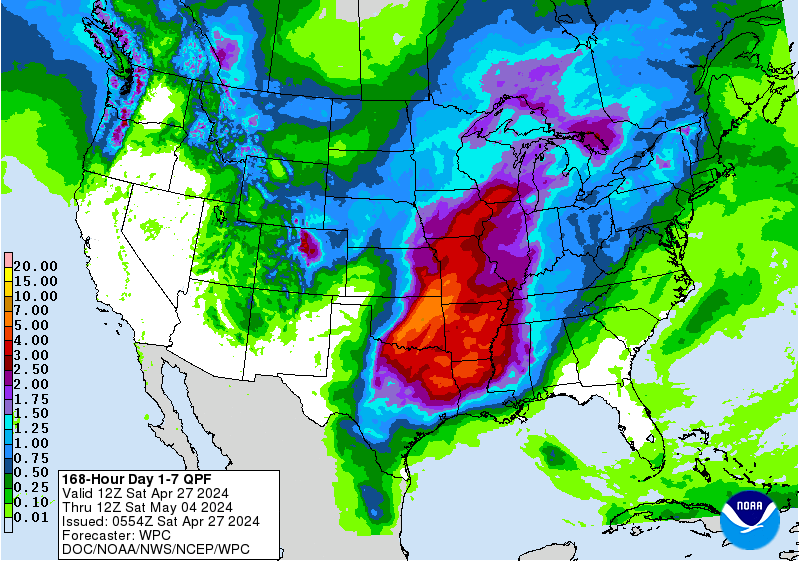
You can see how the big dry pockets.........have shifted southwest, from MO/KS southwestward. Since the crop ratings are near the best ever 77% GD/EX corn and 74% beans, clearly the previous dryness has not effected the condition of the overall crop yet.
Crop ratings dropped 1% on Monday........from the dry places.
This 4 week rainfall map shows mostly what it looked like before alot of the bountiful rains fell. This dryness developing is why we went up during May.
Rains above during the past 2 weeks are the biggest reason why we collapsed after that........."rain makes grain"
It's still very dry in MO/KS/AR/OK/TX.

Most importantly........forecast rains.
Rains the next 7 days .........have shifted farther south and now are predicted to bomb, SD/NE/KS/IA/IL, into IN/OH, over the top of the heat ridge in the south.
Day 1:
http://www.wpc.ncep.noaa.gov/qpf/fill_94qwbg.gif?1526306199054
Day 2:
http://www.wpc.ncep.noaa.gov/qpf/fill_98qwbg.gif?1528293750112
Day 3:
http://www.wpc.ncep.noaa.gov/qpf/fill_99qwbg.gif?1528293842764
Days 4-5:
http://www.wpc.ncep.noaa.gov/qpf/95ep48iwbg_fill.gif?1526306162
Days 6-7:
http://www.wpc.ncep.noaa.gov/qpf/97ep48iwbg_fill.gif?1526306162
Total accumulation
http://www.wpc.ncep.noaa.gov/qpf/p168i.gif?1526397762
Excessive rain threat too
Current Day 1 Forecast Valid 15Z 06/11/18 - 12Z 06/12/18 |
Day 1 Threat Area in Text Format
| Day 2 and Day 3 Forecasts |
Current Day 2 Forecast Valid 12Z 06/12/18 - 12Z 06/13/18 |
Day 2 Threat Area in Text Format
Current Day 3 Forecast Valid 12Z 06/13/18 - 12Z 06/14/18 |
CFS week 3 and week 4 really turning up the heat and shutting down the rain. Am just providing the guidance, not advocating it as a skillful source.
Temps

Rainfall

Interesting patterns in the picture - I've been watching this site for a long time, and i've never seen it so chaotic.
https://earth.nullschool.net/#current/wind/isobaric/1000hPa/orthographic=-87.60,31.65,400
If it wasn't for the extreme moisture flow, it would look very much like a classic drought in the eastern corn belt, wouldn't it? But, unless that pattern changes to interrupt that flow out of the Gulf, that probably won't happen.
what you are MISSING is the impact of PERSISTENT east coast trough..... its placement keeps bringing in these BIG cold fronts into the heart of the Midwest= big rain.
that trough is kept in place by the UNUSUAL sea surface temps in the North Atlantic
what? consistent rains? we had moisture from snow in april. we did not have meaningful rain from late april until last week. later this week looks wet but that is a prediction. this is central Indiana. there are areas in west central Illinois worse off the here. the rain has not been consistent in the corn belt except the n Iowa S minn corridor...that is where the ridging has occurred. Couple this with the record warmth of the last 6 weeks and crop prob are doing better than the weather would allow
Of course. I wasn't "missing" that. That trough has been a fixture for much of the time over quite a number of years now - rolling the cool air down into the middle of the country.
But, isn't there normally a Bermuda High that is the moisture pump out of the Gulf? I've never seen the Atlantic and Pacific this chaotic before.
Agricultural areas have become agricultural areas where warm moist air tends to meet cooler air from the north.
Will the massive dome on the 18z GFS verify?
gfs_namer_384_200_wnd_ht | gfs_namer_384_500_vort_ht |
gfs_namer_384_1000_500_thick | gfs_namer_384_850_temp_ht |
18z GFS ensembles moved very strongly in that direction.
12Z GFS ensemble run below for last day in the forecast period, followed by the 18z run...much more bullish and quite a change for an ensemble average...........but still 2 weeks out.
588 decameter contour on the 500 mb charts below(about the midpoint in the atmosphere) goes from Chicago IL to far Nothern Michigan.
Forecast Hour: 384
Image URL: http://mag.ncep.noaa.gov/data/gefs-mean-sprd/12/gefs-mean-sprd_namer_384_500_vort_ht.gif


Canadian ensembles have, by far been the most bullish with this heat ridge developing in week 2, for the past 10 days.
It has not changed its tune(now the GFS has not just moved in that direction, its even more bullish than the Canadian ensembles with the heat ridge)
Last run of Canadian ensembles from late this morning below(it comes out 2 times a day, the GFS comes out 4 times a day-every 6 hours)
384h GZ 500 forecast valid on Jul 03, 2018 12 UTC


Forecasts for the control (GEM 0) and the 20 ensemble members (global model not available)
European model not as bullish. It has the heat ridge farther south.
Here's what the NWS automated maps showed this afternoon:
6-10 day below
ArchivesAnalogsLines-Only FormatGIS Data | |
Temperature Probability | |
Precipitation Probability | |
8-14 day below
Temperature Probability | |
Precipitation Probability | |
From Friday, the NWS experimental outlooks for weeks 3 and 4.
Hot eastern half, dry southcentral US.
Temperature Probability | Precipitation Probability (Experimental)  |


