Heat coming to the Midwest then moves east.
Highs Sat-Wed below


Rains the past 24 hours........farther south. ![]()
Rains hit some of the driest spots!
You can go to this link to see rain totals from recent time periods:
https://water.weather.gov/precip/
Go to precipitation, then scroll down to pick a time frame. Hit states to get the borders to see locations better. Under products, you can hit %normal.
You can see how the big dry pockets.........shrank but there are still dry spots right now. Since the crop ratings are near the best ever 77% GD/EX corn and 74% beans, clearly the previous dryness has not effected the condition of the overall crop yet.
Crop ratings dropped 1% on Monday........from the dry places. They should maintain next week.
This is what it looked like before the rains. I will find an update later today:
Rains that fell, were over some of the driest areas. The map below is rain over the previous 4 weeks compared to average:

Here is the update:

Most importantly........forecast rains.
Rains the next 7 days, graph of totals. More in the Northlands.
Day 1:
http://www.wpc.ncep.noaa.gov/qpf/fill_94qwbg.gif?1526306199054
Day 2:
http://www.wpc.ncep.noaa.gov/qpf/fill_98qwbg.gif?1528293750112
Day 3:
http://www.wpc.ncep.noaa.gov/qpf/fill_99qwbg.gif?1528293842764
Days 4-5:
http://www.wpc.ncep.noaa.gov/qpf/95ep48iwbg_fill.gif?1526306162
Days 6-7:
http://www.wpc.ncep.noaa.gov/qpf/97ep48iwbg_fill.gif?1526306162
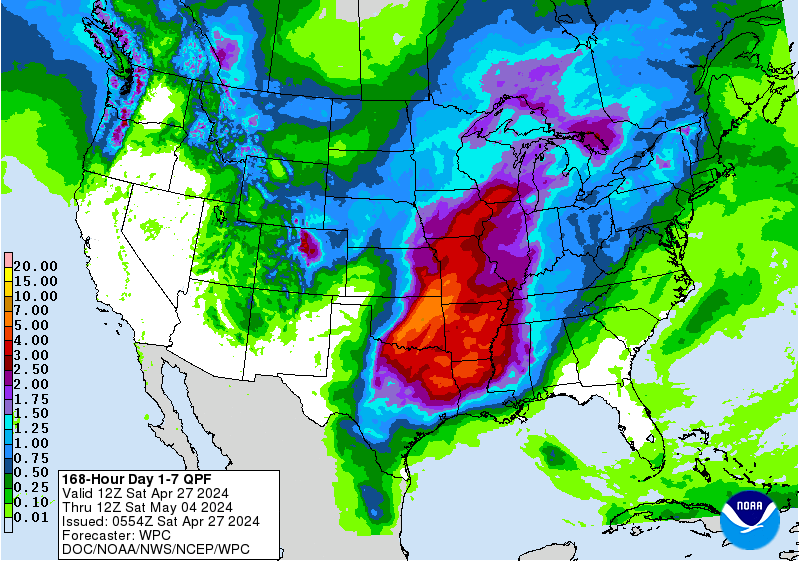
Total accumulation
http://www.wpc.ncep.noaa.gov/qpf/p168i.gif?1526397762
Some of those storms could be severe:
Severe Storm Potential the next few days:
Current Day 1 Outlook | Forecaster: Kerr Issued: 10/0107Z Valid: 10/0100Z - 10/1200Z Forecast Risk of Severe Storms: Enhanced Risk |
Current Day 2 Outlook | Forecaster: Bunting Issued: 09/1728Z Valid: 10/1200Z - 11/1200Z Forecast Risk of Severe Storms: Slight Risk |
Current Day 3 Outlook | Forecaster: Dial Issued: 09/0726Z Valid: 11/1200Z - 12/1200Z Forecast Risk of Severe Storms: Slight Risk |
Current Day 4-8 Outlook |
Excessive rain threat up there too
Current Day 1 Forecast Valid 15Z 06/11/18 - 12Z 06/12/18 |
Day 1 Threat Area in Text Format
| Day 2 and Day 3 Forecasts |
Current Day 2 Forecast Valid 12Z 06/12/18 - 12Z 06/13/18 |
Day 2 Threat Area in Text Format
Current Day 3 Forecast Valid 12Z 06/13/18 - 12Z 06/14/18 |
The always reliable week 3 and week 4 CFS (-:
Hot week 3 cooler week 4

Wet week 3, dry week 4..........so we have very warm to hot/wet, followed by cool/dry.

Just updated GFS.........other than the well known heat coming up in week 1, no dome in week 2 but tons of rain.......bearish grains.....
Not quite as cool early in week 1, so am unsure how it will effect ng.
Forecast Hour: 384
Image URL: http://mag.ncep.noaa.gov/data/gfs/06/namer/precip_ptot/gfs_namer_384_precip_ptot.gif

GFS was bearish late week 2 but Canadian ensembles are bullish! for ng with the heat ridge.
384h GZ 500 forecast valid on Jun 29, 2018 12 UTC


Extreme weather for days 3-7. Intense heat in the middle from a heat ridge.......heavy rains around it.
Hot in the Northwest for PJ.

Extended...........still very warm to hot.
Turning drier in the North during week 2?
We will see.
| 6 to 10 Day Outlooks | |
| Valid: June 19 to 23, 2018 Updated: 13 Jun 2018 | |
| Click below for information about how to read 6-10 day outlook maps Temperature Precipitation | |
| Click below for archives of past outlooks (data & graphics), historical analogs to todays forecast, and other formats of the 6-10 day outlooks ArchivesAnalogsLines-Only FormatGIS Data | |
Temperature Probability | |
Precipitation Probability | |
| 8 to 14 Day Outlooks | |
| Valid: June 21 to 27, 2018 Updated: 13 Jun 2018 | |
| Click below for information about how to read 8-14 day outlook maps Temperature Precipitation | |
| Click below for archives of past outlooks (data & graphics), historical analogs to todays forecast, and other formats of the 8-14 day outlooks ArchivesAnalogsLines-Only FormatGIS Data | |
Temperature Probability | |
Precipitation Probability | |
metmike, you see that thin little strip coming thry Indy right now? You would not believe the rain that little sucker put down in just a few minutes.....with the 90's coming all weekend this was a nice surprise for this area....actually the first moisture event that hit every field we farm since April
Congrats mcfarm,
I thought you must have received a widespread 2 inches on Sunday.
We had 7 different rains Sat-Tue and over 5 inches. The ground is saturated!
Last GFS still has a ton of rain.......the first map but lets look at the last 2 maps below closer.
Forecast Hour: 384
Image URL: http://mag.ncep.noaa.gov/data/gfs/18/namer/precip_ptot/gfs_namer_384_precip_ptot.gif

The first one below is the jet stream from the 12z run at the end of the period. Note the position of the Upper Low in South Central Canada, causes it to drop pretty deeply into the Midwest. The heat ridge is in the far southeast.
Heat in the south and very stormy
Forecast Hour: 384
Image URL: http://mag.ncep.noaa.gov/data/gfs/12/namer/200_wnd_ht/gfs_namer_384_200_wnd_ht.gif

The 2nd one from the just out 18gfs has just a slight shift in the even stronger jet stream which doesn't drop so far south........is more zonal and the strongest part, is still just hitting the West Coast.
Sort of small change but HUGE implications downsteam. The heat ridge is greatly pumped up/expanded across the southern half of the US.
The map below that, shows how much heat would be coming in and where it will be aimed with the 2nd scenario.
Forecast Hour: 384
Image URL: http://mag.ncep.noaa.gov/data/gfs/18/namer/200_wnd_ht/gfs_namer_384_200_wnd_ht.gif


Which one will happen?
No way to know because models don't have the skill to pin point exactly where a strong jet stream will be in 2 weeks. However, either one is just as possible. One is pretty bearish, the other could turn into the dome of death.
One other possibility but more outside chance is if the dome amplifies in the East and jet stream stays this powerful but is aimed toward the Plains to Upper Midwest and defines the new pattern.............we have a situation that resembles 1993 with flooding rains.
The bottom line is that this is late June and we have an unusually powerful jet stream coming over a very strong heat ridge.
The strong jet stream at this time of year will likely be associated with the downstream features becoming amplified.......if the pattern take on a configuration similar to the above maps.
The Candian ensembles are pretty bullish with the widespread dome idea. See those above. The GFS ensembles and European model, not so much.
I got harleyed today from that squall line. Amazing how that works. Glad Mcfarm got some rain.
And we got our 8th rain since Saturday from it Cutworm. Have not even checked the rain gauge but we are now over 5 inches in the last 4 days.
Sorry you missed almost all of it.
