Here are the comparisons of 12Z Sun run vs 12Z Fri run:
1. GEFS: despite being warmer for 12/5-7+ and looking fairly mild near the end, the overall model is 8 HDD colder for the comparions of common forecasted days. How will the market handle this? If supplies were much tighter, I would lean heavily on it opening higher on this. But with the very high production, it alone may lead to a lower open or maybe near even.
2. EPS: 6 HDD warmer. much warmer 11/29-30 but then much colder 12/1-3. Then warmer 12/4-6 and looking rather mild at the end. So EPS is clearly bearish.
I'm guessing a slightly lower open, especially after the big up day Fri and the bearishly high production. But who knows, 18Z GFS and especially 18Z GEFS can change things too.
This is a wonderful present for MarketForum and me Larry.........to see you posting!
I agree with your assessment(as is usually the case) and will piggyback the new natural gas thread off this shortly.
Great to read you back here!
Mike
On your comments, yes I was also looking at more HDD's in the GFS products and wondering how bullish this "might be" considering the overall pattern looks potentially less bullish, especially at the end of the period that, on Friday looked like it might turn extremely cold(and the risk of that being the most bullish, 2 days later on Sunday being the highest).
I thought the 6z very early Fri GFS ensemble being MUCH colder with the late week 2 pattern is what really ignited the early morning ng rally which continued thru the trading session.
No doubt you noted the milder EE after 1pm(late week 2) that caused a brief spurt down but ng bounced back as I think nobody wanted to be short for 2 days with the potential for the pattern to look extremely cold on Sunday and us trading near the highs. Just looking at the charts late Friday, this looked like the textbook technical set up for a typical, huge natural gas gap higher on the open Sunday Night.
With more HDD's on the GFS ensembles, and the last EE INCREASING the HDD's, as well as the pattern looking colder, it's conceivable that we could gap higher on the open.
The one model which usually does not get much attention is the Canadian model. It's light years warmer than than previous runs and the other models, with mild, zonal flow.
Last week, it was ahead of the other models in predicting the amplified, ridge/west, trough/east pattern many days before it showed up stronger in those models. So I am giving some serious weighting to the Canadian model.
Regardless, these are models and believing in any of them at the 2 week period, in the absence of solid agreement and consistency is the recipe for busting badly.
Considering the pattern and differences, temperature forecasts for some places on individual days between the warm and cold extremes late in week 2 are incredible.
Overnight, we could add or subtract massive HDD's.........and this discussion will be meaningless, with us trading sharply lower or higher on Monday.
Speaking of which, on Friday, the extreme cold potential for week 2 not showing up carried downside risk to the bulls because it looked so mild before hand. Now, it looks like that has reversed. The earlier period cold has increased and the farther out cold potentially decreased.
Another thing, the Sudden Stratospheric Warming event with potential for downstream cold in the US looks like a non event right now. That risk was probably supportive on Friday.........and the fact that we had record early season cold already, making the market wonder if that type of pattern might define our WInter.
Also, the negative AO, which was partly responsible for the extreme, Siberian/Arctic blasts that we had, this morning has numerous members jumping to some of the highest values I have seen in history. Still some drifting negative late week 2. The spread in solutions is mind boggling and shows the uncertainty and risks. The Canadian model ensembles solutions definately are very positive for the AO.......which are big warm indicators.
https://www.cpc.ncep.noaa.gov/products/precip/CWlink/daily_ao_index/ao.sprd2.gif

I'll have much more shortly.
A small gap higher that could get filled.
This would be a gap and crap, negative technical formation. If it doesn't get filled, its a bullish, upside break away gap.
edit: We did open with a small gap higher.
The gap higher was filled and we are trading below it.
Less HDD's on the 18z GFS products a factor. I think that turning colder overnight can reverse it higher and we will go in the direction of the temperature trends overnight, so this exhaustion, gap and crap(gap higher that fails), bearish technical signature can be invalidated rather quickly.
We remained below the gap for the last hour and are a bit lower for the day. A close lower tomorrow, would be a reversal down after a gap and crap that would look even worse on the charts.
But there is still enough cold to keep us supported here.........for now.
For natural gas, being down a few ticks on Sunday Evening means we are trading like a pussy cat.
I just realized that The December contract expires on Tuesday. Contract expiration, especially at this time of year often causes extreme price volatility in the couple of days prior to that.............and sometimes unpredictable.
The December contract is just over 3,000 contracts traded vs well over 8,000 in the next month, January after just over 2 hours of trading.
The January is down a bit more than the December. If the Dec spikes 1 way or the other the next 2 days because of expiration, it will pull the Jan but the Jan will not be as extreme.
for week ending November 15, 2019 | Released: November 21, 2019 at 10:30 a.m. | Next Release: November 27, 2019
-94 BCF a bit bullish
| Working gas in underground storage, Lower 48 states Summary textCSVJSN | |||||||||||||||||||||||||
|---|---|---|---|---|---|---|---|---|---|---|---|---|---|---|---|---|---|---|---|---|---|---|---|---|---|
| Historical Comparisons | |||||||||||||||||||||||||
| Stocks billion cubic feet (Bcf) | Year ago (11/15/18) | 5-year average (2014-18) | |||||||||||||||||||||||
| Region | 11/15/19 | 11/08/19 | net change | implied flow | Bcf | % change | Bcf | % change | |||||||||||||||||
| East | 909 | 932 | -23 | -23 | 808 | 12.5 | 893 | 1.8 | |||||||||||||||||
| Midwest | 1,069 | 1,106 | -37 | -37 | 964 | 10.9 | 1,076 | -0.7 | |||||||||||||||||
| Mountain | 205 | 207 | -2 | -2 | 175 | 17.1 | 210 | -2.4 | |||||||||||||||||
| Pacific | 292 | 290 | 2 | 2 | 259 | 12.7 | 326 | -10.4 | |||||||||||||||||
| South Central | 1,164 | 1,197 | -33 | -33 | 927 | 25.6 | 1,193 | -2.4 | |||||||||||||||||
| Salt | 299 | 313 | -14 | -14 | 254 | 17.7 | 339 | -11.8 | |||||||||||||||||
| Nonsalt | 864 | 884 | -20 | -20 | 673 | 28.4 | 854 | 1.2 | |||||||||||||||||
| Total | 3,638 | 3,732 | -94 | -94 | 3,132 | 16.2 | 3,698 | -1.6 | |||||||||||||||||
Totals may not equal sum of components because of independent rounding. | |||||||||||||||||||||||||
Working gas in storage was 3,638 Bcf as of Friday, November 15, 2019, according to EIA estimates. This represents a net decrease of 94 Bcf from the previous week. Stocks were 506 Bcf higher than last year at this time and 60 Bcf below the five-year average of 3,698 Bcf. At 3,638 Bcf, total working gas is within the five-year historical range.
For information on sampling error in this report, see Estimated Measures of Sampling Variability table below.

Note: The shaded area indicates the range between the historical minimum and maximum values for the weekly series from 2014 through 2018. The dashed vertical lines indicate current and year-ago weekly periods.
Natural Gas Intelligence midday comment:
NatGas Futures Market Shrugs as Season’s First Storage Withdrawal Tops Consensus
11:21 AM last Thursday.
https://www.investing.com/economic-calendar/natural-gas-storage-386
Latest Release Nov 21, 2019 Actual-94B Forecast-89B Previous3B
| Release Date | Time | Actual | Forecast | Previous | |
|---|---|---|---|---|---|
| Nov 27, 2019 | 10:30 | -89B | -94B | ||
| Nov 21, 2019 | 10:30 | -94B | -89B | 3B | |
| Nov 14, 2019 | 10:30 | 3B | 45B | 34B | |
| Nov 07, 2019 | 10:30 | 34B | 45B | 89B | |
| Oct 31, 2019 | 09:30 | 89B | 86B | 87B | |
| Oct 24, 2019 | 09:30 | 87B | 88B | 104B |
Incredibly cold temperatures that went into that last EIA report:
7 day temperatures that will go into this weeks report, released a day early, Wednesday because Thursday is Thanksgiving.
I'm guessing it comes out at 9:30 am.
Very mild West and chilly East vs average. For sure a much smaller drawdown. Any guesses Larry?
The main thing about the seasonal graph below to know is that prices in late November ALWAYS go down when its mild and almost always go down with average temperatures.
In some situations, they go down, with temperatures just a bit below average.
It usually takes major cold to make natural gas prices go higher in November.
You might note from the latest 6-10 and 8-14 day forecasts today, that we have quite a bit of cold but its not enough because, at the moment we are several ticks lower. We dialed in ever bit of that cold last week too.
This seasonal price chart below is for 2 decades, ending back in 2009.
 Seasonal Chart")
Natural gas 3 months below
Record heat in September caused the spike higher.
Record cold in early November caused the spike higher to end Oct/early November.
Now we have a distinct double top..........but
We also have a double bottom from the August lows to the Oct lows, with a higher low in November from this approaching cold.
Both double bottom lows were in a collapsing mode..............when the weather pattern changed drastically to much hotter(in Sept-adding massive CDD's, much colder in late Oct. adding massive HDD's)
We are currently trading closer to the highs. The chart below is for December, here on November 24th, with just 2 days of trading on that contract left.
We should note that on the January contract, we are trading MUCH CLOSER TO THE LOWS!
This also means the bull spreads have been making money(buy the front month-Dec, sell the next one Jan)
One assumes that the market knows most of the latest weather forecasts and has settled in this current price range, based on what it thinks the price should be at.
Big changes in the models overnight will add or subtract from this level.
Sometimes, when the huge funds take over trading early in the morning, the market will act differently and more volatile.
Usually, when we are sharply lower or higher well into the night, its a pretty good bet that the day trading session will pile on in that same direction.
We are close enough to unch right now, so that tendency will have zero impact.
If the Canadian model is ahead of the other ones with the pattern change to much milder in December, than this is/was a good place to sell.
If the very latest tendency for colder on the 18z GFS at the end of 2 weeks amplifies, this might be a good place to buy.
Looking at the EE again, it looked colder until late, when it turns much milder.
This is not providing anything useful to anybody, except maybe for me to try to get a better handle on everything by analyzing it to death, looking at all the factors.
The way to make money, is to immediately recognize when a price changing fundamental(weather) has changed convincingly enough to make a substantive effect on the demand for natural gas used for residential heating.
This is THE #1 factor that can change prices fast and sometimes last for weeks.
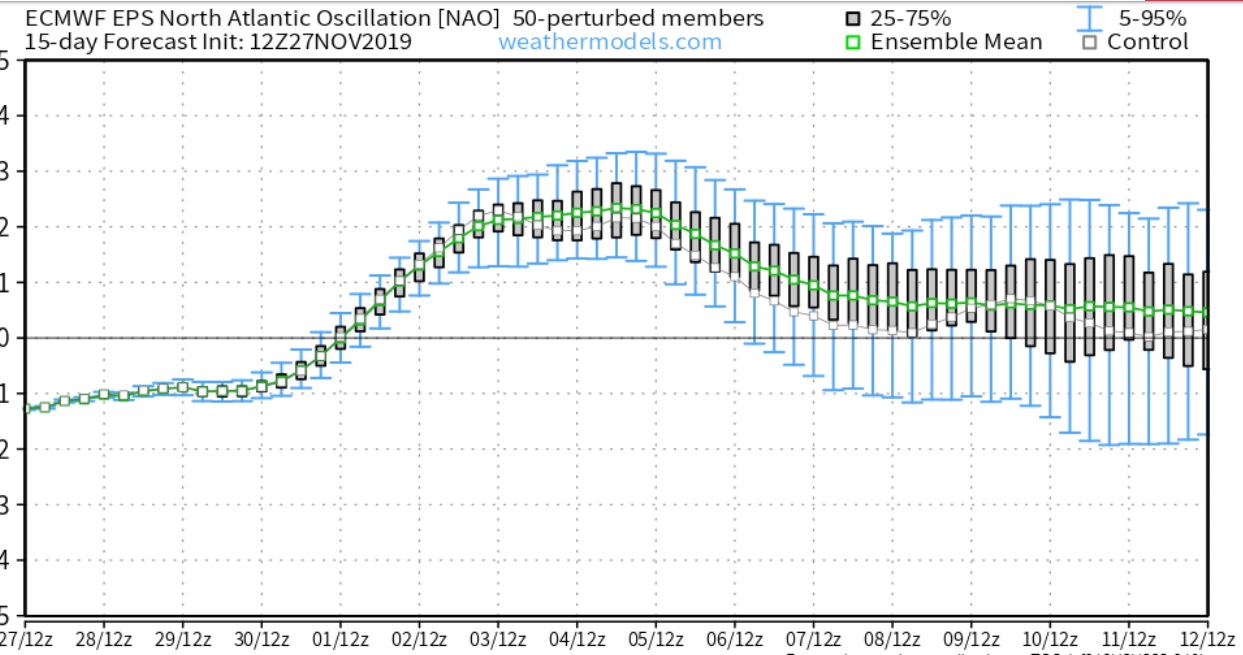
Ensembles go positive, way positive, AO and NAO around Dec 7th. This would support mild temps here in the US. Interesting that the Euro control goes negative during that same time. I was hoping we would continue to go up and sell a call but I’m at a wait and see right now.
Thanks grant.
Models followed that positive AO overnight and are drastically warmer......except for the 6z GFS which is the opposite and outlier and colder late in week 2 and not likely.
The highs are in.
Actually, the Canadian model is colder but it was already very warm and has been leading the other models with changes.
Powerful realtime fundamental analysis of weather dynamics manifest as natural gas price reaction. Truly dramatic collapse in ng price this morning. In general, does this imply warm weather leading up to Christmas in the Northeast, New York in particular? Just amazing... How many other trading forums have ionospheric caliber weather scientists readily applying up to the minute data to commodity price analysis??? Priceless. Rossby waves, now that's some meat with the potatoes!
Natural Gas Intelligence early Monday:
Natural Gas Futures Plunge Early as Forecasts Show ‘Big Decrease’ in Demand
8:55 AM
Overnight forecasts that lowered weather-driven demand expectations toward the second week of December sent natural gas futures plummeting early Monday. The December Nymex contract was down 11.2 cents to $2.553/MMBtu shortly after 8:30 a.m. ET.
metmike: The 0z GFS ensemble stated the huge drop down overnight with the milder solution. This, after ng had already done a "gap and crap" buying exhaustion not long after the open which signaled that the up move had lost steam.
Mondays weather:
US ensembles much milder early week 2 but much colder late week 2.
The late week 2 pattern is NOT a done deal.
The last 12z GFS and Canadian models are pretty cold late week 2 for the East but the just coming out European Ensemble is looking totally different and much milder.
The positive AO makes me think the mild solutions are better but those indices are also products that come from models and will show the similar errors when they are wrong.
NGI after the close on Monday:
Milder Forecast Prompts Sharp Sell-Off for Natural Gas Futures
5:19 PM
A milder-trending weather outlook Monday let the air out of a natural gas futures market struggling under the weight of oversupply. The December Nymex contract, set to expire Tuesday, plunged 13.4 cents to settle at $2.531/MMBtu. January settled at $2.584, down 12.6 cents, while February shed 11.4 cents to $2.541.
Guidance Shifts Warmer Once Again as Natural Gas Futures Sell-Off Continues Early
8:58 AM
Tuesday Weather from MarketForum:
Don’t forget, the EIA report is today instead of the usual Thursday.
Hey Larry, are you still out there or were you just trying to get my view on ng early Sunday?
Natural Gas Futures Steady Ahead of Early EIA Data as Holiday Break Looms
metmike: Looks like the report will be out at 11am.
The market is continuing to be pressured by milder temperatures, back down to major support at $2.50 but threatening to crash thru there.
A bullish EIA report might save the day for ng or a surprise turn colder in the models........the 12z GFS is coming out the warmest yet here at 10:40am.
So its looking bad at the moment...........but things can change.
for week ending November 22, 2019 | Released: November 27, 2019 at 12:00 p.m. | Next Release: December 5, 2019
-28 BCF not much market reaction
| Working gas in underground storage, Lower 48 states Summary text CSV JSN | |||||||||||||||||||||||||
|---|---|---|---|---|---|---|---|---|---|---|---|---|---|---|---|---|---|---|---|---|---|---|---|---|---|
| Historical Comparisons | |||||||||||||||||||||||||
| Stocks billion cubic feet (Bcf) | Year ago (11/22/18) | 5-year average (2014-18) | |||||||||||||||||||||||
| Region | 11/22/19 | 11/15/19 | net change | implied flow | Bcf | % change | Bcf | % change | |||||||||||||||||
| East | 894 | 909 | -15 | -15 | 782 | 14.3 | 873 | 2.4 | |||||||||||||||||
| Midwest | 1,052 | 1,069 | -17 | -17 | 941 | 11.8 | 1,055 | -0.3 | |||||||||||||||||
| Mountain | 204 | 205 | -1 | -1 | 171 | 19.3 | 208 | -1.9 | |||||||||||||||||
| Pacific | 293 | 292 | 1 | 1 | 255 | 14.9 | 323 | -9.3 | |||||||||||||||||
| South Central | 1,166 | 1,164 | 2 | 2 | 915 | 27.4 | 1,182 | -1.4 | |||||||||||||||||
| Salt | 303 | 299 | 4 | 4 | 258 | 17.4 | 338 | -10.4 | |||||||||||||||||
| Nonsalt | 863 | 864 | -1 | -1 | 656 | 31.6 | 844 | 2.3 | |||||||||||||||||
| Total | 3,610 | 3,638 | -28 | -28 | 3,062 | 17.9 | 3,641 | -0.9 | |||||||||||||||||
Totals may not equal sum of components because of independent rounding. | |||||||||||||||||||||||||
Working gas in storage was 3,610 Bcf as of Friday, November 22, 2019, according to EIA estimates. This represents a net decrease of 28 Bcf from the previous week. Stocks were 548 Bcf higher than last year at this time and 31 Bcf below the five-year average of 3,641 Bcf. At 3,610 Bcf, total working gas is within the five-year historical range.
For information on sampling error in this report, see Estimated Measures of Sampling Variability table below.
Note: The shaded area indicates the range between the historical minimum and maximum values for the weekly series from 2014 through 2018. The dashed vertical lines indicate current and year-ago weekly periods.
https://www.investing.com/economic-calendar/natural-gas-storage-386
| Release Date | Time | Actual | Forecast | Previous | |
|---|---|---|---|---|---|
| Nov 27, 2019 | 12:00 | -28B | - | -94B | |
| Nov 21, 2019 | 10:30 | -94B | -89B | 3B | |
| Nov 14, 2019 | 10:30 | 3B | 45B | 34B | |
| Nov 07, 2019 | 10:30 | 34B | 45B | 89B | |
| Oct 31, 2019 | 09:30 | 89B | 86B | 87B | |
| Oct 24, 2019 | 09:30 | 87B | 88B | 104B |
Hey Mike,
I’m still here.
Despite closing near the lows of the day, I thought prices were kind of hesitant to go down much despite the milder week 2 and considering the bearish production level. Something seemed to be keeping it above $2.50 most of the day. Lots of buying just above $2.50 until late when it finally gave way though it still didn’t really plunge after that. Maybe it being just before a major holiday was related to this??
Hi Larry,
The European model ensembles still look fairly mild at the end of 2 weeks but quite a few members of the GFS ensembles are looking colder and the AO drops back below zero on several solutions, with the NAO also falling late in the period.
This is low skill time frame but at this time of year, the market is trading potential cold pattern changes that might happen after 2 weeks.
GFS ensembles at 384 hours from 12z run below:


Which is just one possible explanation for why more aggressive selling couldn't keep us going lower with a fairly mild forecast at a time of year that is weak for prices seasonally.
This is a big time support area too. In August, the front months were plunging to new lows for the move but the Jan 2020 would not break below the current level..........no matter what.
We hit life of contract lows just a tad lower than today's low, in early August and we continued to trade down near today's low during most of the trading sessions that month but just would not break below it.
So the $2.50 area and just below is an area that has resulted in a brick wall of support and buying.
As you know, with ng at this time of year and plenty supplies and mild forecasts, support levels don't last long. The pattern is to break levels of support and see waves of selling as funds pile on and we keep dropping.............faster than what seems to make sense on some days.
Could just be a pause here with the huge funds that pile on to cause those big drops, being respectful of this massive technical wall of support enough to wait for a better view of the rest of December or even warmer temps(the last GFS Ensemble has me interested in playing the long side).
If it looked exceptionally warm, over the next week and prices dropped quickly to $2.2 next week, we would be laughing at this discussion because it suggested that $2.5 might hold. We can still go much lower if it gets warm enough for long enough.
Almost forgot. Back to weather. The Euro 45 day weeklies have slightly to modestly below temps and above HDD's thru much of the period. This is a bit supportive with around 46 HDD's above average. 1045 vs 999 average.
NGI after the close Thursday:
West NatGas Forwards Surge as Winter Storms Boost Demand; Futures Slide
3:11 PM
Volatility was in full force for natural gas forward prices in the days leading up to the long Thanksgiving Day weekend as weather models gave bulls some hope for a cold December, only to flip milder and then trend even warmer in the latest runs.
The EURO Ensemble NAO. Good sign for mild temps in the eastern US towards the first week of December. The control now matches the average members leading to more confidence.
Thanks Grant. Good point/contribution.
Thanksgiving weather: https://www.marketforum.com/forum/topic/43578/
Still mild, potential cold returning late in the forecast.
"It is never going to be cold again?" Huge drop
It seems like the market may be making up for its hesitancy in not falling more on Wednesday as we end November as even though the GEFS has warmed quite a good bit more since Wed at 12Z, the EPS has actually cooled a few DDS.
The longer range(beyond 2 weeks) forecasts also turned much warmer since Wednesday.
See the last 768 hour European model update from late yesterday at the end of this link below:
Weather Friday:
https://www.marketforum.com/forum/topic/43617/
Natural gas almost always goes lower in late November with temperatures average or warmer.
It sometimes goes lower even with modest cold in the forecast.
The last operational model GFS(12z) was the warmest one yet..........but is probably not going to inspire a ton of new selling when we have already dropped so far and the market has dialed in very mild temperatures as far as the maps go out.
If the rest of the guidance keeps coming out mild, it should keep a lid on any bounces higher the rest of the trading session............and be ammo for new lows if the market wants to do that.
Mike,
I don't know if you're being sarcastic. The 768 hour model? You know as well as I do that the 768 hour model of the best model in the world is about as telling as flipping a coin. It has literally no forecasting value. it isn't just "low skill". It is "no skill". Even the 360 hour Euro ens map or any ensemble map for that matter will often change wildly from run to run and has little forecasting value, much less the 768 hour map. One can simply look back at your posts about the changes in the 360 hour maps of the GFS and CDN ensemble maps from day to day and see that they jump around a lot.
The CFS and Euro weekly extended models are near worthless imo. The skill that far out is simply not there.
I think that instead what has happened is that the lack of dropping much Wednesday is being made up for as models still have little cold in week 2, which is enough right there to promote heavy selling of a heavily oversupplied market. And this is likely being accelerated today because it is the last trading day of the month. You know as well as I do that the market doesn't always go up or down each day with that same day's change in the models. I don't care what Bespoke or any other company might happen to say about the far extended/fantasyland.
Bottom line: there was no way to know this was going to occur, but the sharp selling imo is due to a continued lack of cold in most of the E US in week 2 in concert with continued very bearish supply/production.
Thanks,
You and I know that Larry but the market DOES trade it.
It was pretty cold on the previous update. It turned MUCH milder late yesterday.
The European model weeklies turned WARMER too over night.........thru Christmas.
The US weather thru the first 2 weeks is not much different other than going out another 2 days.
Natural gas is down $1,650/contract from 2 days ago.
I can't prove my points to you but at least for me, it reinforces my belief that the market trades weather guidance beyond 2 weeks in the month of December(which is what I have always traded, including last night).
The GFS Ensemble was actually a bit colder with around 5 more HDD's than the 6z run but the same as the 0z run.
I'll go flat and be nuetral here, preferring to buy on much colder outlooks.
If models don't turn colder, we can still go lower.
If the market were to move largely based on 768+ hours maps (I'm not saying it does and neither of us could possibly know because the market is comprised of many thousands of participants every day), it might as well move based on what a Magic 8 Ball says. If the market does that, it is quite ignorant about the total lack of skill that far out.
Larry,
Just so its clear that I agree with you that the 768 forecast is not reliable. The changes between yesterdays run and the previous one were monumental as evidence.
But that doesn't stop the market from trading it and other indicators that give it a peek beyond 2 weeks.
I have often said that I don't trade the actual weather. I trade the markets reaction to the changed weather forecast.
Some of my best trades came from being wrong about the weather but right about the markets reaction to the wrong weather forecast when it first came out.
At this time of year, price changes are mainly based on speculation about how much residential heating demand there will be.
Speculation, by definition includes some guessing and can include a range of confidence levels but in a speculative market like natural gas, there is no rule that requires speculators to only speculate on high confidence events/weather.
By the nature of this speculative market(and grains in the growing season), at certain times it will place a much higher weighting on low confidence, distant times frames because its trading model output that really is available..........can be accessed and seen by everybody and if enough of those everybody's are paying for and using that guidance for trading...........thats all that matters on the days they are using it. Most may know it will be different later in the week or the next week but in late November, if all the mid/late December low skill forecasts have shifted milder, in a market that speculates about the future, in the absence of colder weather previous to that, traders add warmth to the overall forecasts..............which increases selling and leaves nobody interested in buying.
Natural gas closed 15 minutes ago.
I wasn't even thinking about the early close and am glad the European model didn't come out with some outlier cold solution that caused me to buy just before the close and get stuck for 2+ days hoping the outlier solution was on to something and all the other models would turn colder too.
So will NG gap even lower on Sunday Night?
If the forecasts continue mild and we add another 2 days to the end of the forecast at this time of year, probably it will.
The European model, that had previously come out a bit colder very early in the morning, came out milder but matters zero on Sunday Night.
This could have/probably was a factor in the selling accelerating just prior to 12:30pm.
Here's the week 3-4 forecast based on the updated milder guidance for the 2nd half of December that I mentioned earlier which was a big factor is Friday's plunge lower(It turned warmer late Thursday):
 Prognostic Discussion for Week 3-4 Temperature Outlooks
NWS Climate Prediction Center College Park MD
300PM EST Fri Nov 29 2019
Week 3-4 Forecast Discussion Valid Sat Dec 14 2019-Fri Dec 27 2019
ENSO-neutral conditions continue across the Equatorial Pacific, with a robust Pacific Rossby wave and the ongoing strong positive phase of the Indian Ocean Dipole (IOD) dominating the global tropical convective field. Dynamical model MJO index forecasts suggest the potential for renewed MJO activity, with the enhanced phase crossing the Indian Ocean during Week-2. Lagged midlatitude teleconnections to an Indian Ocean MJO event favor a continuation of the positive AO/NAO height anomaly structure currently seen in the Week-2 guidance. Dynamical and statistical model guidance is broadly consistent with this pattern during the upcoming Week 3-4 period.
Dynamical model 500-hPa height anomaly forecasts from the CFS, ECMWF, and JMA are generally consistent with above-normal heights across the midlatitudes consistent with a positive AO structure and troughing over the North Atlantic and/or Greenland consistent with a positive NAO structure. The ECMWF has the weakest anomaly field, while the JMA maintains the strongest anomalies, with considerable anomalous ridging over the Eastern U.S. While there are differences in the placement of the ridges and troughs among the tools that impact their respective forecasts, the takeaway is that none of the guidance supports widespread arctic airmass intrusions into the U.S., and a progressive pattern is more likely than persistent blocks.
The overall temperature outlook is based on a consensus of the dynamical and statistical tools. Most guidance indicates the highest probabilities for above-average temperatures exist over the northern Mississippi Valley, extending southwest across the central U.S. The CPC Autoblend outlook also shows enhanced chances for above-average temperatures across New England and the mid-Atlantic, but there is considerable uncertainty in the guidance, with the SubX multi-model ensemble showing enhanced chances for below-average temperatures. Given the anticipated progressive pattern with brief cold outbreaks followed by warm air advection regimes, equal chances for below- and above-average temperatures are maintained across New England. The only location where below-average temperatures are favored is across the Great Basin, where above-average snowpack conditions may help keep temperatures lower than average in the absence of favored ridging. The temperature outlook across Alaska is similar to the previous week, with above-average temperatures favored across the western and northern areas due to above-normal sea surface temperatures, but an absence of a clear signal across the remainder of the state.
Weather Saturday....even milder and more bearish.
Some good robust discussion this week in this NG thread! NG is rarely boring and does pay a lot of attention to supply/demand fundamentals much of the time with forecasted weather being a very important part of it. How it reacts to the mix of numerous model runs is always the challenge from a wx standpoint. It is far from black and white as is the case for most markets. The more one can get a handle on what's already dialed in at any point in time, the better the chance to speculate profitably as future data/forecasts are released.
Thanks Larry!
For getting us started and your contributions.
NG is definitely our best market for robust discussions. .....from several people that trade it and have weather forecasting expertise.
Sunday Weather:
https://www.marketforum.com/forum/topic/43715/
12Z GFS ensembles have a surprise big cold surge early in week 2 that is new.
If it's on to something and other models follow......and especially if the next run amplifies it..........then ng has a chance to go up.
NG is up sharply this evening, I'm assuming the colder 12Z GEFS that Mike mentioned along with the 18Z GEFS maintaining that cold overall albeit with different timing (not quite as cold earlier but colder later). Helping some may be that the EPS, though not cold, is a little colder than the Fri 0Z run.
Natural gas did open higher and is reacting to colder 12Z model solutions for week 2.
I typed that post just after the open but just sent it, focusing on the corn market and dry forecast for Argentina but this could be bullish ammo for beans too.
Agree with your assessment Larry.
Monday early from NGI:
Natural Gas Futures Called Higher After Warmth Prompts ‘Intense Sell-Off’ on Black Friday
Monday Weather from MarketForum: https://www.marketforum.com/forum/topic/43760/
I'm adding the 762 hour European model just updated to that weather which is likely NOT going to verify. It shows variable weather, mild much of the time, especially East, until a couple of days before Christmas when a major cold outbreak hits the N.Plains/Midwest, another a week later, just before New Years Day and a 3rd one a few days after that.
5:33 PM
After Black Friday brought about one of the largest single-day losses of the year for natural gas futures, prices bounced back a little on Monday with help from one of the major weather models. The January Nymex futures contract climbed 4.8 cents to settle at $2.329/MMBtu. February rose 4.6 cents to $2.308.
metmike: The 18z GFS operational model is much colder than any of the previous runs, with an amazing 50 more HDD's for the 2 weeks.
However, the more stable and reliable GFS ensembles for 18z had the same number of HDD's.
On this last ensemble run, the ending few maps are especially milder in the middle of the country.
Earlier this afternoon, the European model ensembles were a bit colder with around +4 HDD's vs the previous 0z run.
8:57 AM
Natural gas futures continued to rebound early Tuesday as overnight forecasts advertised notably more frigid conditions for the Midwest and East later this month. The January Nymex contract was trading 8.5 cents higher at $2.414/MMBtu at around 8:40 a.m.
metmike: The ensembles were MUCH colder overnight
Tuesday's MarketForum Weather:
12z GFS ensembles came out MUCH colder.
Inconsistent GFS 12z operational model had come out milder before that.
NGI after the close Tuesday:
“Sizably Colder” Weather Data Giving Natural Gas Bulls Some Optimism
5:13 PM
Natural gas bulls are back in the game as the weather models uniformly trended colder overnight Monday. After the American data added an impressive chunk of demand in its midday run, the January Nymex gas futures contract spiked even higher before going on to settle Tuesday at $2.441, up 11.2 cents day/day. February jumped 9.7 cents to $2.405.
metmike: After the much colder GFS ensemble spiked us much higher, the European operational model came out mild and we sold off, along with its ensemble not being as cold as the GFS ensemble.
So we closed mid range.
I know Mike may disagree, but I think that the main thing NG traded today during the daytime is the high storage/production rather than wx. Don't get me wrong in that I think it considered wx at times. But most of the times it didn't imo.
Larry,
I agree that at times, the market seemed to ignore new weather data during the day session or even have spikes up and down not linked to a much colder or much warmer solution as it has been doing strongly and consistently in recent weeks.
Tuesday's 12z ensemble mean from the GFS was MUCH colder and spiked us MUCH higher.......to the highs of this move.
Last night's 0z run of the same model was MUCH milder and we sold off big time after that and the GFS ensemble forecasts have not changed much since then, so it seems as if we are mainly treading water.
The European ensembles have also not changed that much but the last run was colder and I'm guessing thats why the price right now is near the high end of the day session.......which featured a big spike higher to the highs of the day at the end of the European model operational 12z release. That spike was a bit odd, seemed overdone even though the Euro coming out then was a tad colder than the previous 0z run.
Sometimes the ng market will react strongly to each part of a key model run coming out, mainly the ensembles. If its a huge change at this time of year, you can bank on it.
Interesting that several mild days will cause the price to drop, then if that is followed by colder days vs the previous forecast, the market will immediately reverse, flip flop higher.
I am guessing that there is a fairly large group of traders that have access to the fastest released data that are all watching each map come out and when there are changes, they immediately send in orders. Within a few minutes, the price can spike up or down from this segment of traders. Probably some of them will even reverse their position.
I usually trade this way but almost never reverse. If a model solution is half way done and convinces me to buy for instance because its much colder, if the 2nd half is much milder, I might cover but would never reverse and go short.
NGI after the close Wednesday:
Futures Slip as Natural Gas Traders Wait to See How Weather Data Shakes Out
5:10 PM
The rollercoaster ride for natural gas prices continued on Wednesday as weather models whipsawed overnight, erasing much of the demand they had gained in recent runs. Given the lack of confidence in weather data, the January Nymex futures contract slipped 4.2 cents to settle at $2.399/MMBtu. February fell 3.1 cents to $2.374. Read More
Mike,
It almost seems as if the NG market has become tired from all of the wx related volatility of the last few weeks.
Larry,
Thanks, maybe traders are waiting until after the EIA number and are more focused on that in the absence of a one sided weather model shift.
On Tuesday, when the GFS Ensemble went MUCH colder it may have peaked/exhausted the short covering and buying and volatility too. We haven't had a model change that featured that great of a change since then.
In this environment of strong supplies, maybe we need more cold than usual to sustain buying with an uptrend.
We are a bit higher and extraordinarily calm and there are more HDD's on the GFS products, which are the coldest but the pattern does not look all that cold to me late in week 2.
After the EIA data is out, we shouldl be acting completely different. Volatility almost always goes way up afterwards.
NGI early Thursday:
Weather Models Show ‘Deep Divide’ as Traders Await EIA Data; Natural Gas Called Higher
8:56 AM
As traders prepared to shift their attention to the Energy Information Administration’s (EIA) latest weekly inventory report, and as the major weather models continued to disagree on the forecast for mid-December, natural gas futures were trading a few cents higher early Thursday. The January Nymex contract was up 3.1 cents to $2.430/MMBtu at around 8:40 a.m.
for week ending November 29, 2019 | Released: December 5, 2019 at 10:30 a.m. | -19 BCF slightly bullish
| Working gas in underground storage, Lower 48 states Summary text CSV JSN | |||||||||||||||||||||||||
|---|---|---|---|---|---|---|---|---|---|---|---|---|---|---|---|---|---|---|---|---|---|---|---|---|---|
| Historical Comparisons | |||||||||||||||||||||||||
| Stocks billion cubic feet (Bcf) | Year ago (11/29/18) | 5-year average (2014-18) | |||||||||||||||||||||||
| Region | 11/29/19 | 11/22/19 | net change | implied flow | Bcf | % change | Bcf | % change | |||||||||||||||||
| East | 891 | 894 | -3 | -3 | 756 | 17.9 | 857 | 4.0 | |||||||||||||||||
| Midwest | 1,040 | 1,052 | -12 | -12 | 917 | 13.4 | 1,035 | 0.5 | |||||||||||||||||
| Mountain | 200 | 204 | -4 | -4 | 168 | 19.0 | 206 | -2.9 | |||||||||||||||||
| Pacific | 286 | 293 | -7 | -7 | 253 | 13.0 | 320 | -10.6 | |||||||||||||||||
| South Central | 1,174 | 1,166 | 8 | 8 | 906 | 29.6 | 1,183 | -0.8 | |||||||||||||||||
| Salt | 316 | 303 | 13 | 13 | 262 | 20.6 | 343 | -7.9 | |||||||||||||||||
| Nonsalt | 858 | 863 | -5 | -5 | 644 | 33.2 | 839 | 2.3 | |||||||||||||||||
| Total | 3,591 | 3,610 | -19 | -19 | 3,000 | 19.7 | 3,600 | -0.3 | |||||||||||||||||
Totals may not equal sum of components because of independent rounding. | |||||||||||||||||||||||||
Working gas in storage was 3,591 Bcf as of Friday, November 29, 2019, according to EIA estimates. This represents a net decrease of 19 Bcf from the previous week. Stocks were 591 Bcf higher than last year at this time and 9 Bcf below the five-year average of 3,600 Bcf. At 3,591 Bcf, total working gas is within the five-year historical range.
For information on sampling error in this report, see Estimated Measures of Sampling Variability table below.
Note: The shaded area indicates the range between the historical minimum and maximum values for the weekly series from 2014 through 2018. The dashed vertical lines indicate current and year-ago weekly periods.
Natural Gas Futures Rally Higher Despite ‘Neutral’ EIA Storage Report
11:23 AM
The U.S. Energy Information Administration (EIA) reported a 19 Bcf withdrawal from storage inventories for the week ending Nov. 29, well within the range of market expectations
Spike to new highs in the first 35 minutes, then sold off after the first part of the 12Z GFS operational model came out MUCH warmer.
Wow, this is a record long thread!
Thursday Weather: https://www.marketforum.com/forum/topic/43912/
NGI after the close on Thursday:
Natural Gas Futures Rise After On-Target Storage Report; NE Cash Rallies on Alberta Clipper
5:37 PM
With recent long-term weather models not providing much guidance for price direction, natural gas traders looked to the latest government storage data for inspiration. With a storage withdrawal that was bigger than what some analysts had projected, the January Nymex contract settled 2.8 cents higher on Thursday at $2.427/MMBtu. February rose 2.4 cents to $2.398.
metmike: That title was pretty misleading.
1. They state in the title that the storage number was on target but then contradict that by suggesting the rise came from the storage withdrawal being bigger than what some expected.
2. The price actually came back down to the lower end of the range and closed very weak. There was good strength for around 35 minutes after the number came out but we put in those highs quickly and the market was very weak for the last 6 hours of trading.
The much warmer 12z operational GFS was the main bearish model and it caused a pretty good spike down when the warm part of it came out. We did recover after that but this recovery was followed by bearish price action.\
When the colder part of the European Ensembles was coming out, it was not able to push us higher like it usually would in a market looking for reasons to be bullish.
NGI early Friday:
Weather Models Send ‘Mixed Message’ as Natural Gas Futures Called Lower
metmike: The last important model to come out, the GGS 6z ensemble was milder and pressured the ng after 5:15 am.
Friday weather: https://www.marketforum.com/forum/topic/43950/
This product does not display much skill but like last Friday, when it turned sharply colder and natural gas went higher, it turned sharply warmer late Thursday and surely was an additional factor today.
The real impetus for the big sell off today was the GFS ensembles much milder outlooks. First with the 6z solution, then the 12z solution.
The fact that the same models/forecasts were predicting major cold over the upcoming holidays a week ago and now look mild proves Larry's point that they are not reliable.
| Week 3-4 Outlooks | ||
| Valid: 21 Dec 2019 to 03 Jan 2020 Updated: 06 Dec 2019 | ||
| Please provide comments using the online survey. | ||
| Temperature Probability | Precipitation Probability (Experimental)  | |
| Click HERE for information about how to read Week 3-4 outlook | ||
I was long as I thought we may see a small pop but as you say, the milder trend in the long range caused NG to continue to drop. I adjusted my position. I am still long but only slightly as I have sold calls against that position. I have a hard time believing we won't get a colder model trend again over the next two weeks allowing NG to go up. As long as it stays above 2.15 I'm good. If it goes below 2 then I'll have to get out again.
Saturday Weather: https://www.marketforum.com/forum/topic/43996/