Trader perspective---Monday was overdone. Couple days of recovery to fill the island gap. Probably that about it.
Probably a better short Thursday than a buy today (Tues)
tjc,
Thanks, I'll have some comments shortly.
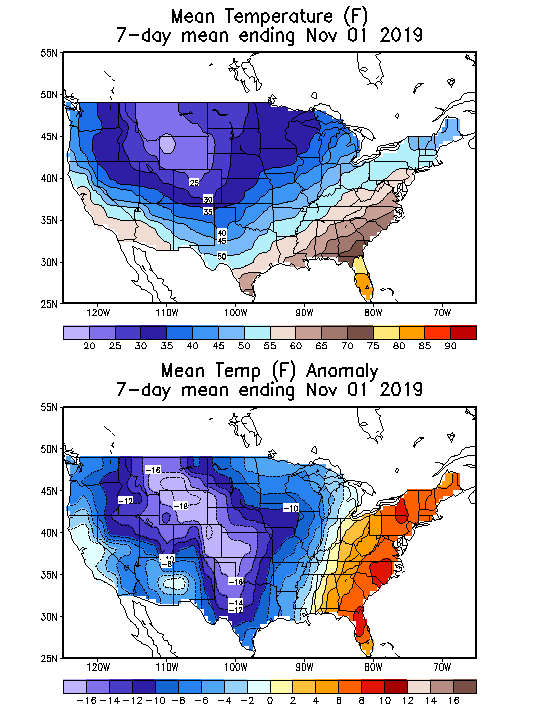
Tuesday's weather:
Natural Gas Intelligence after the close on Tuesday:
Natural Gas Futures Traders Eye More Seasonal Temps Later This Month as Prices Slide
5:17 PM
With more seasonal temperatures expected after this week’s widespread Arctic chills, the natural gas futures market shrugged off colder-trending guidance Tuesday to send prices slightly lower. The December Nymex contract eased 1.6 cents to settle at $2.621/MMBtu after trading as high as $2.685 and as low as $2.607; January settled at $2.714, off 1.4 cents.
metmike: guidance came out colder overnight(except for the GFS operational model- which has been coming out warm and causing brief spikes down) which caused the overnight price to move moderately higher.
However, we will probably need even stronger cold than that to re establish any sort of a move up. Temperatures on the models today have pretty close to average, so it's very hard to make a strong case for us to go higher but average temperatures may be all thats needed for us to go lower..........considering the time of year and supplies.
The AO is still predicted to be solidly negative thru 2 weeks and until that changes, I am open for the potential for guidance to start shifting colder and colder. That is not my prediction, just acknowledging a dynamic, that historically has happened very frequently.
The high latitude upper levels, which had shifted to be positioned for sending the coldest air towards N.Asia the last several days(for the rest of November) is not as clear right now but for sure for close to the next 2 weeks, Canada is going to get most of the major cold flushed out and cold fronts dropping south into the US will not be very cold. Minor changes could reinstate an Arctic connection to our air masses at the end of week 2 with that -AO persisting.
tjc,
With regards to filling the gap, my thinking is a bit different.
1. The only way that happens is with a major shift in the weather pattern back to very cold. I would want to be LONG before the gap was filled of course but still would not want to be short with that pattern, no matter what the price.
2. Filling a bearish, downside reversal island gap is BULLISH. At the very least, it negatives ALL of the bearishness which that formation signaled initially. Just on the chart pattern alone, not knowing the weather, I would never take the opposite side of a market that is sending us the opposite signal that it told us previously by opening the gap.
3. It's possible that we will get enough cold to surge high enough to close the gap, then the weather turns milder again. In the Winter, HDD's in the forecast compared to previous forecasts, as well as the actual weather pattern coming up MAKE the chart patterns, not the other way around. Last week, we couldn't get over the highs on many, many attempts because the cold was diminishing in the extended forecast. As often is the case, that became especially obvious between the Friday close and Sunday night open............no more major cold for, possibly 2 weeks. By Sunday evening, everybody knew it and nobody was interested in buying, so sell orders had to come waaaay down to much lower prices to get filled(to find any buyers) at a gap lower price.
4. Last nights bounce did take us back to 2.685. The bottom of the gap is around 2.718 and top is around 2.753. With the current set of maps and technical indicators all screaming LOWER, it will be impossible for us to get back to 2.685 in the next 2 days. The same maps tomorrow are more likely to cause lower prices than higher. I was short a couple of times earlier today but will just wait for the next model runs to decide on what to do if anything.
5. Weather that has already happened is usually just about all dialed in. We don't trade much on the past, mostly the future. So one assumes that the massive drawdonw which will take place on the EIA report next Thursday is mostly priced in. However, most EIA reports this year have been very bearish but the last one was actually bullish. This is going to make expectations for the next 2 EIA reports very uncertain. I never have a trade on ahead of a report but would think this would be one time for others to avoid it too.
One early guess for next Thursday is that the number will be bigger than expected, resulting in a brief spike higher, and if weather models are mild, a golden opportunity to sell the spike.
Between now and then the forecast will change alot. If its getting much colder again, we can take out last weeks highs but the chart formation looks really bad. I just checked the daily chart again and noticed that the bearish, island reversal lower on Sunday night, also gapped below the uptrend line that was established by this current cold pattern thats ending.
6. The psychology of the market counts here too. Extreme, record smashing cold this early in November , with record snows in some areas will have some traders cautious about getting overly bearish and, like last night, can result in some decent, aggressive buying on signs of the pattern returning. Traders are wondering if this pattern means the Winter of 2019/20 will be a frigid one. The earlier in the Winter it is, the more powerful cold forecasts have in moving prices. This does not apply in the 2nd half of the heating season when supplies are precariously low and volatility is extremely high. Here in November, sustained cold like the Winter of 2013/14(that took storage from near record highs to extremely low by using the most ng ever) is still possible. Not likely but possible and that market price will maintain some premium for that possibility this year in the heating season.
7. When we get to mid January, at the half way point of the heating season, certain bullish scenarios become physically impossible, even with sustained cold(absent an extraordinarily cold first half of Winter-which would mean prices are probably way overbought and very high already).
So the weather during the 2nd half of Winter usually has much less than half the potential to move prices. .....all things being equal outside of the time in Winter.
Natural gas 3 months below
This seasonal price chart below is for 2 decades, ending back in 2009.
We should note from this chart that prices often bottom in late August................and we did have a bottom in that time frame with a stronger than usual rally in September, thanks to the heat using up so much natural gas for cooling.
That top was well defined in September and would have been THE top.......but some intense early cold pushed us back to those highs...........which held last week.
Late October thru early December is very often a weak period for ng prices. When its warm during that period, its extraordinarily tough for prices to go up. The seasonal top might be in but much colder weather will give us a shot at new highs.  Seasonal Chart")
11:27 AM
+34 BCF
for week ending November 1, 2019 | Released: November 7, 2019 at 10:30 a.m. | Next Release: November 14, 2019
| Working gas in underground storage, Lower 48 states Summary textCSVJSN | |||||||||||||||||||||||||
|---|---|---|---|---|---|---|---|---|---|---|---|---|---|---|---|---|---|---|---|---|---|---|---|---|---|
| Historical Comparisons | |||||||||||||||||||||||||
| Stocks billion cubic feet (Bcf) | Year ago (11/01/18) | 5-year average (2014-18) | |||||||||||||||||||||||
| Region | 11/01/19 | 10/25/19 | net change | implied flow | Bcf | % change | Bcf | % change | |||||||||||||||||
| East | 932 | 913 | 19 | 19 | 830 | 12.3 | 903 | 3.2 | |||||||||||||||||
| Midwest | 1,109 | 1,095 | 14 | 14 | 977 | 13.5 | 1,076 | 3.1 | |||||||||||||||||
| Mountain | 207 | 211 | -4 | -4 | 182 | 13.7 | 213 | -2.8 | |||||||||||||||||
| Pacific | 292 | 298 | -6 | -6 | 265 | 10.2 | 327 | -10.7 | |||||||||||||||||
| South Central | 1,189 | 1,178 | 11 | 11 | 945 | 25.8 | 1,182 | 0.6 | |||||||||||||||||
| Salt | 303 | 293 | 10 | 10 | 250 | 21.2 | 330 | -8.2 | |||||||||||||||||
| Nonsalt | 886 | 885 | 1 | 1 | 695 | 27.5 | 852 | 4.0 | |||||||||||||||||
| Total | 3,729 | 3,695 | 34 | 34 | 3,199 | 16.6 | 3,700 | 0.8 | |||||||||||||||||
Totals may not equal sum of components because of independent rounding. | |||||||||||||||||||||||||
Working gas in storage was 3,729 Bcf as of Friday, November 1, 2019, according to EIA estimates. This represents a net increase of 34 Bcf from the previous week. Stocks were 530 Bcf higher than last year at this time and 29 Bcf above the five-year average of 3,700 Bcf. At 3,729 Bcf, total working gas is within the five-year historical range.
For information on sampling error in this report, see Estimated Measures of Sampling Variability table below.

Note: The shaded area indicates the range between the historical minimum and maximum values for the weekly series from 2014 through 2018. The dashed vertical lines indicate current and year-ago w
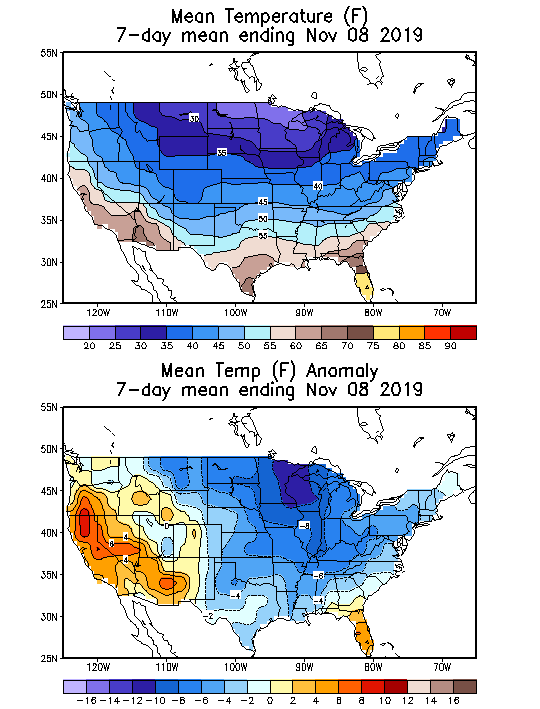
7 day temperatures for last Thursdays EIA report:
Not a lot of people live in the Rockies or Plains where it was cold and ng demand was near record high for those locations(exception is TX).
Very mild along the East Coast with its high population centers using less ng for heating than is typical at the end of October.
Latest Release Nov 07, 2019 Actual 34B Forecast45B Previous89B https://www.investing.com/economic-calendar/natural-gas-storage-386
| Release Date | Time | Actual | Forecast | Previous | |
|---|---|---|---|---|---|
| Nov 14, 2019 | 10:30 | 45B | 34B | ||
| Nov 07, 2019 | 10:30 | 34B | 45B | 89B | |
| Oct 31, 2019 | 09:30 | 89B | 86B | 87B | |
| Oct 24, 2019 | 09:30 | 87B | 88B | 104B | |
| Oct 17, 2019 | 09:30 | 104B | 106B | 98B | |
| Oct 10, 2019 | 09:30 | 98B | 97B | 112B |
Here are the 7 day temperatures for this Thursdays report. Our first drawdown of the season coming up?
Natural Gas Intelligence early Wednesday:
Natural Gas Bears Said In Charge; Market Looks for ‘Sustained Strong Cold’ as Futures Slide Early
metmike: There is a good area of support at 2.575 from Nov 1, the lows of the month that has held so far(but looks vulnerable). Maps overnight were slightly colder(GFS ensembles) and around the same for the European model.
Warmer `12z guidance may send us crashing thru those lows/support. MUCH colder wil do the opposite.
Wednesday Weather:
Signs of Hope for Natural Gas Bulls as Afternoon Weather Data Inspires Late Gains
5:48 PM
Natural gas futures eased lower in Wednesday’s trading before a fresh round of colder-trending weather data coincided with a rally after the settle; the December Nymex contract settled at $2.600/MMBtu, down 2.1 cents, but the front month was trading back above $2.670 at around 4 p.m. ET. January settled lower at $2.692 but was trading around $2.755 as of around 4 p.m. ET
metmike: massive reversal higher when the European model ensembles came out MUCH colder after 1:30pm.
Trading at/near 268. More confirmation of low may get the gap filled.
MetMike leans bullish(?)---I say sell by Friday
Weatherman usually wins initially!!
Thanks tjc,
If you can tell me what the weather models show on Friday, then I can tell you what natural gas will be doing.
You will likely be right on Friday about selling if the weather models are not colder.
All day today, the market could not drop much below 2.575, which was the Nov low and strong support. It went down there and just below numerous times and trading in that area for a very long time. When natural gas is collapsing lower after putting in a major high and the weather pattern has changed it NEVER, EVER happens like this.
It blows thru the support, hits tons of stops, then continues plunging lower, with the funds often piling on the shorts. Instead, we had lots of big buyers at that level that wanted to be long. The overnight GFS ensemble was sharply colder which gave us a heads up. The position of the high latitude -AO upper level high has shifted and the huge deal was a -NAO, for the first time in a long while. This greatly favors cold in the East and even Midwest.
The cold initially will not be especially cold because Canada will be unusually warm, so cold fronts will not be of Arctic origin like the last few;.
However, this early heating season record cold that is receding has the ng market on edge/very sensitive to changes in the forecast right now.
Telleconections seem to point to the threat of colder air again towards the end of the month. NAO was going positive a few days ago towards the end of he month, now it is forecast to be negative through the end of the month. PNA is positive which typically helps send cold air into the eastern US. The problem becomes where does the cold air come from? Both GFS and EURO ensembles warm the western US and Canada which is typical for a positive PNA. The above average heights over Alaska again could send another cross polar flow set up towards the eastern US. I am still long but again have a call against that position. NG has blown through my call at this time so if it trades flat to slightly up for the next couple of weeks I will do great. It can drop a long way before it is a loser.
I agree Grant.
The upper level high anomalies at high latitudes are predicted to be over Northeast Canada at the end of 2 weeks(but changing alot from day to day forecasts), connected with the -NAO that we mentioned earlier and upper level troughing possibly in the Northeast.
Heating oil is not as good for trading weather but could be supported nicely if its cold enough and a huge Nor'easter often brings a big spike in prices ahead of it.
Since the liquid energies are global markets(unlike ng which is just US) the change in the price of oil can really mess up a good weather trade if its in the opposite direction.
One safer way to trade that is to do a spread with unleaded gas, long ho, short rb. The problem there is that ho oil can go up 4c but if rb goes up 3c, your profit is only 1c =$440
vs 4 X $440 =$1,760.
I may have done the spread one time 20 years ago but will just go with the ho by itself.
I think it was the late Winter of 2015 when the Northeast got clobbered with record snow(Boston) and cold and ho soared high for over a month. This is the type of ideal weather trade for ho that does not happen very often.
This is favorable for air masses in Canada to track south into the US but the air masses are not that cold in Canada, so just slightly below average initially.
for week ending November 8, 2019 | Released: November 14, 2019 at 10:30 a.m. | Next Release: November 21, 2019
+3 BCF a bit bearish Working gas in underground storage, Lower 48 states Summary text
CSV
JSN Historical ComparisonsStocks
billion cubic feet (Bcf) Year ago
(11/08/18)5-year average
(2014-18) Region11/08/1911/01/19net changeimplied flow Bcf% change Bcf% changeEast932 932 0 0 834 11.8 904 3.1 Midwest1,106 1,109 -3 -3 989 11.8 1,085 1.9 Mountain207 207 0 0 181 14.4 213 -2.8 Pacific290 292 -2 -2 266 9.0 328 -11.6 South Central1,197 1,189 8 8 970 23.4 1,200 -0.3 Salt313 303 10 10 269 16.4 340 -7.9 Nonsalt884 886 -2 -2 701 26.1 860 2.8 Total3,732 3,729 3 3 3,241 15.1 3,730 0.1
Totals may not equal sum of components because of independent rounding.
Working gas in storage was 3,732 Bcf as of Friday, November 8, 2019, according to EIA estimates. This represents a net increase of 3 Bcf from the previous week. Stocks were 491 Bcf higher than last year at this time and 2 Bcf above the five-year average of 3,730 Bcf. At 3,732 Bcf, total working gas is within the five-year historical range.
For information on sampling error in this report, see Estimated Measures of Sampling Variability table below.
Note: The shaded area indicates the range between the historical minimum and maximum values for the weekly series from 2014 through 2018. The dashed vertical lines indicate current and year-ago weekly periods.
Natural Gas Futures Retreat as EIA Report Misses, Extends Injection Season
11:26 AM
The Energy Information Administration (EIA) reported a net 3 Bcf injection into U.S. natural gas stocks Thursday, extending the refill season another week...
Thursday weather: https://www.marketforum.com/forum/topic/42866/
NGI after the close on Thursday:
Natural Gas Futures Finish Higher as Traders Mull Differing Weather Models
6:05 PM
As the market digested divergent weather outlooks and a slight bearish miss from the latest government storage data, natural gas futures finished higher on Thursday but gave back some of the gains recorded late in the previous session. The December Nymex contract settled at $2.647/MMBtu, up 4.7 cents day/day but well off the $2.696 intraday high. January settled at $2.719, up 2.7 cents.
Models are COLDER!
Friday weather: https://www.marketforum.com/forum/topic/42915/
Filled part of the bearish gap, trading to a high of 2.724 above the Sunday high or 2.718.
The 12 z Euro model just out is WARMER and we've backed off.
Sunday Weather: https://www.marketforum.com/forum/topic/42997/
Lower open as the threat for extreme cold is not there, however models are really not milder than Friday to justify a compelling case for going sharply lower, especially in light of the fact that the cold will be focused on high population areas and also a -AO and especially now a -NAO.
If the models shift in one direction overnight then ng will follow but I have no idea in what direction that might be.
We have a bearish supply situation and bearish seasonals.
The EIA report will be pretty bullish because last week was so cold but was likely dialed in.
We did NOT fill the bearish gap lower from last Sunday Night but filled it partially on Friday when the 12z GFS products came out MUCH colder.
That unfilled gap looms as a negative technical formation and needs to be filled by much colder weather models to inspire aggressive buying.
Early morning update: 0z models all turned MUCH milder. The US models incredibly milder. 6z run after that was not quite as mild but still milder than all the previous runs.
Natural Gas Futures Plummet as Guidance Loses ‘Considerable Amount’ of Heating Demand
8:55 AM
A much warmer forecast over the weekend saw natural gas futures drop off sharply from Friday’s levels after gapping lower Sunday. Shortly before 8:40 a.m. ET Monday, the December contract was down 9.7 cents to $2.591/MMBtu
Monday Weather..........much milder!
12Z EURO ensembles coming in warmer as well. My position is still a winner but now my contract is a loss. Hoping it can go up 5 cents over the next couple of weeks. I still have a lot of premium in that call I sold. So it is helping me out. That was the plan.
Grant,
Surprised that you are staying long the futures contract with the warmer forecasts pressing us lower.
If we flip colder again, we can go back up of course. Is that what you're thinking?
If we get very mild for 2 weeks, ng can plunge a lot lower than most might think.
Pattern Too Mild for Well-Supplied Natural Gas Market as Futures Prices Plunge
5:16 PM
The latest forecasts Monday failed to deliver the kind of intense cold needed to impress the natural gas futures market, lowering heating demand expectations into early next month and prompting a steep sell-off. The December Nymex contract settled at $2.566/MMBtu, down 12.2 cents from Friday. The January contract dropped 12.0 cents to $2.630.
Tuesday weather(turning colder soon??):
https://www.marketforum.com/forum/topic/43110/
Further Losses Early For Natural Gas Futures Amid Forecasts For Near-Normal Temps
I probably should have gotten out last week. I still have a lot of premium in my call so it's a small winner. Today hurt and will make me rethink future plays. Probably going to stay in through Thursday to see what happens with the report, unless it continues to tank tomorrow, which it might.
Thanks Grant,
Hindsight is always 20-20 and I am leaning more towards models getting colder and being supportive to natural gas prices at the moment.
Historically, this is a very, very tough time of year for ng prices to go up unless the forecast turns MUCH colder.
You probably noted the 12z GFS ensemble came out a decent amount colder(6z GFS operational much colder) and the affect was very short lived with prices dropping below where they were before the models came out, not long after that.
The Canadian model is looking really cold at the end of 2 weeks, with some solutions showing the incursion of the polar vortex way far south.
With the jet stream sagging farther and farther south and and upper level troughing across much of the country, this solution has some credibility.
These incursions south of the Polar Vortex seem to have increased a great deal over the last 10 years.
The WInter of 2013/14 was especially noteworthy.
We used the most natural gas for residential heating that WInter in history by a wide margin.
Ideally, I'd like to see the AO getting back to some extreme negatives with some very high latitude upper level ridging/blocking to hook up with the troughing farther south in the mid latitudes so we could flush the cold south.
The cold in Canada will not be that cold for awhile and cold fronts dropping into the US don't have Arctic or Polar air.
We have too much warmth(not enough cold) in the high population centers of the East right now. You may have noted Heating Oil getting crushed.
HO is mainly used for heating in the Northeast and forecasts there have warmed up since the end of last week(when Nor'easters also looked like a threat but now, the trough is too far west).
https://www.eia.gov/energyexplained/heating-oil/use-of-heating-oil.php
Wednesday Weather(colder overnight)
https://www.marketforum.com/forum/topic/43163/
NGI early call: Colder Trends Boost Natural Gas Futures Early as December Pattern Remains ‘Tricky Call’
NGI after the close on Wednesday:
Natural Gas Bulls Gain Foothold as Colder-Leaning Forecasts Lift Futures
5:11 PM
Colder trends in the outlook for later this month into early December helped natural gas futures snap a two-day losing streak Wednesday. Bouncing back partially from heavy selling during Monday’s and Tuesday’s sessions, the December Nymex contract added 4.9 cents to settle at $2.559/MMBtu. January settled at $2.611, up 3.5 cents.
metmike: The EIA tomorrow is going to show a huge drawdown for so early in the heating season. Wondering if this has some traders staying on the sidelines or avoiding the short side before the release.
metmike: Models warmer overnight but still the threat of turning colder in early December. Huge(drawdown) EIA report coming up.
Natural Gas Futures Called Lower as Market Awaits ‘Tricky’ EIA Data; Overnight Guidance Mixed
8:55 AM
With the market bracing for the latest government inventory data, and with overnight forecasts mixed, natural gas futures were trading slightly lower early Thursday. The December Nymex contract was down 2.4 cents to $2.535/MMBtu at around 8:30 a.m. ET
for week ending November 15, 2019 | Released: November 21, 2019 at 10:30 a.m. | Next Release: November 27, 2019
-94 BCF a bit bullish
| Working gas in underground storage, Lower 48 states Summary text CSV JSN | |||||||||||||||||||||||||
|---|---|---|---|---|---|---|---|---|---|---|---|---|---|---|---|---|---|---|---|---|---|---|---|---|---|
| Historical Comparisons | |||||||||||||||||||||||||
| Stocks billion cubic feet (Bcf) | Year ago (11/15/18) | 5-year average (2014-18) | |||||||||||||||||||||||
| Region | 11/15/19 | 11/08/19 | net change | implied flow | Bcf | % change | Bcf | % change | |||||||||||||||||
| East | 909 | 932 | -23 | -23 | 808 | 12.5 | 893 | 1.8 | |||||||||||||||||
| Midwest | 1,069 | 1,106 | -37 | -37 | 964 | 10.9 | 1,076 | -0.7 | |||||||||||||||||
| Mountain | 205 | 207 | -2 | -2 | 175 | 17.1 | 210 | -2.4 | |||||||||||||||||
| Pacific | 292 | 290 | 2 | 2 | 259 | 12.7 | 326 | -10.4 | |||||||||||||||||
| South Central | 1,164 | 1,197 | -33 | -33 | 927 | 25.6 | 1,193 | -2.4 | |||||||||||||||||
| Salt | 299 | 313 | -14 | -14 | 254 | 17.7 | 339 | -11.8 | |||||||||||||||||
| Nonsalt | 864 | 884 | -20 | -20 | 673 | 28.4 | 854 | 1.2 | |||||||||||||||||
| Total | 3,638 | 3,732 | -94 | -94 | 3,132 | 16.2 | 3,698 | -1.6 | |||||||||||||||||
Totals may not equal sum of components because of independent rounding. | |||||||||||||||||||||||||
Working gas in storage was 3,638 Bcf as of Friday, November 15, 2019, according to EIA estimates. This represents a net decrease of 94 Bcf from the previous week. Stocks were 506 Bcf higher than last year at this time and 60 Bcf below the five-year average of 3,698 Bcf. At 3,638 Bcf, total working gas is within the five-year historical range.
For information on sampling error in this report, see Estimated Measures of Sampling Variability table below.
Note: The shaded area indicates the range between the historical minimum and maximum values for the weekly series from 2014 through 2018. The dashed vertical lines indicate current and year-ago weekly periods.
Thursday weather: https://www.marketforum.com/forum/topic/43204/
Natural Gas Intelligence midday comment:
NatGas Futures Market Shrugs as Season’s First Storage Withdrawal Tops Consensus
11:21 AM
I sold my long position for a small win. Left a lot of money on the table last week. During the spike right after the report a sold a call. Bought it back for a small win. So not a bad morning.
Congrats on that one grant.
That spike higher after the report was a good one to sell with less HDD's in the overnight forecast.
I'm concerned about the potential for some extreme cold late in week 2, with a Polar Vortex type low coming very far south.
Where it sets up........IF it sets up will determine where the cold will go.
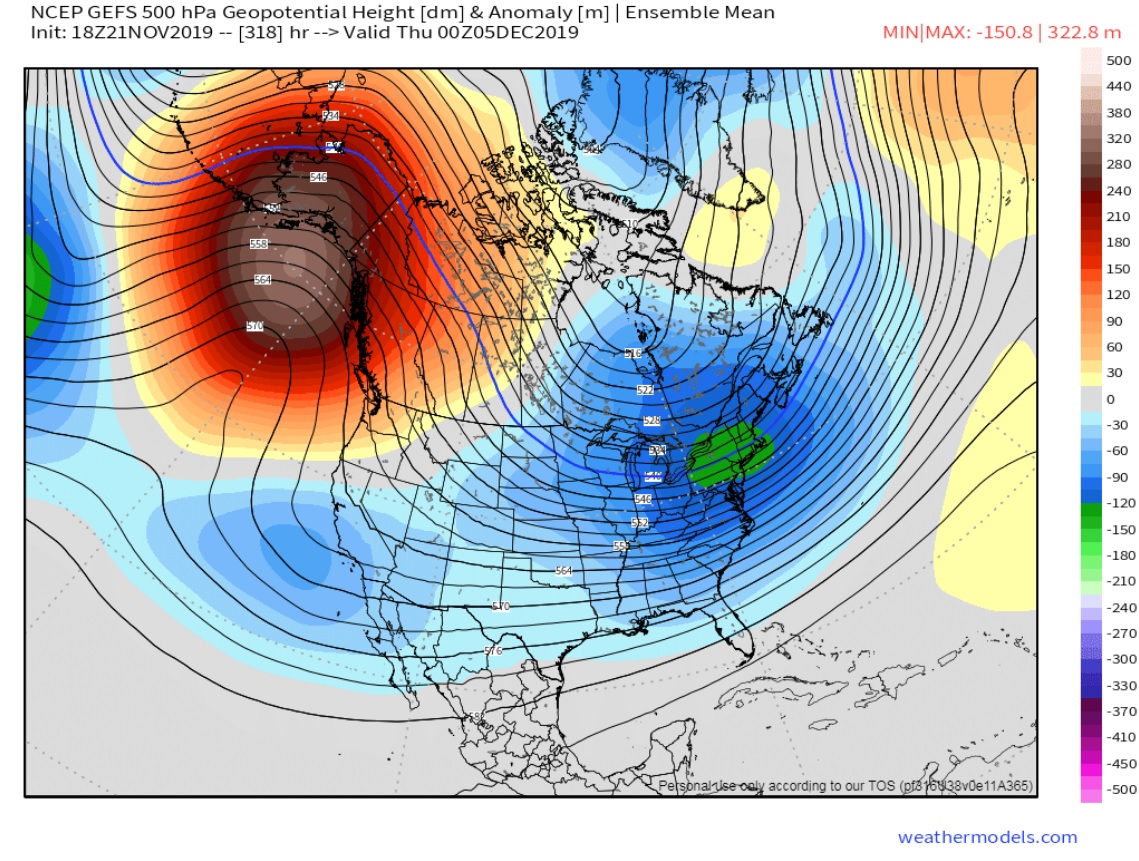
The 18Z GFS Ensembles basically open the freezer door into the US the first week of December. That is an impressive 500mb chart. It makes the flow more cross polar a few days later.
Thanks Grant!
I thought that the 12z GFS ensembles looked even colder than this but its just model to model variation.
I mentioned earlier this week that the Canadian model has been showing this for some time. It was a couple of days ahead of the rest with the strength/amplitude of the ridge west, deep trough-polar vortex low(on some members) east.
6z GFS ensemble was the coldest yet with late week 2 pattern.
WOW
Looks like a sudden stratospheric warming event and likely disruption of the polar vortex as I have speculated on this week.
Being short ng is usually a good play in late November.....if this solution is close, ...that will cost you because ng has a shot at new highs next week.
Ahead of this potential cold outbreak it will be pretty mild and this is an early december event.
So if the cold blast shifts.....is not aimed at the Midwest and east, there is a lot of downside risk too.
But for me, I am only playing the long side when models have the extreme cold risks on the latest olutions.
If they lessen than being short is ok....for me.
I mention thi because the European model was less threatening and milder earlier tonigh and just that caused ng to drop for a couple of hours.....until the colder GFS came out and gave us this little bounce back.
You will note the HO gaining on the RB/gas from this colder threat to the northeast.
I was showing my other Mets at work the possible sudden stratospheric warming and how this would dislodge the polar vortex IF it happens. But we will get the hear polar vortex over and over again on the news and how climate change is causing it

Stratospheric Polar Vortex shown here moving off the North Pole in early December. (Judah Cohen)
Not sure why my last post was cut in half? Anyway. I went on to say I thought the models were trending much colder as I went to bed. Went long before calling it a night. Closed it this morning for a nice gain. Almost got back all the money I lost by not closing my position last week.
Congrats Grant!
When the Euro came out warmer after midnight, it gave us some lower prices to buy before the GFS ensembles came out colder after 5am.
If this polar vortex solution busts, the downside is huge.
That is the ONLY thing lifting us here.
Friday weather: https://www.marketforum.com/forum/topic/43264/
Extreme cold threat is elevated for week 2. Off the charts risk and uncertainty based on if the Polar Vortex shifts south and where. This will determine the coldest places.
A slight shift can mean a 40 degree temperature change for some places in the East.
The milder temps ahead of the potential cold blast is what makes it especially risky(for longs) if the cold blast busts.
Saturday's weather..........not quite as cold?