I thought I would kick this subject off with a look at the analogs for below zero temperatures. I am sure much of this is baked in to the price but the analogs are showing over a 60% of below zero temps in the upper Midwest next Sunday through Tuesday. Models runs continue to come in cold for the next two weeks east of the Rockies.

Pretty amazing extreme -AO pattern!
Thanks Grant! tjc actually kicked it off last night. I made an initial comment, then got tied up doing other stuff(chess practice starts at our 5 schools this week) and didn't complete the thread with the usual ng information.
I'll try to catch up later tonight.
Monday Natural Gas Intelligence after the close:
Cold Pattern Shows Staying Power as Natural Gas Futures Continue Climbing
Further cold trends from the latest guidance kept the fire burning for natural gas futures prices Monday, extending last week’s gains for a market focused on early-season weather signals. The December Nymex contract settled 10.7 cents higher at $2.821/MMBtu after probing as high as $2.842. January picked up 9.6 cents to settle at $2.898, while February settled 8.7 cents higher at $2.849.
0z operational GFS came out much warmer but before it was even finished, the more reliable ensembles came out amazingly colder(for the ensemble average).
So we spiked higher in a flash!
As I mentioned earlier on another thread due to our late corn cropping season there's a lot of artificial corn drying happening with both NG and LP gas being heavily used. Our local farm cooperative just received a load of LP gas on Sunday morning all the way from North Carolina direct to W.Mn. That's close to 1400 miles one way just to try to keep a few farmer's corn dryers going for a short time. I cannot imagine how high the freight bill on that load of LP would be. Most of the local grain elevators grain dryers are hooked up to the NG pipelines running from town to town so they are able to keep drying.
http://www.agweb.com/article/propane-delivery-crisis-plagues-midwest
Thanks cliff!
Here's information from the previous discussion on this last week:
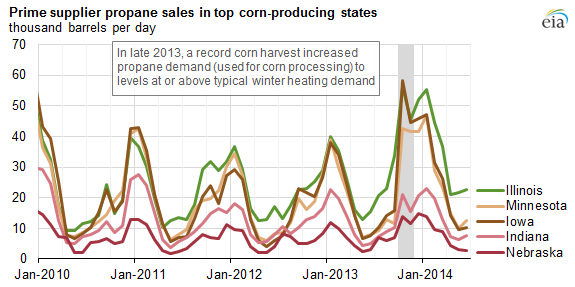
There was actually an issue with regards to propane being drawn down in late 2013 because of record demand to dry a record corn crop.
https://www.eia.gov/todayinenergy/detail.php?id=18231
Source: U.S. Energy Information Administration, Petroleum Marketing Monthly
The weather influences both the moisture content of the crop and when it reaches maturity. If weather is favorable, farmers may let their corn dry in the field, especially if there is not a price incentive to get it to market right away. Last year, propane demand in the top five corn-producing states increased in October to levels that rivaled the normal peak demand in January, drawing down propane inventories before the heating season began. Propane inventories in the Midwest were drawn down by 4.1 million barrels (130,000 bbl/d) in October, which was the largest October stock draw since 1985.
As a result, Midwest inventories of propane started the heating season at relatively low levels and remained at the bottom of the five-year range through December. Logistical problems, including the closure for maintenance of the Cochin Pipeline that transported propane from Canada to the Upper Midwest and disruptions of rail transportation, prevented Midwest inventories from being replenished before winter began. With prolonged cold weather in January and February, propane inventories dipped well below the five-year range.
metmike: Look how low inventories got on the graph below in early 2014 when the Polar Vortex was hitting and many people needed propane for residential heating.
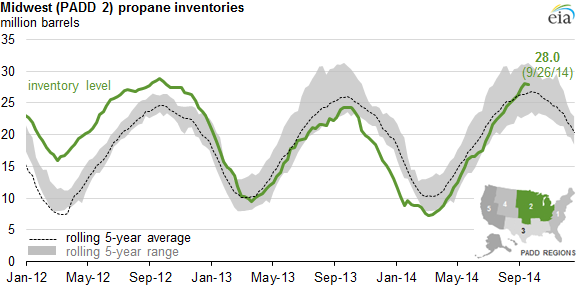
Source: U.S. Energy Information Administration
When the Polar Vortex hit in late January 2014, propane prices continued to soar and reached double the highest price that they were at prior to and since then.
https://www.eia.gov/dnav/pet/hist/LeafHandler.ashx?n=PET&s=W_EPLLPA_PRS_R20_DPG&f=W
This years corn crop is very late but not close to unprecedented(like 2009) and its not a huge crop, which offsets drying a bit.
U.S. #corn is 52% harvested.
75% is avg for the date Last year was 74%
3rd slowest in records since 1981
Top 2: 1992 46%, 2009 28%#harvest19
It's very interesting that current propane prices are close to the lowest they've been in the last 2 decades. This doesn't make sense with a shortage and such high demand.
I checked EIA propane stocks and this explains the very low prices.
Stocks have only been higher than this before very briefly, on 2 occasions. There clearly will be no shortage of propane this Winter even with the increased demand for the late/wet crop and the cold to the heating season.
Maybe some short term local shortages because of delivery or timing issues but there is a ton of propane and natural gas out there.
https://www.eia.gov/dnav/pet/hist/LeafHandler.ashx?n=PET&s=WPRSTUS1&f=W
Previous natural gas posts and discussion Sunday Night:
NG Huge Gap UP
Started by tjc - Nov. 3, 2019, 6:18 p.m.
Last weeks report. EIA +89 BCF A bit bearish
| Working gas in underground storage, Lower 48 states Summary textCSVJSN | |||||||||||||||||||||||||
|---|---|---|---|---|---|---|---|---|---|---|---|---|---|---|---|---|---|---|---|---|---|---|---|---|---|
| Historical Comparisons | |||||||||||||||||||||||||
| Stocks billion cubic feet (Bcf) | Year ago (10/25/18) | 5-year average (2014-18) | |||||||||||||||||||||||
| Region | 10/25/19 | 10/18/19 | net change | implied flow | Bcf | % change | Bcf | % change | |||||||||||||||||
| East | 913 | 898 | 15 | 15 | 826 | 10.5 | 895 | 2.0 | |||||||||||||||||
| Midwest | 1,095 | 1,069 | 26 | 26 | 953 | 14.9 | 1,057 | 3.6 | |||||||||||||||||
| Mountain | 211 | 208 | 3 | 3 | 180 | 17.2 | 211 | 0.0 | |||||||||||||||||
| Pacific | 298 | 297 | 1 | 1 | 262 | 13.7 | 324 | -8.0 | |||||||||||||||||
| South Central | 1,178 | 1,134 | 44 | 44 | 916 | 28.6 | 1,156 | 1.9 | |||||||||||||||||
| Salt | 293 | 268 | 25 | 25 | 232 | 26.3 | 317 | -7.6 | |||||||||||||||||
| Nonsalt | 885 | 866 | 19 | 19 | 685 | 29.2 | 840 | 5.4 | |||||||||||||||||
| Total | 3,695 | 3,606 | 89 | 89 | 3,136 | 17.8 | 3,643 | 1.4 | |||||||||||||||||
Totals may not equal sum of components because of independent rounding. | |||||||||||||||||||||||||
Working gas in storage was 3,695 Bcf as of Friday, October 25, 2019, according to EIA estimates. This represents a net increase of 89 Bcf from the previous week. Stocks were 559 Bcf higher than last year at this time and 52 Bcf above the five-year average of 3,643 Bcf. At 3,695 Bcf, total working gas is within the five-year historical range.
For information on sampling error in this report, see Estimated Measures of Sampling Variability table below.

Note: The shaded area indicates the range between the historical minimum and maximum values for the weekly series from 2014 through 2018. The dashed vertical lines indicate current and year-ago weekly periods.
Latest Release Oct 31, 2019 Actual89B Forecast86B
https://www.investing.com/economic-calendar/natural-gas-storage-386
| Release Date | Time | Actual | Forecast | Previous | |
|---|---|---|---|---|---|
| Nov 07, 2019 | 10:30 | 86B | 89B | ||
| Oct 31, 2019 | 09:30 | 89B | 86B | 87B | |
| Oct 24, 2019 | 09:30 | 87B | 88B | 104B | |
| Oct 17, 2019 | 09:30 | 104B | 106B | 98B | |
| Oct 10, 2019 | 09:30 | 98B | 97B | 112B | |
| Oct 03, 2019 | 09:30 | 112B | 105B | 102B |
Temperatures for last Thursday's EIA report:
7 day temperatures for this Thursdays EIA report:
Not a lot of people live in the Rockies or Plains where it was cold and ng demand was near record high for those locations(exception is TX).
Very mild along the East Coast with its high population centers using less ng for heating than is typical at the end of October.
Novermber 5, 20190 update:
The dominant imposing factor for prices this year has been massive, record large injections that have increased supplies faster than any time in history and crushed prices.
Prices plunged from 3.000 during the Spring down to below 2.200 in early August, when we hit a seasonal bottom. Cheap prices and record heat on weather models, then propelled us to an impressive short covering rally to just above 2.700 in mid September. The record heat continued into early Oct. but it was just too late in the cooling season to help anymore and prices collapsed, while injections were bearish vs expectations.
We had another weather induced spike higher in late October until now because of intense, early season cold and its associated high demand for residential heating.
This has taken us back to test the September highs on Nov. 5th, with a spike of over $4,000/contract in just a couple of weeks and 2 bullish break away gaps higher on Sunday Nights(not shown on the chart below).
Early season cold like this, often has more market moving potential with high stocks than late season cold.
Why is that?
In March/April, the market knows that Spring is right around the corner and the cold's staying power is limited. In Oct/Nov sustained cold that stick around and defines Winter has the potential to use up a lot of natural gas and draw down storage significantly. This Winter, it will take much colder than usual temperatures to achieve that because supplies are gushing in. That being the case, if/when there are signs of this cold pattern moderating, ng will be under selling pressure.
Signs of milder than normal temperatures in November, should they look reliable will cause ng prices to crash lower in a hurry.
Seasonals often turn down in this time frame thru November, particularly when temperatures are mild but this well entrenched very chilly -AO induced pattern has been tenacious and under predicted(as is often the case with a very negative AO) by models.
Model updates the last 2 weeks have featured added cold/HDD's more frequently than taking cold away.
The one feature that I'm noting late week 2 is for the high latitude upper level high which is part of this -AO will be migrating from this side of the North Pole, to the other side and this likely will cause the extreme Arctic dumps heading towards the mid latitudes from high latitudes(that have dominated for a couple of weeks) to take place on the other side of the Northern Hemisphere.
So the cold coming down here from Canada will not be AS cold. That extreme cold will be heading towards N.Asia and N.Europe.
Natural gas 3 months below
This seasonal price chart below is for 2 decades, ending back in 2009.
We should note from this chart that prices often bottom in late August................and we did have a bottom in that time frame with a stronger than usual rally in September, thanks to the heat using up so much natural gas for cooling.
That top was well defined in September and would have been THE top.......but some intense early cold has pushed us back to those highs.
Late October thru early December is very often a weak period for ng prices. When its warm during that period, its extraordinarily tough for prices to go up. On any dependable signs of moderation, the top will be in.  Seasonal Chart")
Natural Gas Intelligence after the close on Tuesday:
Natural Gas Futures Rally Further on More Cold, But Oversupply Creating Risks for ‘Swift Reversal’
5:07 PM
Further cold trends for an already chilly early-season forecast helped extend a natural gas futures rally Tuesday, although analysts pointed to risks for a reversal given structural oversupply in the market. The December Nymex contract added 4.1 cents to settle at $2.862/MMBtu. January settled at $2.940, up 4.2 cents
Natural Gas Intelligence early Wednesday:
Natural Gas Futures Reverse Early as Forecasts Show ‘Very Small’ Cold Change Overnight
8:58 AM
Coming off a large cold shift in the previous day’s forecast, guidance early Wednesday showed more modest cooler trends, but that wasn’t enough to extend the recent natural gas futures rally. The December Nymex contract was off 2.5 cents to $2.837/MMBtu shortly after 8:40 a.m.
Wednesday Weather:
NGI after the close Wednesday:
Natural Gas Futures Rally Stalls as Forecasts Tease End to Frigid Pattern
5:26 PM
Natural gas futures pulled back a few cents Wednesday as the bullish momentum generated by a recent stretch of strongly colder-trending forecasts showed signs of petering out. The December Nymex contract slid 3.4 cents to settle at $2.828/MMBtu after going as high as $2.891. January settled at $2.907, off 3.3 cents.
Outlook Taking on ‘Bearish Lean’ After Mid-November as Natural Gas Called Lower
8:57 AM
With overnight guidance backing off on expected cold after the second week of November, natural gas futures were trading lower early Thursday. The December Nymex contract was down 2.7 cents to $2.801/MMBtu at around 8:40 a.m
EIA’s Reported Injection Sharply Undercuts Consensus; Natural Gas Futures Rally
11:27 AM
+34 BCF
for week ending November 1, 2019 | Released: November 7, 2019 at 10:30 a.m. | Next Release: November 14, 2019
| Working gas in underground storage, Lower 48 states Summary text CSV JSN | |||||||||||||||||||||||||
|---|---|---|---|---|---|---|---|---|---|---|---|---|---|---|---|---|---|---|---|---|---|---|---|---|---|
| Historical Comparisons | |||||||||||||||||||||||||
| Stocks billion cubic feet (Bcf) | Year ago (11/01/18) | 5-year average (2014-18) | |||||||||||||||||||||||
| Region | 11/01/19 | 10/25/19 | net change | implied flow | Bcf | % change | Bcf | % change | |||||||||||||||||
| East | 932 | 913 | 19 | 19 | 830 | 12.3 | 903 | 3.2 | |||||||||||||||||
| Midwest | 1,109 | 1,095 | 14 | 14 | 977 | 13.5 | 1,076 | 3.1 | |||||||||||||||||
| Mountain | 207 | 211 | -4 | -4 | 182 | 13.7 | 213 | -2.8 | |||||||||||||||||
| Pacific | 292 | 298 | -6 | -6 | 265 | 10.2 | 327 | -10.7 | |||||||||||||||||
| South Central | 1,189 | 1,178 | 11 | 11 | 945 | 25.8 | 1,182 | 0.6 | |||||||||||||||||
| Salt | 303 | 293 | 10 | 10 | 250 | 21.2 | 330 | -8.2 | |||||||||||||||||
| Nonsalt | 886 | 885 | 1 | 1 | 695 | 27.5 | 852 | 4.0 | |||||||||||||||||
| Total | 3,729 | 3,695 | 34 | 34 | 3,199 | 16.6 | 3,700 | 0.8 | |||||||||||||||||
Totals may not equal sum of components because of independent rounding. | |||||||||||||||||||||||||
Working gas in storage was 3,729 Bcf as of Friday, November 1, 2019, according to EIA estimates. This represents a net increase of 34 Bcf from the previous week. Stocks were 530 Bcf higher than last year at this time and 29 Bcf above the five-year average of 3,700 Bcf. At 3,729 Bcf, total working gas is within the five-year historical range.
For information on sampling error in this report, see Estimated Measures of Sampling Variability table below.
Note: The shaded area indicates the range between the historical minimum and maximum values for the weekly series from 2014 through 2018. The dashed vertical lines indicate current and year-ago weekly periods.
Weather Thursday:
Boost From Bullish Storage Miss Short-Lived as Natural Gas Futures Slide on Milder Outlook
5:15 PM
The latest weekly storage data turned up a bullish surprise for natural gas futures traders, but a milder forecast...
metmike: Unless the pattern shifts colder in week 2(which can happen) the short term highs are in.
From NGI early Friday:
December Natural Gas Called Higher Amid Hints of Long-Range Cold
8:53 AM
Natural gas futures were trading a few cents higher early Friday as overnight guidance teased the possibility of another round of cold temperatures arriving before Thanksgiving. The December Nymex contract was up 2.6 cents to $2.798/MMBtu shortly after 8:30 a.m. ET.
Fridays weather:
November 8, 2019
With forecasts over the weekend expected to offer potentially pivotal insight into temperature trends later this month, natural gas futures prices failed to chart a definitive move in either direction Friday. The December Nymex contract traded both sides of even on the way to settling at $2.789/MMBtu, 1.7 cents higher on the day. January added 1.4 cents to $2.873.
metmike: We could easily gap 1,000/contract higher or lower on the open Sunday Night if weather models are more decisive with the week 2 weather and its goes in one direction............mild or colder again.
There are several factors at play.
One of them is the bullish surprise on the Thursday EIA storage report. Whether this will continue is unknown but it sets the market up to be more sensitive to changes in temperature forecasts and adds more upside potential with extreme cold forecasts.
I have been targeting the Sept high as an area of powerful resistance. Everytime that we got into that area this week, the market was overwhelmed with selling. It was able to get up there numerous times and sometimes stayed for awhile vs a typical top for ng, that features a big very short lived spike higher, followed by a collapse.
If we add enough cold to the forecast over the weekend, ng can take out that top from the get go and possibly get to $3 pretty quickly.
I have been looking at the last few days as a selling set up on milder weather forecasts. This has happened but the "milder" week 2 weather is more of a "less intense cold" and the cold will be aimed more at the high population areas of the East which use much more heating fuel than do the low population areas much farther west that have experienced the most intense cold recently(those areas will warm up).
The week 2 pattern, besides shifting the cold farther east here in the US will also change in the higher latitudes, where the coldest air looks to be aimed at N. Asia vs before, being aimed at Canada and points southward into the US. Canada in week 2, actually looks like much of the frigid air will be flushed out, so cold fronts from Canada will not be especially cold.......certainly no Arctic air with the pattern on weather models.
As long as the AO remains solidly negative, there will still be the potential for models to under forecast cold and for cold to come from higher latitudes than expected.
Ideally, for ng to really sell off the most, we need above normal temperatures in the East, which does not look likely with the upcoming pattern, featuring an upper level ridge in the west and trough in the East, the opposite of a warm pattern for the East.
I think that near average temperatures during the 2nd half of November, would pressure ng enough to fill the gap that was opened last Sunday Night. The top of the gap on the daily chart was the low from that trading session, 2.781 and the bottom of the daily gap is last Fridays high of 2.718. However, we have eroded that gap and traded into it on numerous occasions the last few days as temps moderated in the week 2 forecast.
There is actually a weekly gap higher also, with the high of last week of 2.736. The lows for this week were 2.753, so around a 17 tick gap between those prices.
Here's what can happen if the forecast turns milder the next 2 days.............a gap lower on Sunday Night very likely and this would leave a weekly island on the price charts. 5 daily trading sessions where the lowest price was higher than any price the previous week, and higher than any price the next week.
This would be a very bad/negative formation technically on the price charts.
Should that happen, the funds will pile on next week and prices could plunge fast at a time of year when seasonals are pretty negative. 2 weeks ago, I thought we could approach $2 if November ended up very mild.
It's been too cold and we're using up way too much ng so far and prices are too high for that, unless the warmth extended well into December.
However, with the mild scenario, it seems likely we can get down to $2.4 without much trouble as those were the lows from Sept/Oct.
Below the Aug lows of 2.339 are a target under the mildest scenario........above temps in the Midwest/East.
Here's an example of an island reversal lower, mentioned on the previous page. If natural gas does this on Sunday Night, it will start the week with a very strong negative technical signal that, if it still valid on Monday Morning, could inspire the large specs to go on a selling rampage(which they are know for):
https://stockcharts.com/articles/mailbag/2015/02/what-is-an-island-reversal-cmg-rtn.html
The alignment of the gaps holds the key. First, note that a bullish island reversal forms with a gap down and then a gap up. A bearish island reversal forms with a gap up and then a gap down. These gaps overlap to create an island of price action, hence the term "island reversal". The island is above the gaps on a bullish island reversal, and below the gaps on a bearish island reversal.
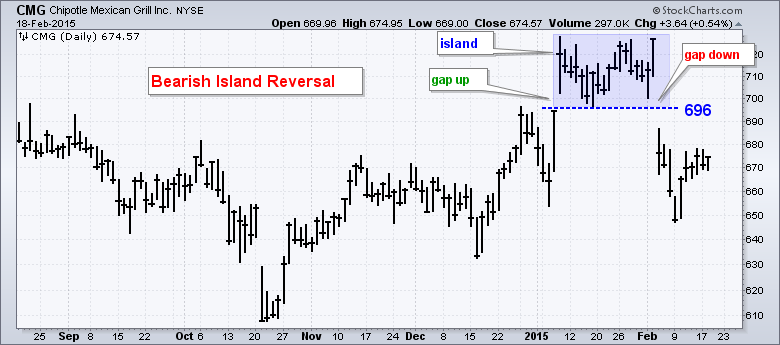
The first example shows Chipotle Mexican Grill (CMG) with bearish island
Sunday Weather:
Look for a gap lower on the open leaving the bearish island reversal described above on Friday.
We did gap lower with an open of 2.716, leaving the bearish island gap reversal from last week.
So the bottom of the gap at around 2.716 is resistance for now and the top of the gap is last weeks low of 2.753.
We would need to close that gap to wipe out/negate that formation.
Weather models turning sharply colder overnight are about the only thing that might close that gap..............which can certainly happen with the very negative AO.
However, the serious/Arctic cold is all going to the other side of the North Pole and Canada will have unusually warm temps, so cold fronts will not be extremely cold.
Natural gas back up to opening price/highs and at the bottom of the gap.
Very interesting.
This record cold wave the next few days has been dialed in/known for over a week. Wondering if it is keeping some aggressive selling away with us trading already at sharply lower levels vs Friday.
Expectations for next weeks EIA number should be for a pretty decent sized drawdown for early November.
These were temperatures last week for this weeks EIA, which should also be bullish vs average in early Novembe.
Dragged money off the table on the open. I was short from 2.790 on Friday. Looking to short again once the price gets back to the bottom of the gap. Might happen about 2am. Setting my alarm.
The forecast so far, predicts a milder temperature after this coming front passes through. Given the abundance of gas in storage, and the non effect of the recent "bullish" report on Thursday, I do believe that we will see prices drop short term.
NGI Monday Morning:
Warmer Weekend Shift, Ample Supply Send Natural Gas Futures Sharply Lower
8:58 AM
Natural gas futures were trading sharply lower early Monday as warmer-trending weekend forecasts and comfortable supply levels pressured prices. The December Nymex contract was down 13.6 cents to $2.653/MMBtu shortly after 8:40 a.m. ET.
Monday Weather:
NGI after the close on Monday:
Natural Gas Futures Plummet on ‘Step Change’ in Temperature Outlook, Record Production
5:06 PM
Natural gas futures opened the week at a steep discount as forecasts failed to predict the kind of sustained early-winter cold needed to offset ample supply. After gapping lower over the weekend, the December Nymex contract settled at $2.637/MMBtu, down 15.2 cents. January gave up 14.5 cents to settle at $2.728