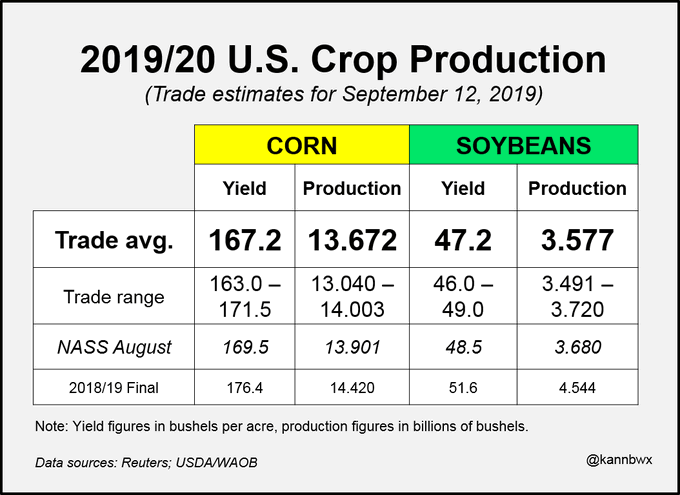
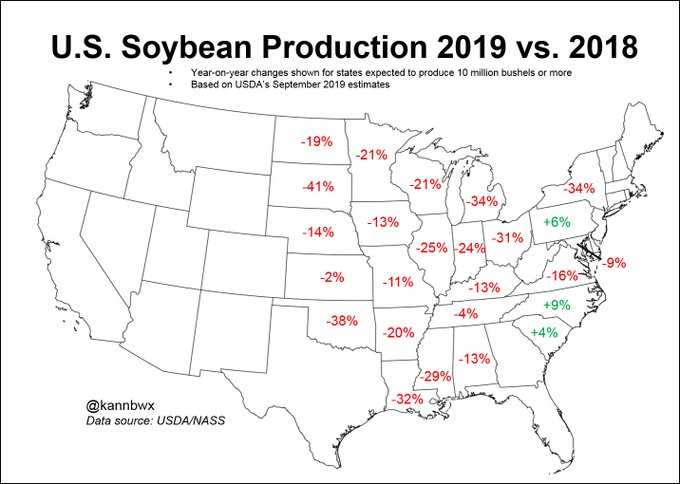
USDA will be putting out another S&D report this week this report will be more feild source data instead of farmer based surveys. I fully expect this to show lower yields, corn stands will be well below last couple years , ear weights will be higher than avg. But in future reports they will be lighter than this report and will eventually fall well below normal. Beans will be well under average on pod counts and yield will drop by another bu or two. How much of this will be matched with lack of demand, is going to tell us the price story . In the end Jan report yields will be 8 to 10 percent lower than last year in corn and beans will be 10 to 15 percent lower. Hopefully demand can stay at current predicted levels. Corn make a run at $4.25 level and Bean the $9.50 level
I was in the camp for the market to notice 20m PP acres. I was in the camp for the usda to not come out with 6m more corn acres than any of the last 6 years. I was in the camp with about as few corn acres dented for this date since God knows when. I was in the camp for beans being this late for this date would dictate some nervous energy, Let me say I have been wrong for nearly 2 months and tired.
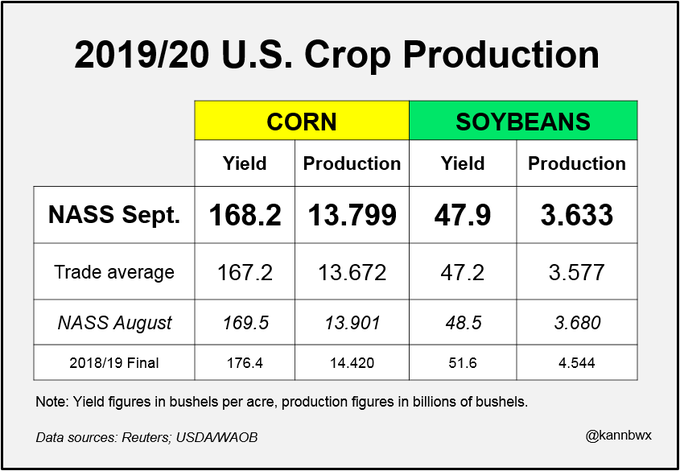
https://release.nass.usda.gov/reports/crop0919.txt
Corn Production Down 1 Percent from August Forecast Soybean Production Down 1 Percent Cotton Production Down 3 Percent
How did cotton come in vs expectations? Why is CT up so much today? It was already up sharply before the report, it sold off some right after the release, and now it is higher and near the high of the day. Thanks in advance.
Larry,
The crop report showed a cut of 3% vs the August report but that had to be expected considering the massive drop in crop conditions.
I was actually thinking that it was the deteriorating crop condition which was responsible. This had to be expected but the updated drought monitor that is updated early Thursday increased the drought in the south, especially in TX, which as you know grows over 1/3rd of the crop.
I will start a cotton thread on this.