I post a Daily Gold Chart with a bull flag formation,waith to see which way it breaks out.
Here is a 90 minute chart which shows what be goin on in the Bull Flag. Looks like we are firming up for a possible breakout to the upside.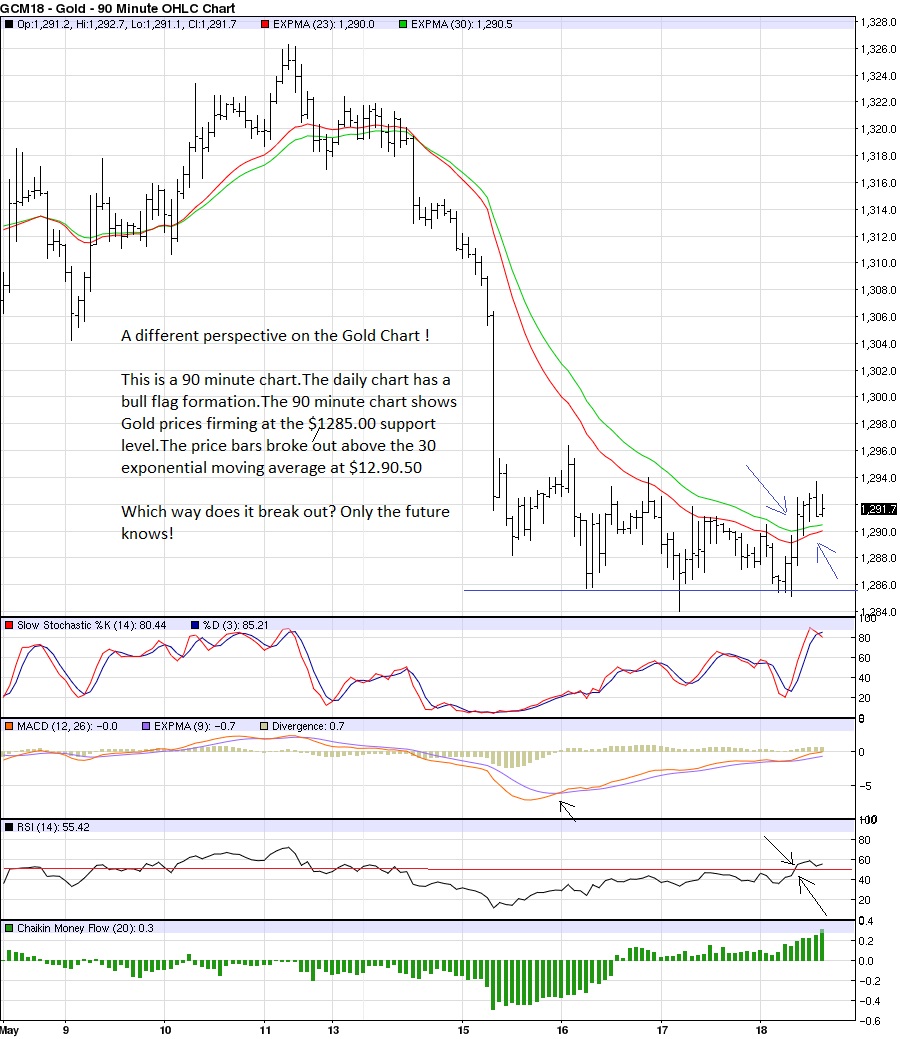
Thanks Mike:
From Futures Magazine:
http://www.futuresmag.com/2018/05/18/gold-turns-positive-italian-bond-sell-gathers-pace
"If the dollar does pause here and given the above-mentioned geopolitical risks, gold may be able to regain its poise again. However, if it has any chance of a comeback, it will now need to reclaim that broken $1,300 level and go on to push above the 200-day moving average (~$1,307 per oz.) again before the bulls can be tempted to get back in again. The bears who missed the sell-off might very well step back in upon a potential re-test of the broken support around that $1300 level, given the ongoing bearish trend. Thus, we will treat any gains on gold with a pinch of salt until and unless there is a clear sign of a reversal."
Looking at the XAU vs Spot Gold, I find bullish divergences going on this week. First we had on Tue $1,288.9 and 81.77 Vs Thursday we had $1,288.2 and 81.84, point is spot gold was lower but xau was higher, we moved higher on Friday.
On Wednesday we had $1290.2 and 81.93 Vs Friday 1290.2 and 82.06. Not only should we move higher on Monday but continual divergences like this on a daily basis indicate a bottoming formation.
Looking at the weekly closing numbers we had (may 4th) $1312.7 and 78.81, (May 18th) we had $1290.2 and 82.06
again gold closed lower while XAU closed higher.
Looking at COT for Gold the smallest difference between commercial longs and short in about 1 full year. meaning the commercial longs are getting long down here and as a group, I have never seen the commercial longs in Gold outnumber the commercial shorts. The best you can hope for is just a small net short.
in Silver the 8 largest longs have the largest position in futures and options combined for this latest week for all of 2018. Which is not much data but over all the commercials in silver have a rather large position compared to the commercial longs. Not the largest but overall for the past few months while we have treaded water just above $16, they have been long.
The US Dollar index also has had quite a run and as expected the rsi and other measures say we are overbought, but admittedly with this index, they can get more overbought, but a top is close, unless we are planning a total economic crisis like in 2008, which could force capital to the US. Not seeing that now.
Gold has bottomed or will bottom soon. I do not think 1276 will be taken out. I am long from the close on Friday. I may get out and buy a mini and then buy another mini if we see 1279 ish area. not sure, but we are close
I looked up mini gold and it is only 1/10 of a normal gold. I did not like that. I wish it was 1/2. That would have been better but that is life.
So I put a GTC Order in to buy an August Gold at $1,286.0. I did not place a stop but if I am filled, I will use atleast a $10 stop as we are very close to a major move up.
The low last night was $1286.80 for August. haha on me, were moving higher now. missed it by $0.80. Isn't trading fun.
Richard,
Thank you for these posts with wonderful, expert analysis. In June, when I invite everybody back from the past 20 years(with emails that are still good) am hoping that you guys have some outstanding company to chat with.
I'm looking for a low on a price bar at 1291
I am not disagreeing with you but what do you mean by 1291?
What month are you looking at? Both June and august had a print lower then that today.
Do you mean 1281?
got a fill on August Gold at 1294.0. I am sticking with it. Today made some nice chart action. XAU positive on the day now and the US$$ is Flat after being up. Could be a nice reversal day. Normally Tuesdays are turning days but I am not second guessing it now.