For the first time in over 2 months the extended guidance has above normal temperatures spreading across the country.
http://www.cpc.ncep.noaa.gov/products/predictions/610day/
http://www.cpc.ncep.noaa.gov/products/predictions/814day/index.php
This will also be accompanied by mostly dry weather. Since corn planting is so far behind, one would think that this is bearish weather. However, planting delay rallies almost never last long(probably we saw the cold/snow, rally the market earlier this month).
Wheat was leading the parade much higher again. Could hot/dry in May/June hurt grain fill for maturing wheat? Yes but the Chicago wheat was the leader again today. Looks like huge short covering from funds that have massive shorts.
Its the HRW crop that is severely damaged from the drought and freezes but the SRW speculators have the biggest shorts(especially spreads with HRW as the long).
It been very dry in Russia..........so wheat crop estimates have been dropping. Australia has also been dry(they are big wheat producers).
Even so, if the US wheat price gets too much higher, we will price ourselves out of the global market.
Here in the US, in the short term, our weather is featuring a few days of heavy rains, then still a chance of a few showers early next week.
Here is the rain forecast link for the NWS for the next week:
http://www.wpc.ncep.noaa.gov/qpf/qpf2.shtml
A few areas could have some flooding but this weather system is progressive and will be moving along, so major problems are not expected to last long:
http://www.wpc.ncep.noaa.gov/qpf/excess_rain.shtml
Severe storms with few tornadoes are also possible:
... YOU ARE THE BEST MIKE !!!
...GETTIN' ALL GIGGLY LIKE A SCHOOL GIRL WATCHIN' THE MASSIVE "SRW" SHORTS
BEING SQUEEZED BY THE NADS...
... 6.00 PRICE IS WRITTEN ALL OVER N-JULY CONTRACT CHART...
... 16.16 (*WHEN THE LEVEE BREAKS*)
... RAIN EVENTS ACROSS NORTH CENTRAL/EASTERN IOWA ARE MOVING FAST @ 45 MPH TONIGHT...
Thanks silverspiker,
SRW losing momentum here............double top?
Or are we just pausing for a bit and really breaking out big time to $6.
Latest GFS is not much different, though it has weak cold fronts in the Midwest/East very late week 1 & mid week 2 keeping the heat from lasting long there......initially.
Heat looks to be expanding and growing later in week 2 though. It might be the new pattern that defines the 2nd half of May.
testingggggggggggggggggggggggggggggggggggggggggggggggggggggggggggggggg

| Week | None | D0-D4 | D1-D4 | D2-D4 | D3-D4 | D4 |
|---|---|---|---|---|---|---|
| Current 5/01/2018 | 58.08% | 41.92% | 14.18% | 0.00% | 0.00% | 0.00% |
| Last Week 4/24/2018 | 80.09% | 19.91% | 7.45% | 0.00% | 0.00% | 0.00% |
| Three Months Ago 1/30/2018 | 46.22% | 53.78% | 15.23% | 0.00% | 0.00% | 0.00% |
| Start of Calendar Year 1/02/2018 | 28.96% | 71.04% | 8.13% | 0.00% | 0.00% | 0.00% |
| One Year Ago 5/02/2017 | 100.00% | 0.00% | 0.00% | 0.00% | 0.00% | 0.00% |

http://droughtmonitor.unl.edu/
Download the following time series chart as an Image, Download the following time series data as JSON, Download the following time series data as XML
Showing Data will replace the time series below with a data table.
Download the following pie chart as an Image
Showing Data will replace the pie chart below with a data table.
With what seems to be heavy rain chances in the upper midwest, the plantings may be delayed a bit longer. When would be the point of no return?
Mark,
It's generally accepted that planting corn after May 10th usually causes a loss of 1 bushel/day in yield. Each season is different. Great weather during the growing season can offset late planted corn/beans and still result in big yields.
Late planted crops are rarely record production years but also, if wet soils cause late planting it also greatly decreases drought chances.
Major widespread droughts, like in 1988 and 2012, always start with record fast planting.
"Plant in the dust and the bins will bust" is a saying that only applies when good rains come after planting.
"Plant in the mud and the crop will be crud" or "Plant in the mud and the crop will be a dud" are 2 that I made up. Crops planted in excessively wet soils have root systems that don't have to go far to get moisture, so they don't expand/are not extensive.
This is bad for several reasons. If it turns hot and dry and surface moisture dries up fast, the roots are not very deep to tap into subsurface moisture.
The other is the fact that extensive roots that developed early from dryish soils(not bone dry) that can reach into subsoil moisture, will also be tapping into more minerals/nutrients and fertilizer.
Also, planting in wet soils.........mudding the crop in will compact the soil and making it tougher for roots to push thru it.
Corn is sometimes planted as late as early June.
I can see where all that comes into account. But I also like Susan's view on it. Crops mostly grow. We shall see.
Good point that can't be underestimated. The actual growing season weather will determine yields.
In most years the weather is either average or better.
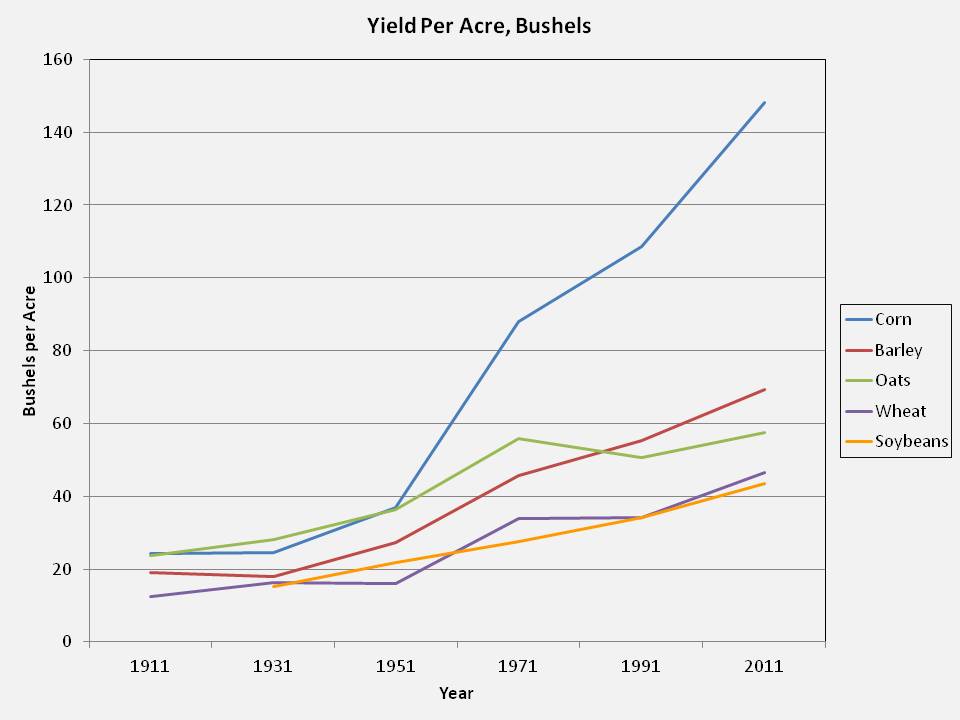
Additional CO2, atmospheric fertilizer is contributing to a 26% crop increase in crop yields since it went up from 280 ppm to the current 405 ppm.
Technological advances and man made fertilizers are the main reason for corn yields to have quadrupled in the last 60 years
https://ahundredyearsago.files.wordpress.com/2011/10/crop-yield.jpg
But climate change and CO2 have contributed a great deal also.
http://www.fao.org/worldfoodsituation/csdb/en/
https://www.nasa.gov/feature/goddard/2016/carbon-dioxide-fertilization-greening-earth
Friday's models are still not sure where the heat ridge will set up............but there WILL be a big heat ridge building in week 2 with high confidence. Here's the latest extended guidance from the NWS that really shows it.
http://www.cpc.ncep.noaa.gov/products/predictions/610day/
http://www.cpc.ncep.noaa.gov/products/predictions/814day/index.php
The experimental weeks 3 and 4 guidance is showing a very strong heat signal!
Mostly dry too.
The hot dry weather will be welcome to places, like IA that got hammered with heavy rains this week and more to come in the next week.
Rains for the next 7 days(too wet for areas not planted yet):
http://www.wpc.ncep.noaa.gov/qpf/p168i.gif?1525472610
It will allow them to get their corn planted before the end of the month......if the heat ridge sets up over the Midwest for a week.
If the heat ridge sets up to the east, and pumps very warm humid air into the Midwest with the jet stream aimed in that direction.....it could result in heavy rains in the N.Plains to Upper Midwest.
This is still mid/late week 2 development with plenty of uncertainty here on May 4th.
Testing to see what text looks like after copying graph from NWS Severe Storm Center link. In the past, the graph effects how the text is displayed.