Grains/beans
8 responses | 0 likes
Started by metmike - March 20, 2019, 1:52 p.m.

Weather is getting interesting.


Too wet in the US for early planting, with it turning very wet again in the week 2 part of the forecast.

Select a Parameter:    

6-10 day precip below


6 to 10 Day Outlook - Precipitation Probability

Precipitation Probability  8-14 days below

8 to 14 Day Outlook - Precipitation Probability


Turning colder again also!!!


ArchivesAnalogsLines-Only FormatGIS Data

Temperature Probability

8 to 14 Day Outlook - Temperature Probability
Comments
By metmike - March 20, 2019, 2:18 p.m.
Like Reply


There is a  drought in Australia, which is a big global supplier of wheat. This is where they produce wheat.........in the southwest and southeast/east, where there is the most rain.
Fortunately, so far the dries areas have been north of wheat country in Australia:


It's getting close to being the time for them to plant their wheat in the Southern Hemisphere and they will need more rains for proper germination and early establishment. Ideal planting time begins in April and ends in early June.............so there is time to alleviate the drought conditions.

https://www.usda.gov/oce/weather/pubs/Other/MWCACP/Graphs/aus/AusWheat.pdf


https://www.agrifutures.com.au/farm-diversity/wheat/


Production status

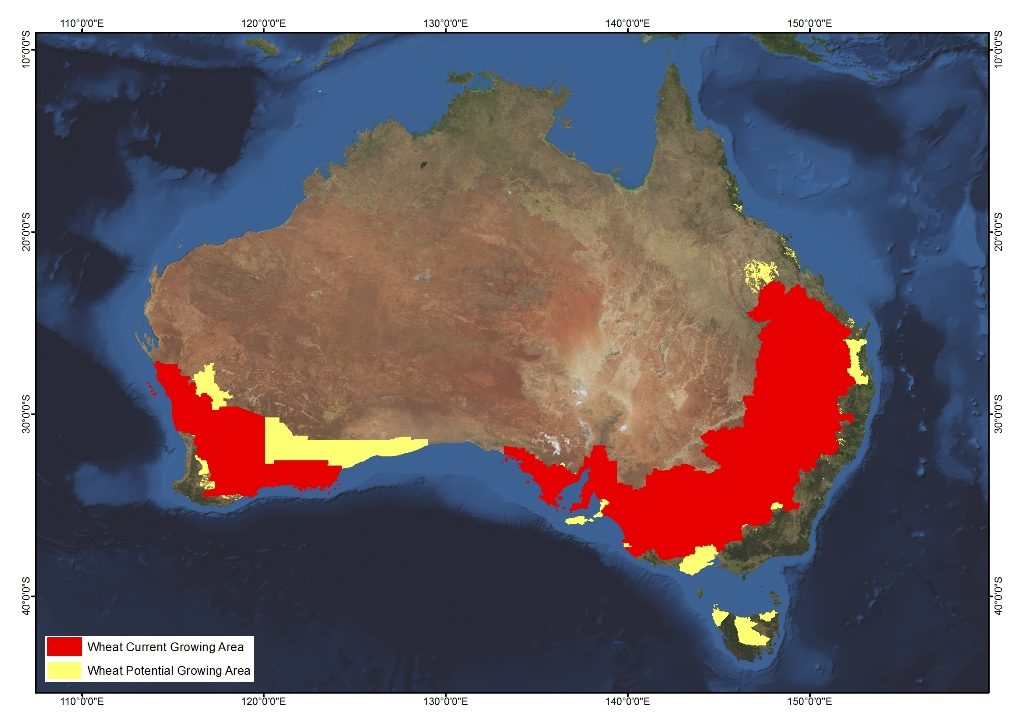
The main producing areas are in Western Australia, New South Wales, South Australia, Victoria and Queensland.

The Australian Bureau of Agricultural and Resource Economics and Sciences reports production area for the states as follows:

  • Western Australia – 5 million hectares
  • New South Wales – 3.1 million hectares
  • South Australia – 1.9 million hectares
  • Victoria – 1.5 million hectares
  • Queensland – 610 thousand hectares
  • Tasmania – 7 thousand hectares
  - image


Image result for australia wheat  maps


Here is the rain for the past 3 months across the entire globe. Note the widespread light brown in Australia. 

https://www.cpc.ncep.noaa.gov/products/Precip_Monitoring/Figures/global/n.90day.figb.gif


Here are the latest 2 week rain forecasts. Some rain in the north but drying out more in the south/wheat country. HOT almost everywhere!!!

gfs_spac_372_precip_ptot.gif


http://wxmaps.org/outlooks.php


Select a Parameter:    

Select a Parameter:    

By mcfarm - March 20, 2019, 6:49 p.m.
Like Reply

interesting? I'd say that's right. Ice flows  and flooding all over Nebraska, snow melt will be huge in Minn., sloppy mess most other places.

By metmike - March 21, 2019, 12:59 p.m.
Like Reply

Exports sales..........not so good but I think wet weather is supporting a lot of short covering/buying  in corn today!


https://apps.fas.usda.gov/export-sales/highlite.htm

By becker - March 21, 2019, 9:22 p.m.
Like Reply

The 370 or 380 strike dec corn puts look like value at 10c, 15c respectively.  If a China deal is made then z will climb to +4.00. If any too wet or too dry weather arrives before Aug 1 then also z goes +4.00.  What are the odds of no china deal and/or no weather scare in the next 120 days?  

By becker - March 21, 2019, 9:35 p.m.
Like Reply

I meant to be short the 370, 380 puts

By mcfarm - March 22, 2019, 7:20 a.m.
Like Reply

if we can get a 917 close I would not be short beans for a while

By kansas - March 22, 2019, 11:14 a.m.
Like Reply

I am not normally an alarmist, but this wet weather is a big deal. There are ruts cut in a lot of the bean fields that are standing full of water. There has been no fertilizer applied, and with everyone running at once when it dries out, sourcing it will be a problem. We start planting corn here next week most years, but we are wet with a lot more rain on the way. It's too early to get really excited about yet, but it is something to keep an eye on.

By metmike - March 22, 2019, 6:34 p.m.
Like Reply

Great to hear from you kansas!!!


The NWS sure has ramped up their alert for this Spring.  It's just March and things will change but the last few model runs are drier for the northern  1/2 of the Midwest in early April.

If this were to define the April pattern, then those areas would dry out.

Still looks wet for the southern 1/2 of the Cornbelt and very wet in the South.

This map depicts the locations where there is a greater than 50 percent chance of major, moderate or minor flooding during March through May, 2019.

This map depicts the locations where there is a greater than 50-percent chance of major, moderate or minor flooding during March through May, 2019. (NOAA)

Download Image