For the weather that affects residential heating demand and natural gas prices, go here:
This picture tells us why natural gas prices have been so volatile early in the heating season.
Gas in storage has been around 15 year lows:

Here is the bearish EIA report from last Thursday:
-77 bcf
The deficit with last year is up to 722 bcf and with the 5 year average is 723 bcf.
| Working gas in underground storage, Lower 48 states Summary textCSVJSN | |||||||||||||||||||||||||
|---|---|---|---|---|---|---|---|---|---|---|---|---|---|---|---|---|---|---|---|---|---|---|---|---|---|
| Historical Comparisons | |||||||||||||||||||||||||
| Stocks billion cubic feet (Bcf) | Year ago (12/07/17) | 5-year average (2013-17) | |||||||||||||||||||||||
| Region | 12/07/18 | 11/30/18 | net change | implied flow | Bcf | % change | Bcf | % change | |||||||||||||||||
| East | 732 | 752 | -20 | -20 | 857 | -14.6 | 856 | -14.5 | |||||||||||||||||
| Midwest | 885 | 914 | -29 | -29 | 1,037 | -14.7 | 1,018 | -13.1 | |||||||||||||||||
| Mountain | 160 | 168 | -8 | -8 | 214 | -25.2 | 207 | -22.7 | |||||||||||||||||
| Pacific | 238 | 253 | -15 | -15 | 306 | -22.2 | 332 | -28.3 | |||||||||||||||||
| South Central | 898 | 905 | -7 | -7 | 1,222 | -26.5 | 1,224 | -26.6 | |||||||||||||||||
| Salt | 271 | 263 | 8 | 8 | 360 | -24.7 | 352 | -23.0 | |||||||||||||||||
| Nonsalt | 627 | 642 | -15 | -15 | 862 | -27.3 | 872 | -28.1 | |||||||||||||||||
| Total | 2,914 | 2,991 | -77 | -77 | 3,636 | -19.9 | 3,637 | -19.9 | |||||||||||||||||
Here is the 7 day period, ending this last Friday for the next EIA storage report coming out this Thursday at 9:30pm.
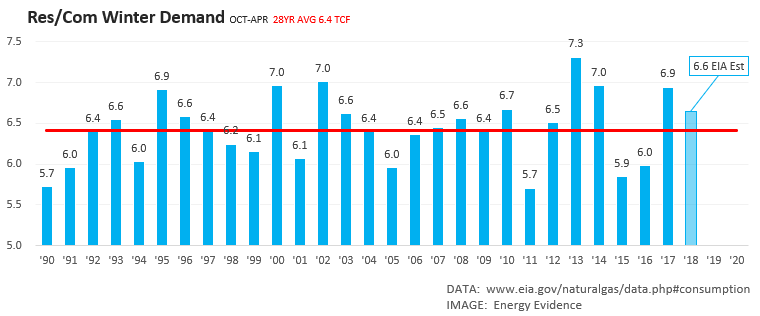
Here is the bar graph of previous Winter demand, with the EIA projection from a month ago. Not sure if its been updated.
Right now EIA projects winter heating demand at about 6.6 TCF, and end of season inventories at 1.37 TCF on March 31st. Heating demand over the last 28 winters ranged from 5.7 TCF to 7.3 TCF, averaging 6.4. Here's the history from EIA:
Previous natural gas discussions from Sun/Mon
Wed am from Natural Gas Intelligence:
January Natural Gas Down 20 Cents Before Open, Despite Chilly Near-term Forecasts
8:47 AM
After three days of dramatic swings, natural gas winter prices appeared ready for another round of volatility Wednesday as January teetered around a nickel lower early before plummeting about 20 cents just ahead of the session’s open. Read More
Closing comments from Natural Gas Intelligence:
Winter Natural Gas Prices Yo-Yo, Settling 11 Cents Lower as Spot Gas Retreats Again
5:41 PM
After crumbling as much as 27.5 cents earlier in the day, January natural gas prices on Wednesday hit a wall and bounced back to recover a good portion of the losses. The Nymex January gas futures contract went on to settle at $3.726, down 11.2 cents on the day. February fell 8.9 cents to $3.653 and March dropped 5.2 cents to $3.506.
metmike: What actually happened was that all the 12z guidance came out colder, so we bounced from just above 3.6 to over 3.7.