Now, in retrospect, I feel I can finally say that NG has very likely since sometime on Monday been strongly influenced by the warmth for the bulk of the 2 week forecast. There are still most models showing the return of cold late week 2, but most are still not reaching the E US by then and I’m guessing the market is finally realizing that it needs to account for the warmth likely dominating the next 12 or so days before any colder enduring pattern change may or may not happen after 12/23 or so, which is much less certain than the expected warmth of 12/23 and earlier no matter how cold some day 14 maps look.
Now I’m not saying I correctly predicted this drop by any means because I most certainly didn’t and usually don’t make predictions of price, anyway. So, I’m not trying to get credit for any prediction since I made none. But I was a bit surprised NG rose so much on Sun evening, despite a significantly warmer Sun vs Fri 2 week forecast and much warmer 12/16-20 on the GEFS, on a more speculative colder pattern change showing up late week 2 and was saying it was probably largely being influenced bullishly by low storage (leading to bullish algorithms helping it rise) no matter how much warmth then lay ahead in the bulk of the 2 week forecast. This is merely an after the fact commentary, which is what most news stories do. And I’m not predicting what NG will do from here. Retrospective realizations like this are not going to make me or anyone any money. Then again, I don’t feel like posts here need to do that to be worthy of posting.
Thanks Larry,
Good call on Sunday Night!
The threat for extreme cold at the end of week 2 has been dropping, except for the Canadian model.
The 6z run of the GFS operational model and ensembles came in the mildest yet late in week 2. In fact, we went from a threat of extreme cold starting around then(from earlier in the week) to a continuation of very mild weather now.
The European model does not look as cold either .....stays mild but not as mild as that last run of the GFS.
If the 12z GFS comes in cold again, we will likely bounce from here or if it continues the milder trend, natural gas is toast.
Like tallpine mentioned 4.231 is the key level for today.
Thanks, Mike. I can't take credit though since I really didn't make a call.
The EIA was -77, a clearly bearish # vs both the average WSJ survey guess of -85 and vs past years with similar HDD levels in nonholiday weeks.
From Natural Gas Intelligence:
EIA Reports Slightly Bearish 77 Bcf Draw as Salts Inject 8 Bcf; January NatGas Trims Gains
11:19 AM
The Energy Information Administration (EIA) reported a 77 Bcf withdrawal from natural gas storage inventories
For the weather that affects residential heating needs and natural gas prices, go here:
Here is the bearish EIA report:
The deficit with last year is up to 722 bcf and with the 5 year average is 723 bcf.
| Working gas in underground storage, Lower 48 states Summary text CSV JSN | |||||||||||||||||||||||||
|---|---|---|---|---|---|---|---|---|---|---|---|---|---|---|---|---|---|---|---|---|---|---|---|---|---|
| Historical Comparisons | |||||||||||||||||||||||||
| Stocks billion cubic feet (Bcf) | Year ago (12/07/17) | 5-year average (2013-17) | |||||||||||||||||||||||
| Region | 12/07/18 | 11/30/18 | net change | implied flow | Bcf | % change | Bcf | % change | |||||||||||||||||
| East | 732 | 752 | -20 | -20 | 857 | -14.6 | 856 | -14.5 | |||||||||||||||||
| Midwest | 885 | 914 | -29 | -29 | 1,037 | -14.7 | 1,018 | -13.1 | |||||||||||||||||
| Mountain | 160 | 168 | -8 | -8 | 214 | -25.2 | 207 | -22.7 | |||||||||||||||||
| Pacific | 238 | 253 | -15 | -15 | 306 | -22.2 | 332 | -28.3 | |||||||||||||||||
| South Central | 898 | 905 | -7 | -7 | 1,222 | -26.5 | 1,224 | -26.6 | |||||||||||||||||
| Salt | 271 | 263 | 8 | 8 | 360 | -24.7 | 352 | -23.0 | |||||||||||||||||
| Nonsalt | 627 | 642 | -15 | -15 | 862 | -27.3 | 872 | -28.1 | |||||||||||||||||
| Total | 2,914 | 2,991 | -77 | -77 | 3,636 | -19.9 | 3,637 | -19.9 | |||||||||||||||||
Storage is still extremely low vs historical averages:
For information on sampling error in this report, see Estimated Measures of Sampling Variability table below.

These were the 7 day temperatures for that report.......ending last Friday:
Is the top in? Going to take some extreme cold returning in forecasts to get back up to the highs of 4.964 on November 14th......................or maybe just colder than average if the market continues to fret over low storage in December and the forecasts morph colder.
Is this a bull flag and not the top? This weeks action and 2 consecutive closes below 4.230 suggest a top. Bring on the cold and its a bull flag. Mild weather and its the top with prices collapsing thru the 3's.
| Naturalgas3months |
Repeating the frigid Winter of 5 years ago, gets storage to precariously low levels and the price spikes to the highest in over a decade. Based on the EIA projections and stats below, if we used up the same amount of gas this Winter, as we did 5 years ago, supplies would end up below 800 bcf(maybe not lower than that because extremely high prices would discourage some demand)!
Repeating the mild Winters of 2 and 3 years ago and storage catches up with last year and prices get buried by late Winter(with the huge amount of demand early in the heating season, that means the catching up might take longer now-well into next year even with a mild Winter).
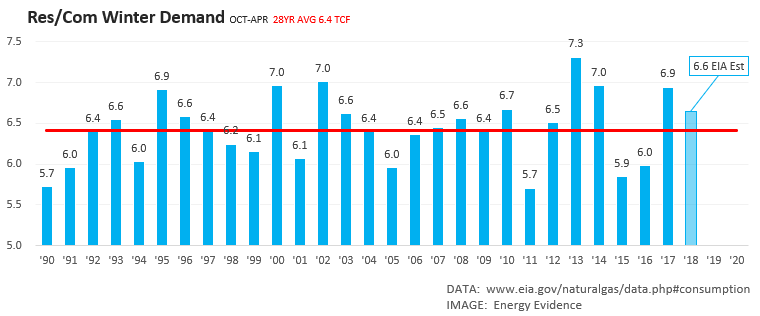
Right now EIA projects winter heating demand at about 6.6 TCF, and end of season inventories at 1.37 TCF on March 31st. Heating demand over the last 28 winters ranged from 5.7 TCF to 7.3 TCF, averaging 6.4. Here's the history from EIA:
After the Thursday session closed and the Friday session opened, the European model 30 day outlook came out..........MUCH milder in the Midwest/East most of the time thru the first 12 days of January.
Larry,
I'm not claiming this product has much skill. I'm just telling you what it showed and how the market just reacted.........which was to open $600/contract lower than the last price traded 45 minutes previously.
Mike,
Though I think the market is ignorant to do so being that the credibility is very low. I agree with you. I've never seen it do anything like this before to this extent, which tells me the market is usually smarter than this. I will point out that the much more credible 12Z Euro ens 11-15 was also warmer as you must know. So, perhaps the combo of those two did it.
As Mike mentioned, last evening's Euro weeklies were warm dominated through week 4 and warmer than the prior run, which itself wasn't cold overall. In addition, today's 0Z GEFS and EPS were both warmer vs yesterday in the overall 2 week period, with the GEFS especially warmer in the 6-10 and the EPS especially warmer in the 11-15. The wx service I follow had an 8 HDD drop in this morning's forecast. All of this, along with the 12Z model consensus being slightly warmer vs 0Z (12Z GFS was the big exception, which caused a temporary spike) lead to a very big drop in NG today.
What a huge price drop since Sunday evening, when it was strongly higher! At that time, I was not understanding why NG was so strong in the face of warmer 2 week forecasts on Sun vs Fri and the most recent EIA storage reports having been bearish/production up though I didn't actually make a call for future price direction. On Sunday, the day 14 model consensus (for 12/23) was colder than the day 14 of Fri models (12/21) (although the 12/21 maps on Sunday were not colder than the 12/21 maps from the Fri models). So, that colder day 14 consensus was indicative of a possible colder pattern change. However, I had noted that the more easily forecasteable 12/16-20 on the GEFS was like 20 HDD warmer. So, the overall 2 week forecast was significantly warmer vs Fri even with the more speculative colder day 14 maps, which turned out to be overblown per later model runs.
I agree completely Larry.
Seems like every model update since late yesterday, especially in the extended came out warmer and warmer.
The polar vortex, northern stream threat for extreme cold peaked very early in the week and appears to be a distant memory.
I think this threat was dialed in early on Sunday Night, with an over reaction. A legit threat will get closer and become more amplified, which causes the market to respond with continued higher prices but this threat will go into the trading books as a short lived "scare"/
The threat never completely went away and even looked slightly more elevated again on Thursday but became less and less of a concern and the market focused on the very mild temps that you indicated that it should have been doing on Sunday Night.