For the weather that affects residential heating demand and natural gas prices, go here:
https://www.marketforum.com/forum/topic/15976/
The front month, November, expires on Monday, 1 trading day from today. Natural gas has been known to have some big spikes ahead of this......more than the usual spikes.
From Natural Gas Intelligence on the open this morning:
Loose Storage Print, Potentially Mild Mid-November Pressure Natural Gas Futures Overnight
8:58 AM
November natural gas futures were trading 4.7 cents lower at $3.155/MMBtu shortly before 9 a.m. ET Friday, with the market processing the implications of loose government storage data as forecasters pointed to milder long-range temperature risks.
Storage is Very Low for this time of year!!
Storage is below the bottom of the previous 5 year range and still around 600 bcf below last year at this time!
This is why the temperature forecast matters....in the Summer/cooling season and now in the early part of the key Winter/heating season............which is looking milder(for November) on Friday.

EIA injection on Thursday was +58 bcf but with 5 bcf reclassified, it was actually 63 bcf. This seems pretty bearish to me.
| Working gas in underground storage, Lower 48 states Summary textCSVJSN | |||||||||||||||||||||||||
|---|---|---|---|---|---|---|---|---|---|---|---|---|---|---|---|---|---|---|---|---|---|---|---|---|---|
| Historical Comparisons | |||||||||||||||||||||||||
| Stocks billion cubic feet (Bcf) | Year ago (10/19/17) | 5-year average (2013-17) | |||||||||||||||||||||||
| Region | 10/19/18 | 10/12/18 | net change | implied flow | Bcf | % change | Bcf | % change | |||||||||||||||||
| East | 825 | 812 | 13 | 13 | 913 | -9.6 | 903 | -8.6 | |||||||||||||||||
| Midwest | 934 | 908 | 26 | 26 | 1,078 | -13.4 | 1,058 | -11.7 | |||||||||||||||||
| Mountain | 177 | 177 | 0 | 0 | 224 | -21.0 | 215 | -17.7 | |||||||||||||||||
| Pacific | 262 | 264 | -2 | -2 | 315 | -16.8 | 346 | -24.3 | |||||||||||||||||
| South Central | 896 | C | 877 | 19 | 24 | C | 1,171 | -23.5 | 1,196 | -25.1 | |||||||||||||||
| Salt | 218 | 203 | 15 | 15 | 311 | -29.9 | 324 | -32.7 | |||||||||||||||||
| Nonsalt | 678 | C | 673 | 5 | 10 | C | 859 | -21.1 | 872 | -22.2 | |||||||||||||||
| Total | 3,095 | C | 3,037 | 58 | 63 | C | 3,701 | -16.4 | 3,719 | -16.8 | |||||||||||||||
C=Reclassification | |||||||||||||||||||||||||
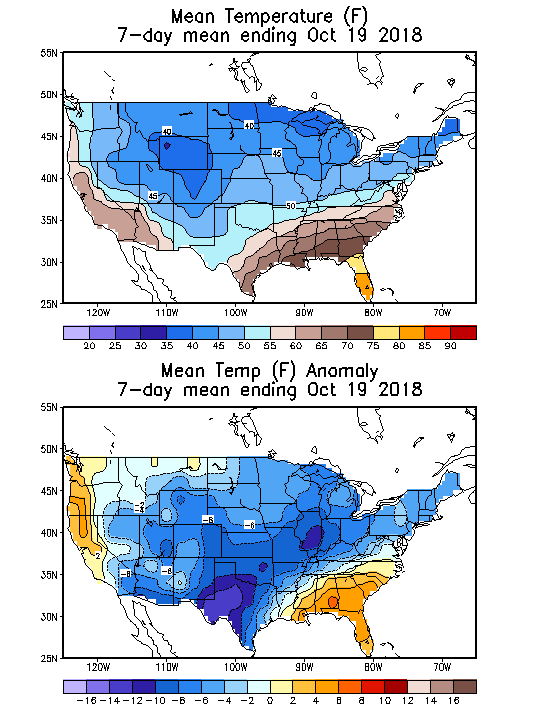
Here's the temperature map for this last EIA reporting period.
Huge cold anomalies and residential heating demand.............which should have reduced the injection by more.........except that massive supply is hitting the market finally.
http://www.cpc.ncep.noaa.gov/products/tanal/temp_analyses.php
Natural Gas price charts
We finally broke out above $3! The weather will need to be cold in November to stay above $3.
A lot of volatility with the low storage. Prices have been gyrating up and down with the latest weather forecast.
Monday forecast was milder than the previous one the market had at the end of last week, Tuesday forecast was colder. Wednesday forecast not much change. Early Thursdays forecast was colder in weeks 3-4.
Fridays forecast for November is decidedly warmer.
Seasonals turn strongly negative here.......if the extended forecasts turn mild, look out below.........but low storage +very cold = higher price potential.
| Natural gas 3 months |
Naturalgas 1 year below
Naturalgas 5 years below
| Naturalgas10years below
|
Previous discussion:
By WxFollower - Oct. 25, 2018, 12:48 p.m.
Mike said: “The market had a knee jerk, spike lower immediately after the release but it couldn't stay down. I think the colder week 3-4 part of the forecast are bullish today.”
—————————————————
Mike,
I respectfully disagree. Here’s why: the latest CFSv2 run, the 6Z run, is actually mild dominated in weeks 3-4 overall. The only recent run that was cool dominated was yesterday’s 12Z. If you look at your latest CFS map, it actually says the run is from 10/24, not 10/25.
+++++++++++++++++++++++++++++++++++++++
By metmike - Oct. 25, 2018, 4:02 p.m.
"If you look at your latest CFS map, it actually says the run is from 10/24, not 10/25."
It always has the previous days date on the site that I use:
http://origin.cpc.ncep.noaa.gov/products/people/mchen/CFSv2FCST/weekly/
Do you have a different link Larry?
++++++++++++++++++++++++++++++
By WxFollower - Oct. 25, 2018, 6:22 p.m.
Mike,
My source is pay. So, I can't provide a link.
The CFSv2 runs 4 times a day. And they flip like crazy from run to run. I know we have disagreements on the influence it has on NG. But one thing I assume we agree on is that one of the runs from the prior day will no have no detectable influence on the next day. Now that I can guarantee!
++++++++++++++++++++++++++++++++++++++++++++
By metmike - Oct. 25, 2018, 8:35 p.m.
Larry,
I am paying for Accu weather products that include alot of European model stuff and CFS model updates but they don't include the CFS update every 6 hours for weeks 3 and 4.
What source are you using?
+++++++++++++++++++++++++++++++++++++
By metmike - Oct. 25, 2018, 8:42 p.m.
Natural Gas Intelligence closing comments(for Thursday):
Debatable weather outlooks for November ruled the natural gas market Thursday as a bearish storage injection wasn’t enough to stop a rally for Nymex futures. The prompt month settled 3.6 cents higher at $3.202, while December rose 2.9 cents to $3.256 and the winter moved up 2.3 cents to $3.198.
Spot gas prices, however, finally pulled back after several days of gains. Interestingly, the decline came as cooler-than-normal conditions were expected to linger over the eastern half of the United States before another reinforcing cold shot expected to arrive during the weekend. Led by steep declines in the Northeast and Rockies, the NGI National Spot Gas Avg. fell 15.5 cents to $3.22.
Just as production growth was the talk for the much of the summer, weather has ruled the roost throughout October as unseasonably chilly weather and dramatic shifts in weather models for November have led to increased volatility in Nymex futures, particularly for the winter months.
Midday outlooks indicated some milder weather could be around the corner. The Global Forecast System data was milder trending for this weekend, but then notably colder Nov. 3-5 as it reflected a stronger cool shot into the central United States and Midwest, which the overnight European model also showed, according to NatGasWeather.
The pattern is still mostly mild Nov. 6-9 in most of the data, but the cooler central United States trend Nov. 2-5 will make milder days before and after less impactful, the forecaster said. “The focus remains on how long this milder Nov. 6-9 pattern will last, with the data still suggesting around Nov. 12-13 before stronger cold blasts return,” the firm said.
Thursday’s market reaction was revealing given the Energy Information Administration’s (EIA) bearish storage data, NatGasWeather said. The EIA reported a 58 Bcf injection into storage inventories for the week ending Oct. 19, although the implied flow was an even greater 63 Bcf build due to a reclassification of 5 Bcf that decreased working gas in South Central non-salt gas stocks.
“Though stockpiles were decreased by 5 Bcf in the revision, the net implied flow of 63 Bcf is incredibly loose and indicates a market far looser than even we had expected,” Bespoke Weather Services chief meteorologist Jacob Meisel said.
Wood Mackenzie analyst Gabe Harris, however, said that any build that is below the five-year injection with a 600 Bcf storage deficit heading into November “is pretty supportive.” Last year, 63 Bcf was injected into storage, while the five-year average injection is 77 Bcf.
“I get excited about the low numbers and possibility of shortages in February as anyone”, but the last 10 days of big weather-adjusted injections “makes me very skittish. Production seems bigly,” Harris said Thursday on Enelyst, an energy-focused chat service hosted by The Desk.
Also Thursday, the EIA said that starting with the Weekly Natural Gas Storage Report (WNGSR) release on Nov. 15, it would include a tab showing the net change for each report week to the WNGSR history file.
Working gas in storage as of Oct. 19 was 3,095 Bcf, 606 Bcf less than last year at this time and 624 Bcf below the five-year average of 3,719 Bcf.
Salt storage operators have been hustling to refill inventories ahead of the peak winter season, and market observers said continued buying in the weeks ahead should keep some support for prices, whereas any sustained cold could spark a rally.
With the November contract expiring soon, however, there could be potential for “selling for a day or two to allow the new front-month contract to better settle into the recent front-month trading range of $3.10-$3.35,” NatGasWeather said.
That won’t be necessary, however, if weather data were to trend any colder during the first or second week of November, it said.
Spot Gas Plummets Despite Approaching Nor’easter
Spot gas prices were lower at most pricing locations across the United States despite some chilly weather in store for the eastern half of the country. Cool weather remained on tap for Friday, while reinforcing cool shots were expected to follow across these same regions Saturday and again early next week, according to NatGasWeather. Perhaps the reason for the decline in prices was that the latest weather models indicated the cold fronts would not be nearly as chilly as recent weather systems that have hit the region.
Still, in preparation for the storm, New York utility Con Edison said it has secured more than 130 additional utility contractors skilled at restoring power lines and clearing roads blocked by fallen trees and wires.
Northeast spot gas prices plunged as much as 77.5 cents at Algonquin Citygate, which dropped to $3.43 as demand in the New England region was expected to fall. This comes after regional demand Wednesday totaled 3.12 Bcf/d, a 450 MMcf/d day/day increase and the third highest demand day this month, according to Genscape Inc. Transco Zone 6 NY dropped 16.5 cents to $3.32.
By WxFollower - Oct. 25, 2018, 9:31 p.m.
Per Mike per NGI:
“The focus remains on how long this milder Nov. 6-9 pattern will last, with the data still suggesting around Nov. 12-13 before stronger cold blasts return,” the firm said.
—————————
Mike,
I use Radiant. They have the 4 times a day CFSv2 runs, which I honestly hardly ever check because I usually don’t find them to have enough value. Like I said, they often flip from run to run. The ones out through late morning were not even cold in weeks 3+.
Here are my thoughts with all due respect:
1. Just because NGI says something doesn’t mean they’re right or that the NG market is thinking the same way. I have no idea why they mentioned cold coming in after November 13. We don’t know if it is based on some CFS run, the MJO, analog years, or something else. Regardless, you and I both know that forecasts in week 3 are very flimsy at best, much less in week 4.
2. As mentioned, the CFSv2 maps shown in your wx threads for weeks 3-4 aren’t even from the same day and can’t possibly be significant market influences. If you continue to post them, I hope you add that they are from the day before and that several runs have been run since.
+++++++++++++++++++++++++++++
By metmike - Oct. 25, 2018, 11:02 p.m.
Larry,
I'm extraordinarily grateful to you for pointing this out about the CFS model weeks 3-4 maps not being the latest ones available. I didn't know that.
1. I only post stuff that I consider to be the latest version of that particular model run which the market pays attention to.
2. Having the latest CFS run will also be advantageous to my own trading.
" Just because NGI says something doesn’t mean they’re right or that the NG market is thinking the same way. I have no idea why they mentioned cold coming in after November 13. We don’t know if it is based on some CFS run, the MJO, analog years, or something else. Regardless, you and I both know that forecasts in week 3 are very flimsy at best, much less in week 4."
Yes, the forecast for that period does not display much skill and the NGI summary doesn't always get it right. However, I'm surprised that you are so underestimating how much the market trades that time frame. This is why I'm especially grateful to you for pointing out my old maps and will work on finding a source that gets the latest ones.
From Natural Gas Intelligence comments earlier this week(I don't have all of them) but over half of the ones that I copied on the forum under the natural gas thread, commented on the period beyond 2 weeks as a key factor for prices on that day.
From Monday morning:
Long-Range Warm Risks Seen as November Natural Gas Called Sharply Lower
++++
From Tuesday close:
"Even with warmer risks in the latest weather models, cold shots that could continue well into November led to a more than 10-cent swing in prompt-month natural gas prices on Tuesday."
++++++++++++++
From Wednesday morning:
Obviously the market is looking beyond week 2 weather based on this. (the 2nd week of November was week 3).
"Milder Temps Seen by Second Week of November as Natural Gas Futures Called Lower"
From Thursday:
The one that was just noted.
+++++++++++++++++++++++++++++++++++++++++++++++++++++++++
By WxFollower - Oct. 26, 2018, 1:20 a.m.
Hey Mike, again with all due respect:
1. How do we know when NGI says the market is focusing on week 3+ on a particular day that the market really is focusing on week 3+ then? There is no spokesman for the market. The market is highly fractured, especially these days. You sure put a lot of trust in them for some reason. How did you find NGI and why do you choose to use them as THE NG market authority? I see this one guy who writes most of their articles (his pic is at the bottom). Who is this guy? How do we know he doesn’t have a position and is talking his book?
2. When the market really is focusing on weeks 3+, upon exactly what are they basing weeks 3+ on? For weeks 1-2, we have the semireliable consensus of the GFS, Euro, and Canadian suites. There’s something to grab hold of for weeks 1-2. They typically don’t jump around too wildly from run to run even though especially late week 2 is already in semi-flimsy land. But then when you get past week 2, what do we have to grab hold of to feel enough confidence to push us into deciding on going short vs long? The very wild CFSv2? The MJO? Analogs? Indices? Something else?
My analogy is that week 1 is the part of a fence with solid posts encased in concrete. Week 2 is the next part that is a bit further away that has posts that are starting to rot out some but are still pretty secure. Week 3 has posts that are heavily rotted at the base while week 4+ has posts that have completely broken at the base. The parts of the fence representing week 1 and even week 2 to a lesser extent can be grabbed without worrying about the fence falling. The parts of the fence represented by weeks 3+ go out as far out as the eye can see. But if you try to grab it there, that very long part of the fence will likely fall. It is my strong feeling that the market primarily chooses to grab onto the first two sturdier sections even though the remaining sections go much further out.
Supposedly NG production dropped 1.2% to 83.7 bcf.
Larry,
I don't know what else to tell you on the market trading the weather (in a big way) beyond 2 weeks right now. You don't have to believe the source(they are wrong sometimes) but I gave you examples from them from every day this week(4) earlier and here's another example of the same thing this morning:
"Loose Storage Print, Potentially Mild Mid-November Pressure Natural Gas Futures Overnight
8:58 AM
November natural gas futures were trading 4.7 cents lower at $3.155/MMBtu shortly before 9 a.m. ET Friday, with the market processing the implications of loose government storage data as forecasters pointed to milder long-range temperature risks."
I don't think 5 days in a row of this happening is a coincidence.
I'm not asking you to believe ME but just read the compelling evidence.
I've never said that this is the only thing going on but early in the heating season is a unique time frame that always over weights the longer range forecasts more than the skill of such forecasts justifies. It has been that way with these week 3-4 forecasts recently(since they were introduced/used).
In the 90's, the 6-10 day forecasting period would sort of get the same treatment but the type of trading resulted in it taking numerous days to dial in the gradual emergence of the market accepting it.........where as today, we can have it all lumped into 1 day.........on a week 3-4 guesstimate..........that has a good chance of changing the next day.
But make no mistake, early in the heating season it can be THE most powerful trading item on days that don't feature a huge change in the earlier periods.
Mike , you don’t have to tell me anything more. We don’t have to believe each other obviously. We don’t agree, which is fine and which reflects on a market with varying opinions of participants.
Here’s my opinion fwiw. The pay service I use, Radiant, has in their morning forecast 9 fewer HDD than yesterday in their 15 day forecast. Backing this up, the last 0Z 11-15 day ensemble model consensus is warmer than 24 hours earlier.
So, I think NG is down today mainly because of a combination of the significantly warmer 15 day forecast and a bearish hangover effect from yesterday’s VERY bearish EIA report. Those 2 things are plenty reason for NG to be down the amount it is regardless of whether or not anything beyond week 2 is even being considered IMO.
The NG market is made up of numerous traders with a myriad of opinions. Mine is just one of them. Yours is just one. NGI’s writer is just another one..
Larry,
Of course this is also with tremendous respect of your well tuned skills for analysis and interpreting weather and its effects on all markets, especially in natural gas.
Which of these things will determine the direction that natural gas moves in during November?
1. The weather pattern in November?
2. 5 days of weather compared to yesterdays forecast for those same 5 days in a short term forecast made during the last week of October?
Item #2 WILL have a very brief effect but 5 days, no matter how cold/warm isn't going to amount to anything that effects end of season storage much. The weather pattern in November can have an effect.................magnified, potentially by many times vs 5 days of a HDD change.
Large position traders from both sides want to know where the trend will take prices.
At the end of November, where will storage be?
Will a temperature change in a 5 day forecast made towards the end of October make a big difference in the storage at the end of November?
Will the weather pattern for the month of November make a difference in storage?
Mike,
First of all, the 11-15 day period was warmer by 6 HDDs in addition to days 1-5. That takes us all the way through 11/9.
We both know that Nov wx in its entirety is going to have much more importance and effect on the market than 10/26-31. I'm not arguing against that at all. But the last half of Nov is a big unknown. So, in the meantime I'm going to trade on something semi-known, the next 15 days, as opposed to trading on the last 15-20 days of Nov with nothing to grasp. I'll trade on the last half of Nov when we get closer and it is forecastable as opposed to guessing at it with nothing even semi-reliable. By the time we get to 11/15, the entire Nov should be dialed in pretty well though subject to daily changes thereafter in the 2 week forecast.
Edit: From Dow Jones newswire this morning, which happens to be similar to my thinking (nothing said about weeks 3-4)(actually week 1 is emphasized along with the bearish EIA. I was looking more at late week 2 along with the EIA.)
"10/26 12:24p CST DJ Natural Gas Declines on Buildup of Supply
By Stephanie Yang
Natural gas prices fell on Friday, hurt by warming temperature forecasts
and a larger-than-expected stockpile build.
Futures for November delivery dropped 0.8% to $3.178 a million British
thermal units on the New York Mercantile Exchange.
On Thursday, the U.S. Energy Information Administration said the amount of
natural gas in storage rose by 58 billion cubic feet during the week ended Oct.
19, exceeding expectations for a 50 bcf build.
Meanwhile, weather forecasts have warmed for the next week, particularly in
the western and central regions of the U.S. "
Thanks Larry,
Closing comments from Natural Gas Intelligence:
Buying Spree Trims November NatGas Losses to Just 1.7 Cents; Spot Gas Slides on Mild Temps
6:12 PM
Natural gas bears looking for confirmation from weather outlooks for mid-November got what they needed Friday as morning models finally converged in showing warmer weather
"The NG market is made up of numerous traders with a myriad of opinions. Mine is just one of them. Yours is just one. NGI’s writer is just another one."
Agree 100% Larry and I place extremely high value on all your opinions...........especially, especially, especially those that are different than mine. Somebody like you, not only provides priceless evaluations/analysis but enlightened views based on realities that I often miss.
Thanks to you, I'm searching for a more updated CFS model provider.
Most people look for information to confirm what they think they know and feel good after finding it. I look for reasons to be wrong..............am happy if I can't find any but celebrate when I see something significant that shows flawed thinking on my part or that I am wrong about.
What a wonderful revelation to discover that you were wrong and can now shift your energy so that it is used to go on a much more PRODUCTIVE path!

Commodities, medium-term horizon, trader
MarketplaceNatural Gas Fundamentals
Total demand for American natural gas is up 13.0% y-o-y to 77.6 bcf per day.
Total natural gas supply is up 13.0% y-o-y to 94.0 bcf per day.
Dry gas production has reached a new all-time high and so do the exports into Mexico.
We currently expect EIA to report an injection of 53 bcf next week.
This report covers the week ending October 26, 2018. Daily data for October 20 to October 25 is estimated. Daily data for October 26 is forecast.
United States has produced some 7,872 bcf of natural gas in Q3 2018 (+13.95 y-o-y) and imported a total of 718 bcf (-1.40% y-o-y).
Drilling activity is at three-year high and the inventory of DUCs continues to decline, meaning that production is likely to grow further.
According to our calculations, total supply in Q4 will amount to 8,749 bcf or 95.1 bcf/d (+9.6% y-o-y).
Natural gas producers love current prices. Thank you, weather!

Research analyst, commodities, oil & gas
https://seekingalpha.com/article/4213377-perfect-storm-can-save-natural-gas
Temporary factors are masking a grossly oversupplied natural gas market.
Production growth continues to exceed expectations.
Weather and temporary factors are the reasons inventories are low.
Gas prices will not hold up without an extremely cold winter.
But all sources of demand don't come close to absorbing the current (and projected) supply.
Given time, we would gradually refill the storage imbalance and face the opposite problem. But could current low inventories and the possibility of a cold winter result in a genuine shortage, with price spikes and panic?
Right now EIA projects winter heating demand at about 6.6 TCF, and end of season inventories at 1.37 TCF on March 31st. Heating demand over the last 28 winters ranged from 5.7 TCF to 7.3 TCF, averaging 6.4. Here's the history from EIA:
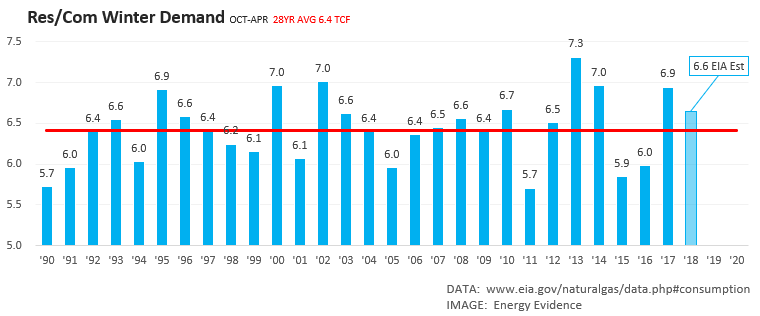
A rough estimate (since cold weather affects other demand and supply variables) would suggest there's about a 10% chance that the heating demand anomaly would exceed +500 BCF over the 7-month period. That could put end-of-winter inventories near 800 BCF. That's comparable to 2014 lows, when Henry Hub Spot averaged $6.20 in February and $5.06 in March, and $4.54 for the calendar year.
With current inventories so far below normal, the market may price in a risk of a gas shortage until the statistical probability falls a bit further. In my estimation, this risk is eliminated if/when we experience near-normal weather through December (under 40 BCFD of heating demand). Warm weather in the interim would accelerate that timeline.
Mike,
Though not easy for most, that's a great attitude (humility) to have. We all should be that open to change our minds by listening to others.
Meanwhile, my provider has a 5 fewer HDD 13 day forecast this afternoon vs the same forecasted days on Friday.