so big reports coming. stocks to use at 24% will be highest since the 28% in 1986 and beans were what 5 bucks? So just to clarify we use tons more beans cliff but please end this blame Trump first talk....54/a....that is a big number
early corn yields are not what usda expected but will they change their number....probably not
I agree mcfarm. Yes, some of the beating that beans are taking is because of Trump, but the majority of the pain is because of over production. There .... I said it. And SA is looking to add a couple more percentage points of acreage!!!
I've mentioned it before, traders have kept the price of grains artificially high and now farmers are going to get kicked in the teeth.
If US farmers aren't in a perfect storm scenario, it's darn close. Swine flu, record production, ballooning world stocks, SA production growing and growing. Not much to hang your hat on if you're a bull.
was never bull but did get caught with some old beans left. back in june fundamentals in corn looked real good and were holding things up...the rest is history and heart burn
Corn fundies are still pretty good. Is it enough to hold up beans? Hard to see.
For the weather that effects grains, please go here:
https://www.marketforum.com/forum/topic/12603/
September USDA report out on Wednesday at 11am CDT.
Export inspections:
Beans pretty good, wheat ok, corn not so good.
Was thinking the lows are in for corn before the USDA report earlier this month +favorable weather for filling in August but am not sure.
Too much rain helped the corn to bounce recently. Harvest pressure is looming.
CZ around 366.......16c off the lows right now and 62c off the late May highs. Charts below are for the front month Sept.
Corn historical perspective:
Who remembers $8 corn not so long(5 years) ago
3 month below September(front month)
1 year below
5 year below
|
The low for SX back in mid July was to just above 826. So this current move down just below 829 at the end of August did not make new lows. For the time being, it marks a double bottom.
I thought the lows were in for beans but that was before the USDA fed the market one of the most bearish crop reports ever. 2019 to have the highest stocks in history!
Also, outstanding August weather has increased the crop size.
Too much rain has been providing some support but it will be drier this week.
These are 10 year lows and over $2 below the $10.60 below late May highs but 20c above the lows 2 weeks ago and 23c above the lows of July.
Soybeans: Wider perspective: Currently around 10 year lows !!!!!
Charts below still Sept contract.
Soybeans 3 months below......bottom in.
| |
Soybeans 1 year chart below
| |
Soybeans 5 years below
Soybeans10years-Wow, look at that high from the drought of 2012...and demand, Currently, we are below the 10 year lows!
| |
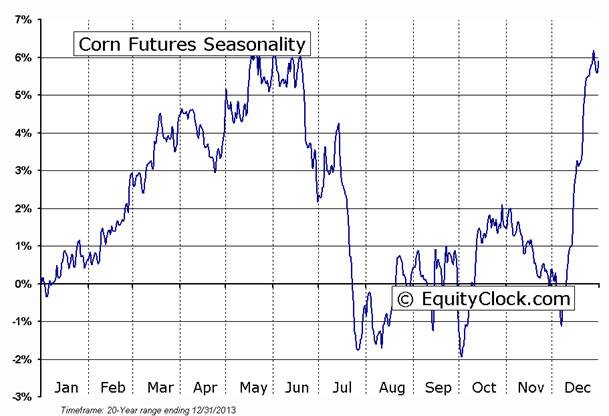
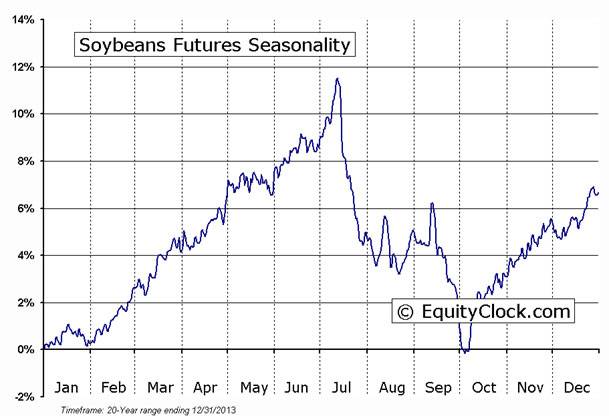
As noted below in the seasonals(averaging prices over a 20 year period and graphing them with time), most of the price weakness in corn and beans takes place in June and July.
In many years, the month of August into early September features some price strength.......as much of the weather premium has come out and much of the crop size is known. Even great weather, sometimes has a hard time inspiring additional aggressive selling that pushes prices to new lows.
However, this August featured great weather and a record crop and pushed us back near the lows.
Beans have a pretty strong, brief spike down in late Sept to early Oct, headed into early harvest that can often features new lows. Corn sometimes too but it often does not take out the Summer lows. That does not always happen and each year is different.
Of course the tariff situation made things worse but the last time that ending stocks as a % of usage were projected to be higher than this was the mid 1980's! Do you remember prices then?
If you look at prices at the bottom, it's a reminder that soybeans were under $5 from early 1999 thru half of 2002 with fundamentals far more bullish than they are now.
So as long as we don't have unprecedented damage from flooding in September, as soon as the market trades on harvest pressure, the bottom really can fall out. The actual bottom will be lower because of the China situation but here on planet earth, the empirical data below means prices would still very likely have dropped below 10 year lows at harvest.
The last 3 years, in Sept. soybean prices were 9.05-2015, 9.43-2016 and 9.35-2017 with MUCH less bearish projections of ending stocks as a % of total use. Then they dropped even lower than that from harvest pressure.
People forget but the only reason that we got above $10 earlier this year was a drought in parts of South America for 2 months, then funds loading up with a huge speculative long position ahead of our growing season.
At the end of May 2018, when the weather turned from hot/dry forecasts to wet and crop estimates kept increasing......they covered their longs and built up a huge short position.
https://www.agmanager.info/grain-marketing/grain-supply-and-demand-wasde
US Monthly Average Soybeans Price Received |
| Year | Jan | Feb | Mar | Apr | May | Jun | Jul | Aug | Sep | Oct | Nov | Dec | Avg* |
|---|---|---|---|---|---|---|---|---|---|---|---|---|---|
| $/bu. | |||||||||||||
| 1960 | 2.01 | 1.99 | 1.99 | 2.02 | 2.00 | 1.97 | 1.97 | 1.99 | 1.97 | 1.94 | 1.96 | 1.99 | 1.98 |
| 1961 | 2.23 | 2.48 | 2.68 | 3.02 | 2.96 | 2.60 | 2.48 | 2.49 | 2.34 | 2.20 | 2.27 | 2.30 | 2.50 |
| 1962 | 2.32 | 2.32 | 2.34 | 2.38 | 2.36 | 2.34 | 2.35 | 2.33 | 2.25 | 2.23 | 2.30 | 2.35 | 2.32 |
| 1963 | 2.41 | 2.50 | 2.51 | 2.45 | 2.47 | 2.48 | 2.44 | 2.45 | 2.44 | 2.56 | 2.66 | 2.58 | 2.50 |
| 1964 | 2.65 | 2.57 | 2.55 | 2.45 | 2.36 | 2.35 | 2.34 | 2.35 | 2.51 | 2.55 | 2.57 | 2.71 | 2.50 |
| 1965 | 2.73 | 2.81 | 2.85 | 2.85 | 2.72 | 2.74 | 2.69 | 2.53 | 2.35 | 2.31 | 2.36 | 2.48 | 2.62 |
| 1966 | 2.67 | 2.77 | 2.71 | 2.78 | 2.90 | 3.04 | 3.37 | 3.49 | 2.97 | 2.78 | 2.80 | 2.82 | 2.93 |
| 1967 | 2.77 | 2.71 | 2.74 | 2.71 | 2.69 | 2.71 | 2.66 | 2.56 | 2.53 | 2.44 | 2.43 | 2.48 | 2.62 |
| 1968 | 2.53 | 2.57 | 2.57 | 2.56 | 2.58 | 2.54 | 2.52 | 2.51 | 2.40 | 2.32 | 2.40 | 2.42 | 2.49 |
| 1969 | 2.46 | 2.48 | 2.48 | 2.51 | 2.56 | 2.52 | 2.52 | 2.51 | 2.28 | 2.23 | 2.30 | 2.30 | 2.43 |
| 1970 | 2.36 | 2.40 | 2.42 | 2.48 | 2.52 | 2.60 | 2.72 | 2.65 | 2.66 | 2.77 | 2.86 | 2.77 | 2.60 |
| 1971 | 2.86 | 2.92 | 2.91 | 2.80 | 2.85 | 2.98 | 3.18 | 3.09 | 2.95 | 2.96 | 2.84 | 2.93 | 2.94 |
| 1972 | 2.92 | 3.00 | 3.20 | 3.37 | 3.35 | 3.32 | 3.34 | 3.36 | 3.26 | 3.13 | 3.38 | 3.95 | 3.30 |
| 1973 | 4.11 | 5.49 | 6.04 | 6.14 | 8.27 | 10.00 | 6.69 | 8.99 | 5.81 | 5.63 | 5.14 | 5.65 | 6.50 |
| 1974 | 5.87 | 6.07 | 5.96 | 5.15 | 5.21 | 5.13 | 6.11 | 7.55 | 7.32 | 8.17 | 7.44 | 7.03 | 6.42 |
| 1975 | 6.30 | 5.72 | 5.31 | 5.60 | 5.00 | 4.90 | 5.28 | 5.80 | 5.32 | 4.92 | 4.45 | 4.28 | 5.24 |
| 1976 | 4.46 | 4.50 | 4.46 | 4.52 | 4.87 | 6.16 | 6.73 | 6.07 | 6.65 | 5.90 | 6.11 | 6.56 | 5.58 |
| 1977 | 6.81 | 7.06 | 7.83 | 9.05 | 9.24 | 8.13 | 6.52 | 5.48 | 5.17 | 5.28 | 5.61 | 5.68 | 6.82 |
| 1978 | 5.75 | 5.53 | 6.20 | 6.49 | 6.77 | 6.69 | 6.40 | 6.21 | 6.20 | 6.26 | 6.41 | 6.49 | 6.28 |
| 1979 | 6.58 | 6.99 | 7.16 | 7.06 | 7.06 | 7.36 | 7.36 | 7.07 | 6.81 | 6.35 | 6.30 | 6.27 | 6.86 |
| 1980 | 6.39 | 6.20 | 5.94 | 5.63 | 5.76 | 5.91 | 6.75 | 7.18 | 7.59 | 7.68 | 8.18 | 7.80 | 6.75 |
| 1981 | 7.80 | 7.50 | 7.59 | 7.60 | 7.40 | 7.05 | 7.13 | 6.71 | 6.21 | 6.06 | 6.04 | 6.00 | 6.92 |
| 1982 | 6.13 | 6.04 | 5.99 | 6.17 | 6.27 | 6.12 | 5.99 | 5.59 | 5.22 | 5.06 | 5.34 | 5.46 | 5.78 |
| 1983 | 5.56 | 5.66 | 5.82 | 6.09 | 6.06 | 5.90 | 6.27 | 7.57 | 8.28 | 7.96 | 7.81 | 7.75 | 6.73 |
| 1984 | 7.85 | 7.28 | 7.68 | 7.83 | 8.12 | 7.99 | 6.95 | 6.50 | 6.09 | 6.07 | 6.01 | 5.82 | 7.02 |
| 1985 | 5.91 | 5.77 | 5.88 | 5.88 | 5.70 | 5.62 | 5.42 | 5.10 | 4.99 | 4.85 | 4.92 | 5.01 | 5.42 |
| 1986 | 5.16 | 5.18 | 5.23 | 5.23 | 5.25 | 5.19 | 5.11 | 4.99 | 4.85 | 4.55 | 4.64 | 4.67 | 5.00 |
| 1987 | 4.70 | 4.69 | 4.73 | 4.90 | 5.20 | 5.36 | 5.25 | 5.02 | 5.02 | 5.04 | 5.36 | 5.63 | 5.08 |
| 1988 | 5.73 | 5.96 | 6.05 | 6.39 | 6.98 | 8.18 | 8.50 | 8.33 | 7.93 | 7.53 | 7.43 | 7.53 | 7.21 |
| 1989 | 7.69 | 7.41 | 7.51 | 7.29 | 7.20 | 7.05 | 6.83 | 6.07 | 5.70 | 5.55 | 5.66 | 5.64 | 6.63 |
| 1990 | 5.65 | 5.56 | 5.65 | 5.82 | 5.97 | 5.88 | 5.97 | 6.00 | 5.99 | 5.88 | 5.78 | 5.72 | 5.82 |
| 1991 | 5.71 | 5.65 | 5.76 | 5.77 | 5.67 | 5.56 | 5.36 | 5.66 | 5.64 | 5.48 | 5.48 | 5.45 | 5.60 |
| 1992 | 5.54 | 5.59 | 5.67 | 5.66 | 5.87 | 5.94 | 5.59 | 5.40 | 5.36 | 5.26 | 5.36 | 5.61 | 5.57 |
| 1993 | 5.58 | 5.56 | 5.65 | 5.73 | 5.81 | 5.90 | 6.56 | 6.56 | 6.21 | 6.01 | 6.32 | 6.64 | 6.04 |
| 1994 | 6.72 | 6.71 | 6.73 | 6.57 | 6.77 | 6.72 | 5.92 | 5.58 | 5.47 | 5.30 | 5.36 | 5.41 | 6.11 |
| 1995 | 5.47 | 5.40 | 5.51 | 5.55 | 5.56 | 5.68 | 5.90 | 5.83 | 5.98 | 6.16 | 6.40 | 6.76 | 5.85 |
| 1996 | 6.78 | 7.00 | 7.00 | 7.43 | 7.69 | 7.41 | 7.62 | 7.82 | 7.79 | 6.94 | 6.90 | 6.91 | 7.27 |
| 1997 | 7.13 | 7.38 | 7.97 | 8.23 | 8.40 | 8.16 | 7.52 | 7.25 | 6.72 | 6.49 | 6.86 | 6.72 | 7.40 |
| 1998 | 6.69 | 6.57 | 6.40 | 6.26 | 6.26 | 6.16 | 6.14 | 5.43 | 5.25 | 5.18 | 5.39 | 5.37 | 5.93 |
| 1999 | 5.32 | 4.80 | 4.61 | 4.63 | 4.50 | 4.44 | 4.19 | 4.39 | 4.57 | 4.48 | 4.45 | 4.43 | 4.57 |
| 2000 | 4.62 | 4.79 | 4.91 | 5.00 | 5.19 | 4.93 | 4.53 | 4.45 | 4.59 | 4.45 | 4.55 | 4.78 | 4.73 |
| 2001 | 4.68 | 4.46 | 4.39 | 4.22 | 4.33 | 4.46 | 4.79 | 4.85 | 4.53 | 4.09 | 4.16 | 4.20 | 4.43 |
| 2002 | 4.22 | 4.22 | 4.38 | 4.47 | 4.64 | 4.88 | 5.35 | 5.53 | 5.39 | 5.20 | 5.46 | 5.46 | 4.93 |
| 2003 | 5.51 | 5.55 | 5.59 | 5.82 | 6.07 | 6.09 | 5.82 | 5.68 | 6.06 | 6.60 | 7.05 | 7.17 | 6.08 |
| 2004 | 7.35 | 8.28 | 9.28 | 9.62 | 9.56 | 9.08 | 8.46 | 6.83 | 5.84 | 5.56 | 5.36 | 5.45 | 7.56 |
| 2005 | 5.57 | 5.42 | 5.95 | 6.03 | 6.20 | 6.58 | 6.84 | 6.15 | 5.77 | 5.67 | 5.62 | 5.77 | 5.96 |
| 2006 | 5.88 | 5.67 | 5.57 | 5.52 | 5.68 | 5.61 | 5.61 | 5.23 | 5.24 | 5.52 | 6.07 | 6.18 | 5.65 |
| 2007 | 6.38 | 6.87 | 6.95 | 6.88 | 7.13 | 7.51 | 7.56 | 7.72 | 8.18 | 8.36 | 9.41 | 10.00 | 7.75 |
| 2008 | 9.96 | 11.70 | 11.50 | 12.00 | 12.10 | 13.20 | 13.30 | 12.80 | 10.70 | 9.94 | 9.38 | 9.24 | 11.32 |
| 2009 | 9.97 | 9.55 | 9.12 | 9.79 | 10.70 | 11.40 | 10.80 | 10.80 | 9.75 | 9.44 | 9.53 | 9.80 | 10.05 |
| 2010 | 9.79 | 9.41 | 9.39 | 9.47 | 9.41 | 9.45 | 9.79 | 10.10 | 9.98 | 10.20 | 11.10 | 11.60 | 9.97 |
| 2011 | 11.60 | 12.70 | 12.70 | 13.10 | 13.20 | 13.20 | 13.20 | 13.40 | 12.20 | 11.80 | 11.70 | 11.50 | 12.53 |
| 2012 | 11.90 | 12.20 | 13.00 | 13.80 | 14.00 | 13.90 | 15.40 | 16.20 | 14.30 | 14.20 | 14.30 | 14.30 | 13.96 |
| 2013 | 14.30 | 14.60 | 14.60 | 14.40 | 14.90 | 15.10 | 15.30 | 14.10 | 13.30 | 12.50 | 12.70 | 13.00 | 14.07 |
| 2014 | 12.90 | 13.20 | 13.70 | 14.30 | 14.40 | 14.30 | 13.10 | 12.40 | 10.90 | 9.97 | 10.20 | 10.30 | 12.47 |
| 2015 | 10.30 | 9.91 | 9.85 | 9.69 | 9.58 | 9.58 | 9.95 | 9.71 | 9.05 | 8.81 | 8.68 | 8.76 | 9.49 |
| 2016 | 8.71 | 8.51 | 8.56 | 9.04 | 9.76 | 10.20 | 10.20 | 9.93 | 9.43 | 9.30 | 9.46 | 9.64 | 9.40 |
| 2017 | 9.71 | 9.86 | 9.69 | 9.32 | 9.26 | 9.10 | 9.42 | 9.24 | 9.35 | 9.18 | 9.22 | 9.30 | 9.39 |
| 2018 | 9.30 | 9.49 | 9.81 |
I addressed this a couple of times before with you Mike and neither time did you respond but I will try it again.
In the post were you talked about your superior math skills and advance thinking process, were you use empirical that shed unbiased truth to subjects ( or something to that effect). You made this case that beans were correctly priced when viewed in the ending stocks to use matrics.
I asked you then if you understood what was flawed about that thought process and you never answered I will ask again do you understand the flaw in your thought process?
"were you use" if you are going to post something snarky I would be careful of my English. Don't usually waste my time but a former poster here often did this to the cheers of his "team mates"
as far as beans there is supply and demand. if you are implying the tariffs played a part here, sure, but its minimal compared to the 54/a thing.
frey,
If you have data that contradicts the data in the posts above, please share it with us.
my post was not addressed to you Mcfarm but if you think the loss of 350- 400mb of exports is minimal your deeply mistaken.
yields fluctuate from year to year and are only a guess at this time
demand when lost is very hard to get back and when lost in the belligerent way this demand was lost will be even harder to get back.
What I truly don't understand is that farmers spent 35 years blaming Carter for their problems but are trying and trying to give trump a pass. it is simply unbelievable.
I understand your a trump no matter what guy but atleast quit lying to yourself.
frey,
The forum is open to everybody who wants to comment on any post here.
I understand your good point and am well aware of this. However, potential losses in demand for next year and beyond are far more speculative than the estimate for this years crop size, when the crop is 96% made.
Who is more disconnected from the current fundamentals.
mcfarm, who's giving Trump a free pass?or
frey, who thinks that beans could be at $10 if not for Trump wrecking the export market?
If China buys exclusively from South America, SA will run out of beans and their price will sky rocket well before that happens to ration their supply. Then what happens to cheap US beans? Yeah, the rest of the world INCREASES their purchases from the US.
The cure for low prices is low prices and it could happen in the strangest way over the next year. Farmers are likely to plant less beans next year too if prices continue low.
Storage hedges can work if basis is weak, but most places only until the cash market firms into the end of the year. Futures don’t typically offer carry until July because the market’s invisible hand sees no need to hold the beans off the market that long. But this year the other crop coming on from South America won’t supplant U.S. soybeans to many destinations because so much of Brazil’s production will go to China. Other buyers will need U.S. soybeans longer into the selling season, hence the carry.


the problem Mike is that until this trade war is over the market does not fear being short so they stay on one side of the market unless there is a rumor of tariff movement. Which is evident in the fact that any rumor not even factual sends the Market up .40 cents.
the reason for that is not that we will get back the demand that is lost, but instead the market fears what happens if China comes to the table and starts to buy. That buying may not stop for a while and the shorts have fear again.
look at corns fundamentals they scream higher prices except for the fact that the Market is comfortable with the rotation to corn will be large and they will have more than enough acres to quilch demand by fall 2019.
the bidding war is done unless we come to some kind of compromise with China.
and this maybe a needed remedy ( I'm not in agreement with that ) but if you are then at least admit to yourself what the cost is and except those actions and the monetary hardships they cause.
If one wanted to be a conspiracy buff one would make the case that this administration is predicting a super large crop trying to give them some cover for the damage their tariffs are causing to grain prices. as things sit there is NO BID at the PNW for ship load slots for late Sept. My guess is you can go back to when the PNW unit loader program started and we have never seen that before. Yet there will be ships of beans loaded out of Port Duluth my bet is those beans end up in China at some point and the US farmer is paying the freight.
that me boy is what tariffs do.
Thanks frey,
Appreciate your good points. That is one element to be considered right now.
"mcfarm giving Trump a free pass" ......never have, never will...what I have said in nearly every post if you guys would just acknowledge is that the 54.5 number is a way bigger factor for this summer than the tariff thing...over and over....that is not a free pass. Of course the tariffs have had a short term affect....again
now lets suppose this tariff thing is solved earlier than thought. Over reaction to the up would be anticipated.
As far as Trump using big production for cover he must be a hell of lot smarter anybody thinks as this thing started way before the weather would lead to a 54.5 crop...damn Trump is good if he knew that when we started down this road and he was looking for "cover" as frey puts it
Just talking frey language mcfarm.
thanks....think in the media that is called coloring to make a point. Understand and yes all sides do it
if this crop does come in at 54.5 BPA the market has a whole nother level to the down side.
I know of nobody but YOU who is talking that way.
trump did not need to know anything in advanced, well except that his koolaid drinkers would run around and keep upping the yield number to give him cover as prices fell claiming a crop as big as they needed to give him cover,Kind of like your now 54.5 number.
and btw thanks for making my point, the fall in prices happened well before the crop was guessed to be 51.5 BPA let alone your now 54.5 number
"and btw thanks for making my point, the fall in prices happened well before the crop was guessed to be 51.5 BPA let alone your now 54.5 number"
You must not trade frey.
The market always acts well before the guesses come out. ALWAYS!
This year was no exception. Beans made their highs at the end of May.........AFTER the news about the tariffs was already out there and near the end of a 2 week period with hot/dry 2 week forecasts and prices going up to dial in extra risk premium. $10.60 was the high in Nov Beans.
Turns out, the period of hot/dry at that time ended up being perfect to plant the crop in timely fashion..............a bearish factor...........3 months ago.
After that, tons of rain for June, instead of the hot/dry in the forecast and the risk premium all came out with crop ratings being near the highest ever for June into July.
How would the market NOT be trading the potential for record yields then? When the USDA came out with an estimate for record yields in August, it just confirmed what those selling aggressively in June and early July were positioning for.......... record yields would come if the weather pattern continued..........and it did.
More ideal weather in August and near record crop ratings which will undoubtedly mean a record crop at harvest time. But the early selling pressure speculating on a record crop from smart, large speculators started over 3 months ago............not when frey heard estimates later in the Summer.
You must not trade frey.
The market always acts well before the guesses come out. ALWAYS!
Bingo, mike. If you are a real trader, this is so obvious that no discussion about it is ever necessary.
But - - again, what is the alternative to what the president is doing? Allowing our trading partner (enemy?) to accumulate every more US dollars to invest in agriculture around the world will bring us - what? Allowing those dollars to accumulate and be invested in the Chinese military will bring us - what? Allowing the Chinese to steal our intellectual property will bring us - what?
I have to say that the people who want to willingly walk blindfolded toward the cliff is beyond my comprehension.
the things that weighs in against you are:
seasonals say a rally was to be had, and when the first big breakdown in pricing happened it just happened to be at the time the first true threat of tariffs surfaced.
second every time there has been even a hint of things possibly getting resolved the Market has jumped .40 cents to almost limit on the thought, only to be brought back to lower lows as it became obvious that things were simply getting worse.
jumped 40 cents...so what are you saying the tariff thing was worth 40 and the market 1.50? few would argue that but you are not, right?