Previous thread on this topic:
Impending collapse of the US dollar
Started by metmike - Dec. 27, 2025, 4:02 p.m.
https://www.marketforum.com/forum/topic/116818/
+++++++++++++++++++
By metmike - Jan. 25, 2026, 6:25 p.m.
Yes on natural gas! They can turn up production fairly fast. Once the cold subsides, they can start building storage again.
Agree also about the supply side of silver. However, there is MUCH more going on.
The supply side of silver didn't cause the US Dollar to gap lower and isn't causing the US dollar to crash lower.
I''ll start a new thread and do a dollar index analysis this evening after I get rid of a foot of snow on the driveway and sidewalk.
We are about to see a major downside break out!
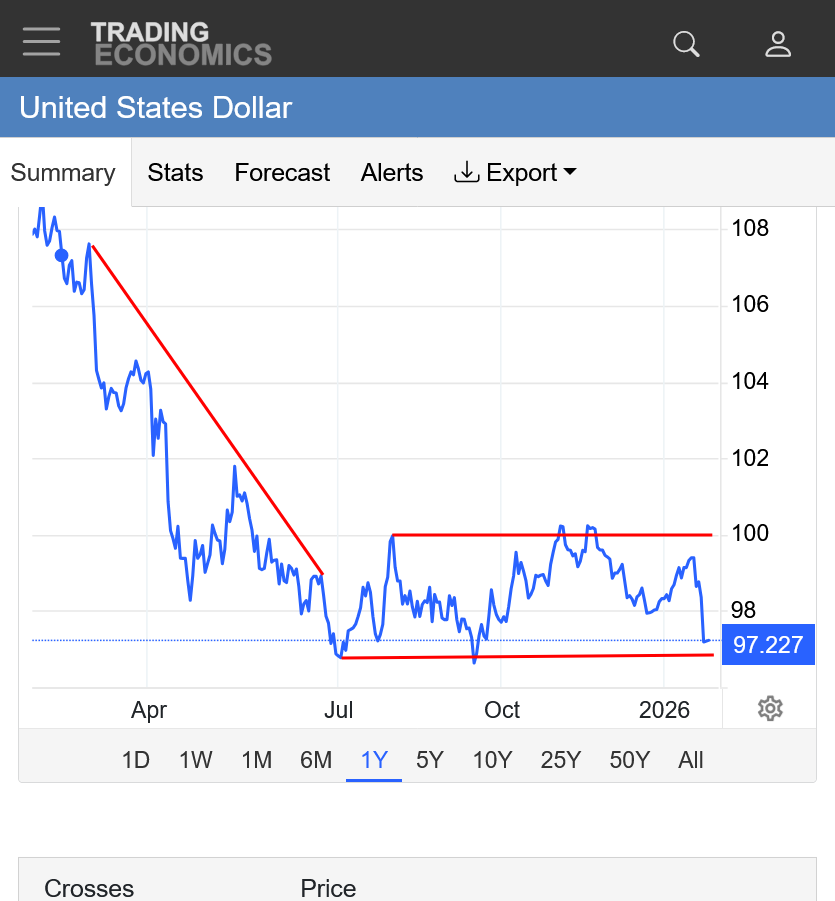
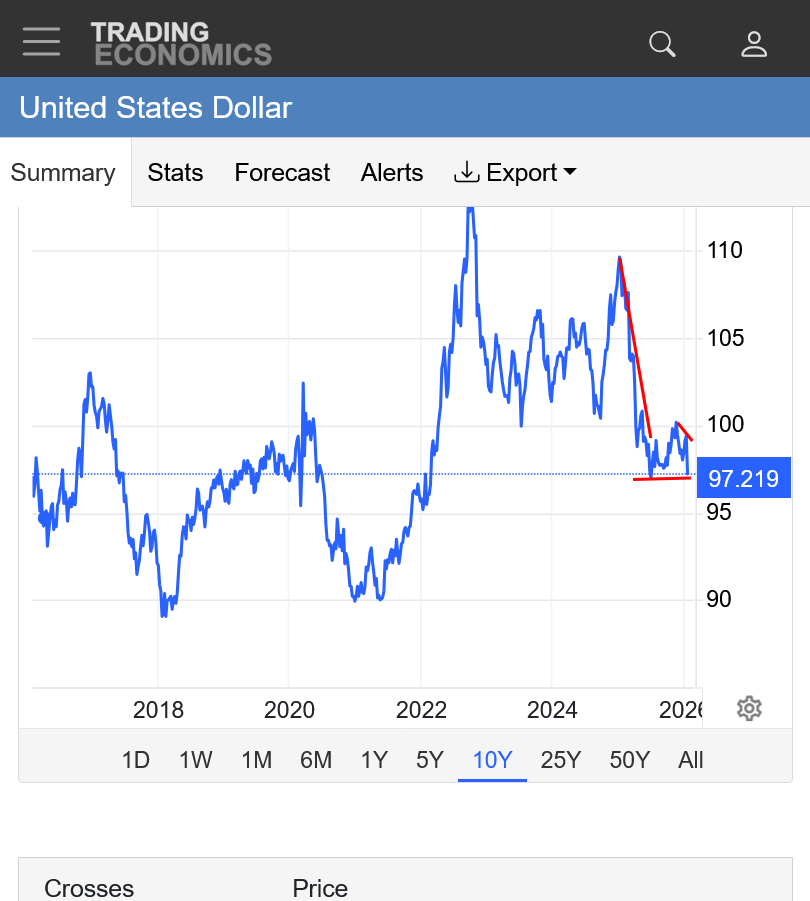
https://tradingeconomics.com/united-states/currency
1. 1 year
2. 10 years: top of the red downtrend line is exactly when Donald Trump started his 2nd term
Published
Jan 26, 2026 at 01:23 PM EST
https://www.newsweek.com/chart-showing-us-dollar-crashing-takes-off-online-11418772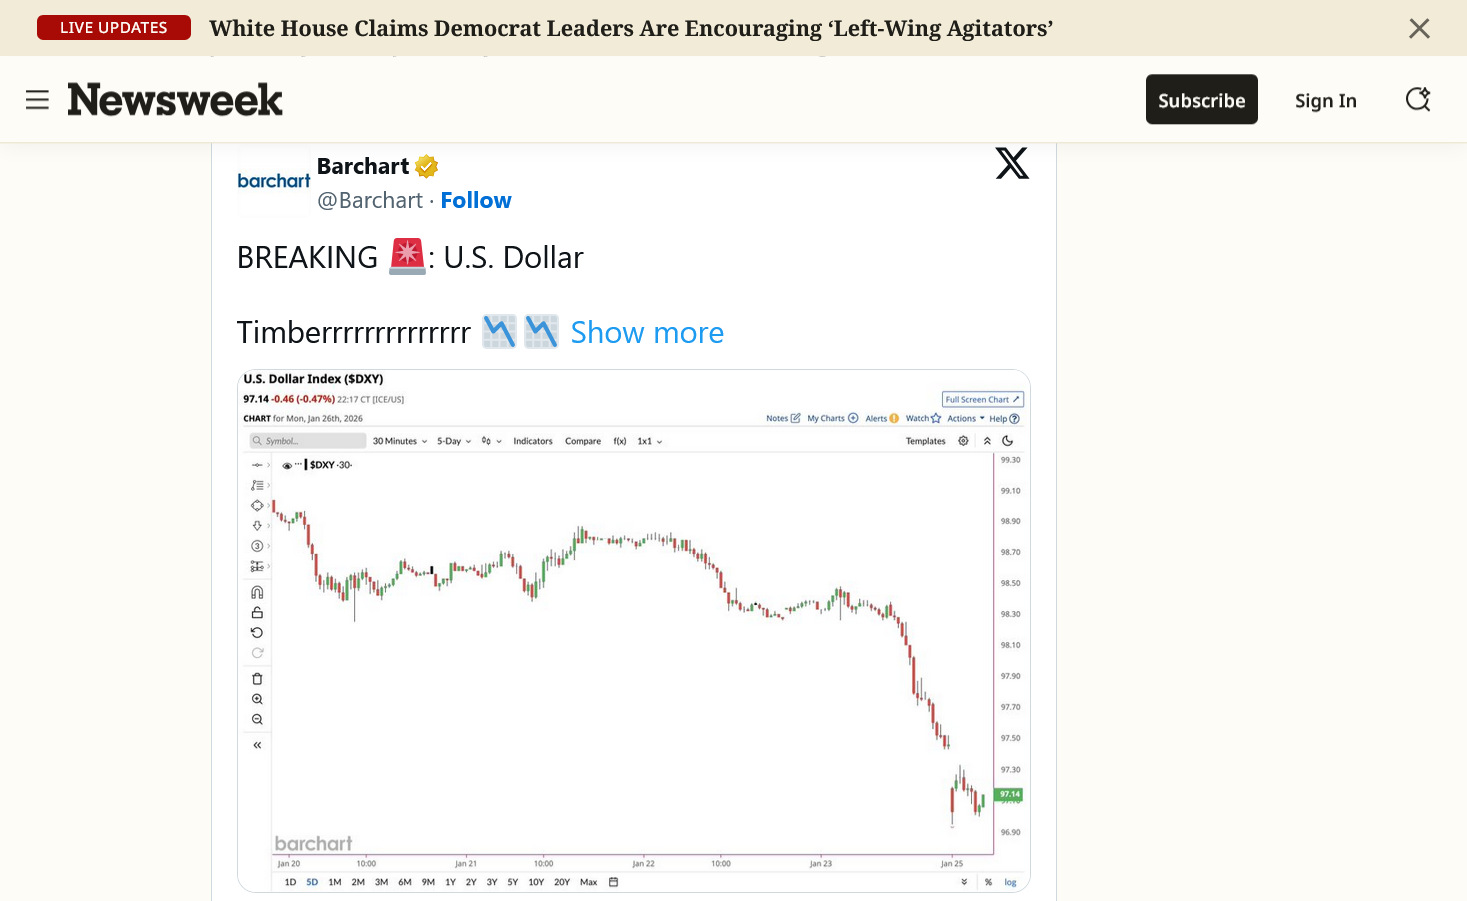
The US Dollar has been MUCH lower than this before!
https://www.crescat.net/the-history-of-the-us-dollar-cycles/
Observe in this chart, for example, the 10-year rolling performance of the US dollar, as measured by the DXY index, demonstrates a strong correlation (0.85) with the ratio of the S&P 500 to the MSCI World Index over the past three decades. Both lines now appear to be reversing direction, which may indicate a potential shift in the dollar’s trend.

Investors should consider a critical question:
Can the US. sustain such policies over the long term? What would reduced government spending mean for the trajectory of the US economy? We remain highly skeptical about the sustainability of this growth relative to the rest of the world in the years ahead.

An Unsustainable Path
No major economy in the world today is pursuing such an aggressively expansionary fiscal policy while shouldering an unsustainable cost of debt service. This trajectory, in our view, is untenable and will inevitably lead to policies of interest rate suppression and constrained government spending—signaling a pivotal moment for the U.S. dollar’s strength. This is a stark reflection of why the dollar has become increasingly vulnerable in the current macro landscape, shedding its long-held reputation as the “cleanest dirty shirt.”


Dangerously Extreme
US stocks currently account for 73% of the MSCI World Index, the highest single-country weighting ever recorded in the history of the index.
This overwhelming dominance reflects how US equities have attracted the majority of global capital, leaving the rest of the world largely overlooked and underfunded by investors. At what point does the tide shift? Those who believe it never will blatantly ignore the lessons of history. Market leadership undergoes secular shifts, and after an extended period of US stocks outperforming the rest of the world, it’s increasingly likely that capital will begin to flow back into countries that have long been overlooked.

Buffett’s Go-To Market Indicator
The chart below highlights yet another stark example of the overvaluation issue plaguing U.S. stocks. Utilizing Warren Buffett’s preferred metric for gauging market frothiness, the market cap-to-GDP ratio, it’s evident that the U.S. currently holds the most extreme valuation globally.

he mining industry has faced a prolonged lack of capital, but the current political emphasis on fostering economic growth to address the debt challenge could provide the spark for its resurgence. As a legacy industry deeply woven into the fabric of society for centuries, we are confident that mining is here to stay. In fact, we would argue that its significance is poised to inflect upward.

Performance
I'm sure producers would prefer the weaker dollar to increase exports of their crops. It also helps to increase sales of EVERYTHING that we sell to help offset the damage from Donald Trump's tariffs.
The drop in the dollar is likely very intentional by Donald Trump. Having lower interest rates as he wants will also cause the dollar to fall as it drives away foreign investments in the United States.
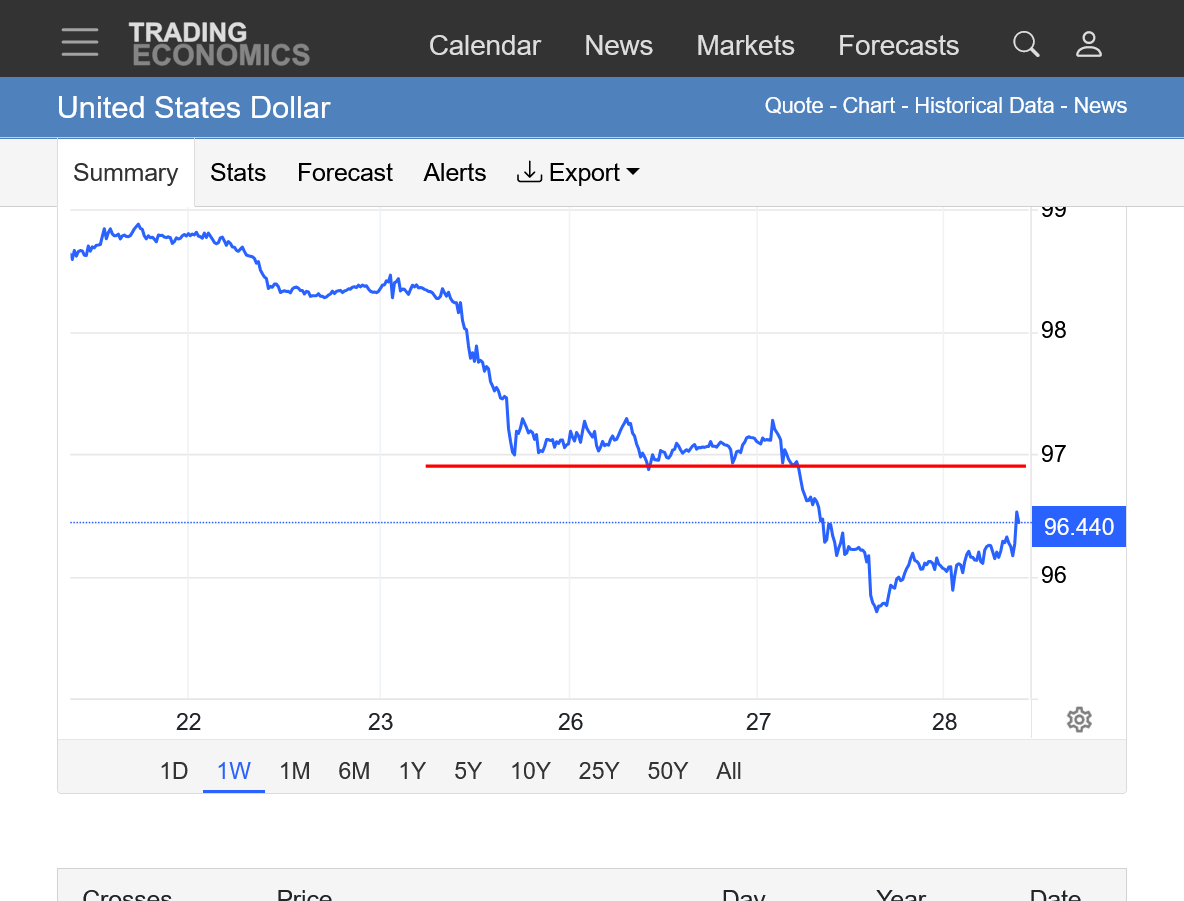
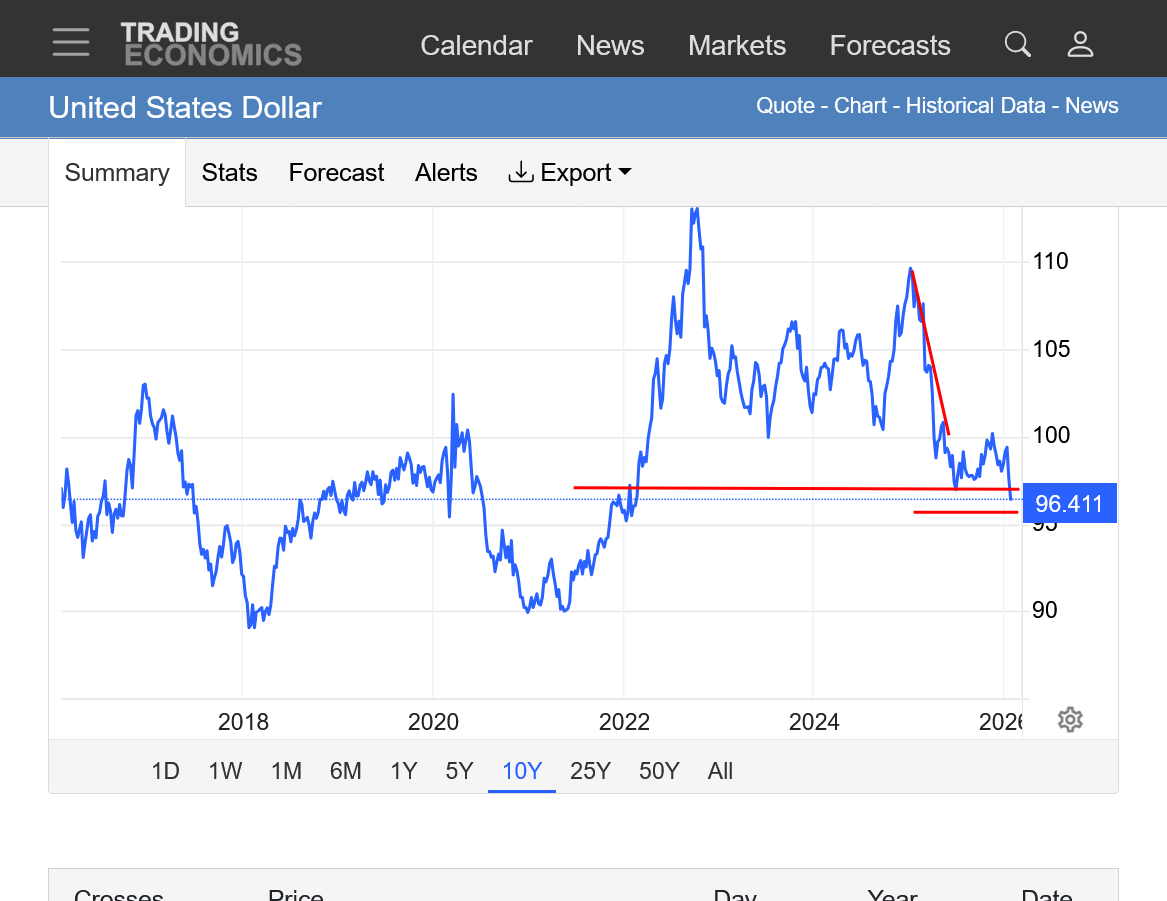
We got the expected downside break out.
https://tradingeconomics.com/united-states/currency
1. Weekly: Downside breakout that bottomed at 95.7 from follow thru selling after we broke thru the support. Pretty substantial bounce since then.
2. 10 years: Downside breakout. The bottom red line is 95.7 which is where we actually dropped but this source was unable to graph it correctly. Strong downtrend drawn from the day that Donald Trump was sworn in.