(From 3492 Low → 6165 → 4842 → 7000 → Projection: 7240 → 7800)**
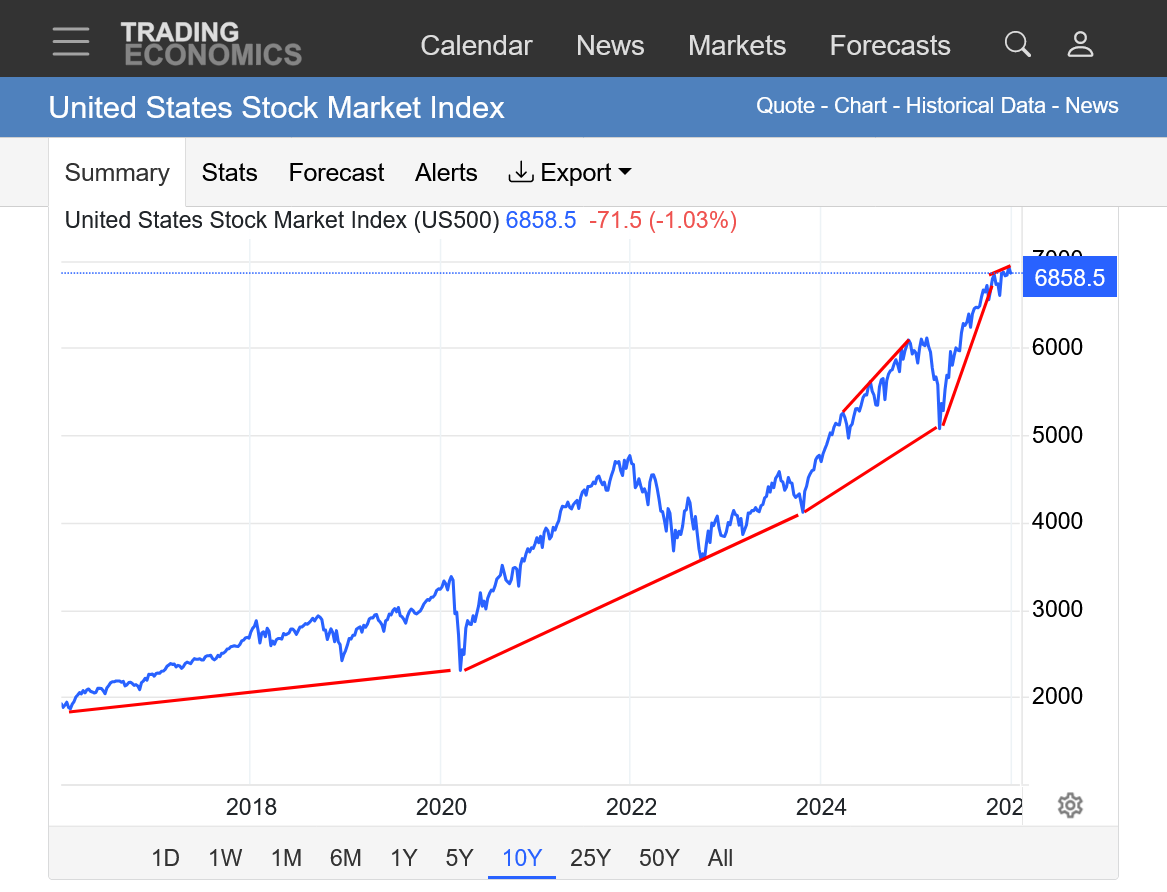
The structural rally in the S&P 500 from the 3492 cyclical panic low created a multi-year impulse that still remains intact. The first impulse leg pushed aggressively toward 6165, completing a wave consistent with a re-leveraging phase reinforced by liquidity expansion, narrowing volatility, and a notable shift in institutional COT positioning. The subsequent retracement toward 4842—which also aligns with the January 4th 2020 pre-COVID high at 4804—formed a technically significant pivot. This zone has acted as a primary consolidation shelf, where long-only funds and asset managers accumulated exposure while commercial dealer hedging decreased.
From that stabilizing base at 4842–4804, the index accelerated into a steep vertical ascent toward 7000, driven by a combination of trend-following flows and systematic volatility compression. The market behavior above 6900 has been consistent with the “parabolic exhaustion” pattern—a phase where leveraged funds aggressively add spreads while outright directional net long exposure begins to flatten or even decline. This phenomenon is visible in the COT structure: leveraged funds are holding large short positions as hedges, while asset managers still retain the majority long exposure. Dealer intermediaries remain heavily short because they absorb the other side of institutional demand, but their sharp weekly changes (+73k long, +140k spread) confirm increased hedging activity rather than new directional conviction.
The current price behavior, hovering near 7000 and pressing toward 7240, suggests the market is entering the late phase of an intermediate cycle. If the index clears 7240 with volume support, the next resistance cluster emerges around 7480–7550, but the stronger magnet remains the 7800 zone, which aligns with:
This confluence makes 7800 a high-probability terminal level for the next major swing.
Before that higher leg materializes, the market is likely to see a sharp corrective pullback from 7240, which is a natural exhaust point based on both time and momentum symmetry. A retracement toward 6600–6420 is reasonable, and in an extended flush, the mid-year cycle could test 5140, which is a historical magnet from longer-term Gann cycles and matches the midpoint of the 3492–7000 structure. This would not break the long-term bull trend but rather reset market internals before the final push toward 7800.
In summary, the structural trend remains bullish in the long horizon, but the market is entering a compression-to-exhaustion stage. A pullback from 7240 appears likely before a renewed surge into 7800+, which may complete the long-term expansion cycle begun at 3492. Traders should be prepared for heightened volatility, large hedging adjustments, and the possibility of a multi-week corrective phase before the final advance unfolds.
Thanks very much, fayq!
Ongoing discussion on the stock market:
Trump's Influence on Markets/Economy
31 responses |
Started by joj - Dec. 7, 2025, 8:48 a.m.
6840 another leg up if it breaks 3 days swing high or improve low -- moi trade long @6861----6840 stop@@ tgt --- and ride that for a while Major top out area --!! swing trade is all for now RRR=1:4 ReAct 2MKt condition$
Good luck, fayq!
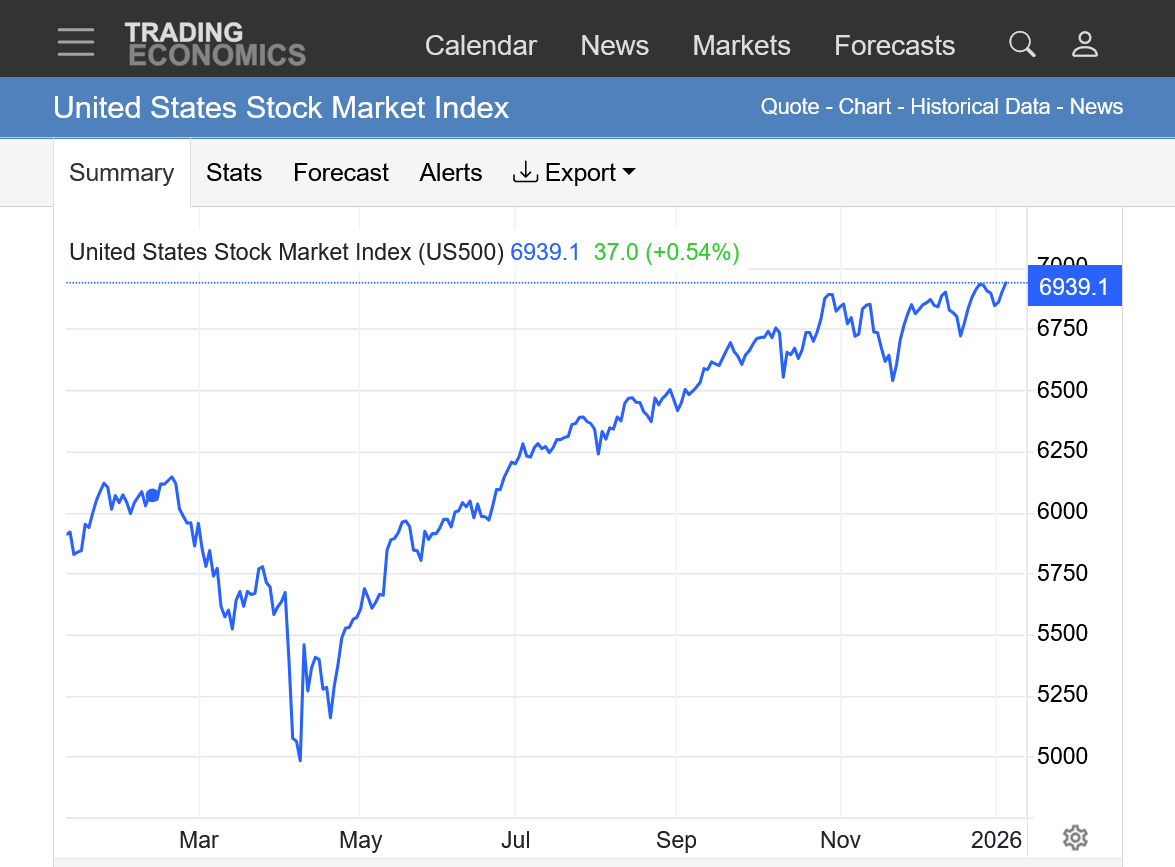
https://tradingeconomics.com/united-states/stock-market
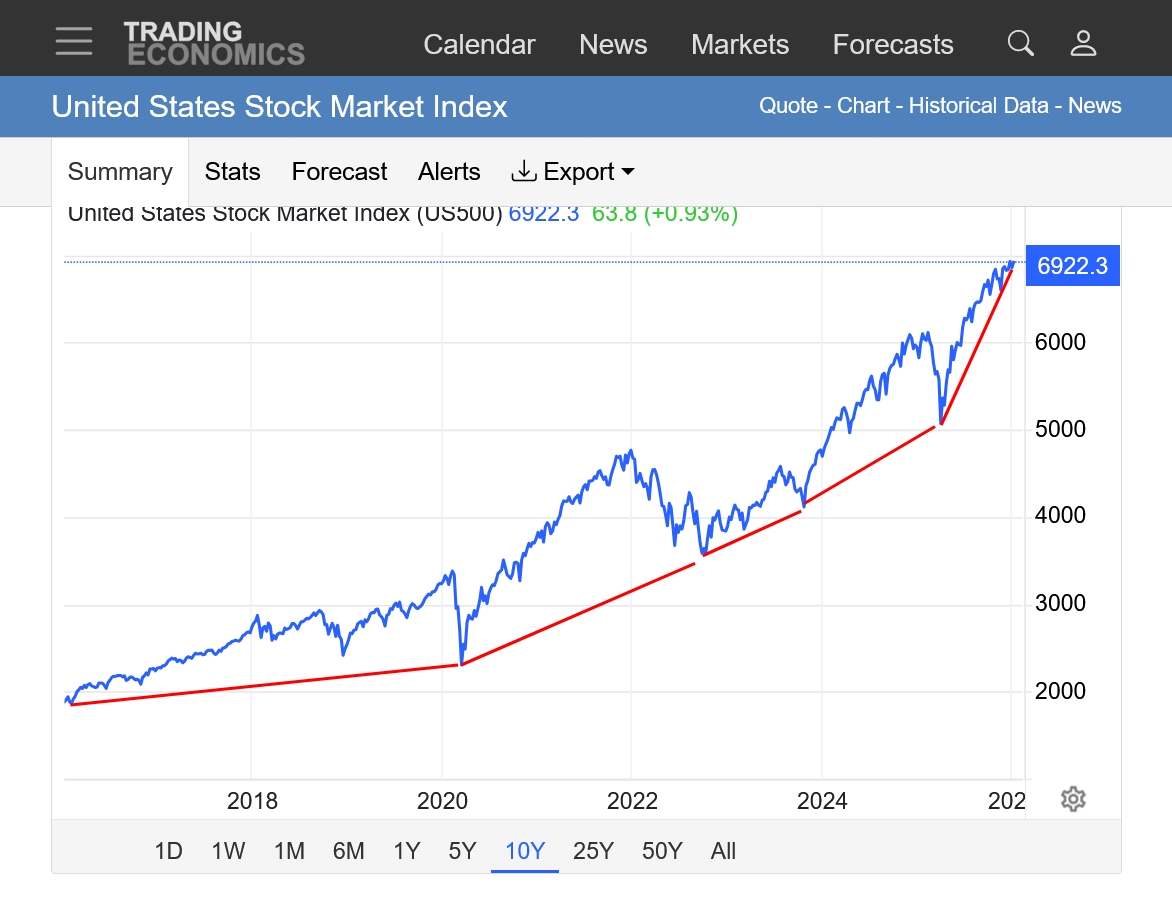
1. 10 years: Parabolic move losing steam. Still long term bull.
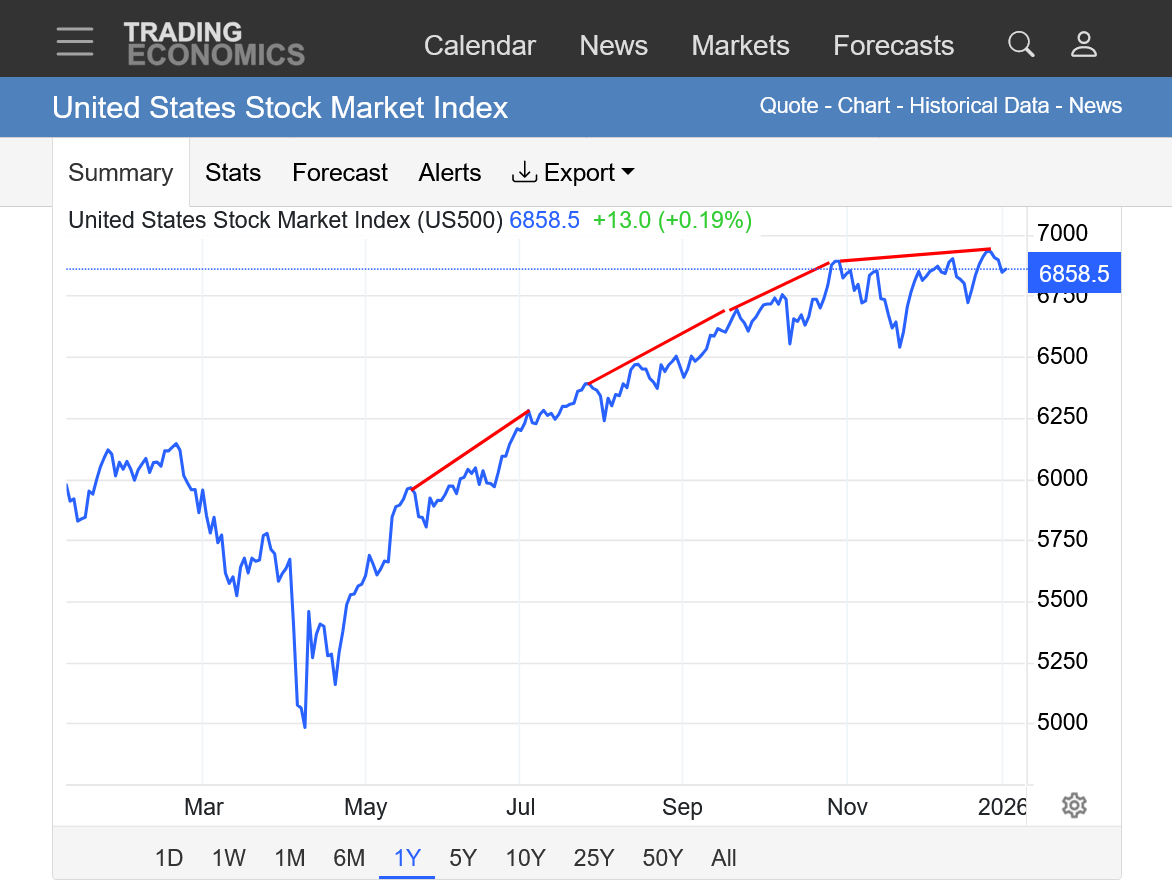
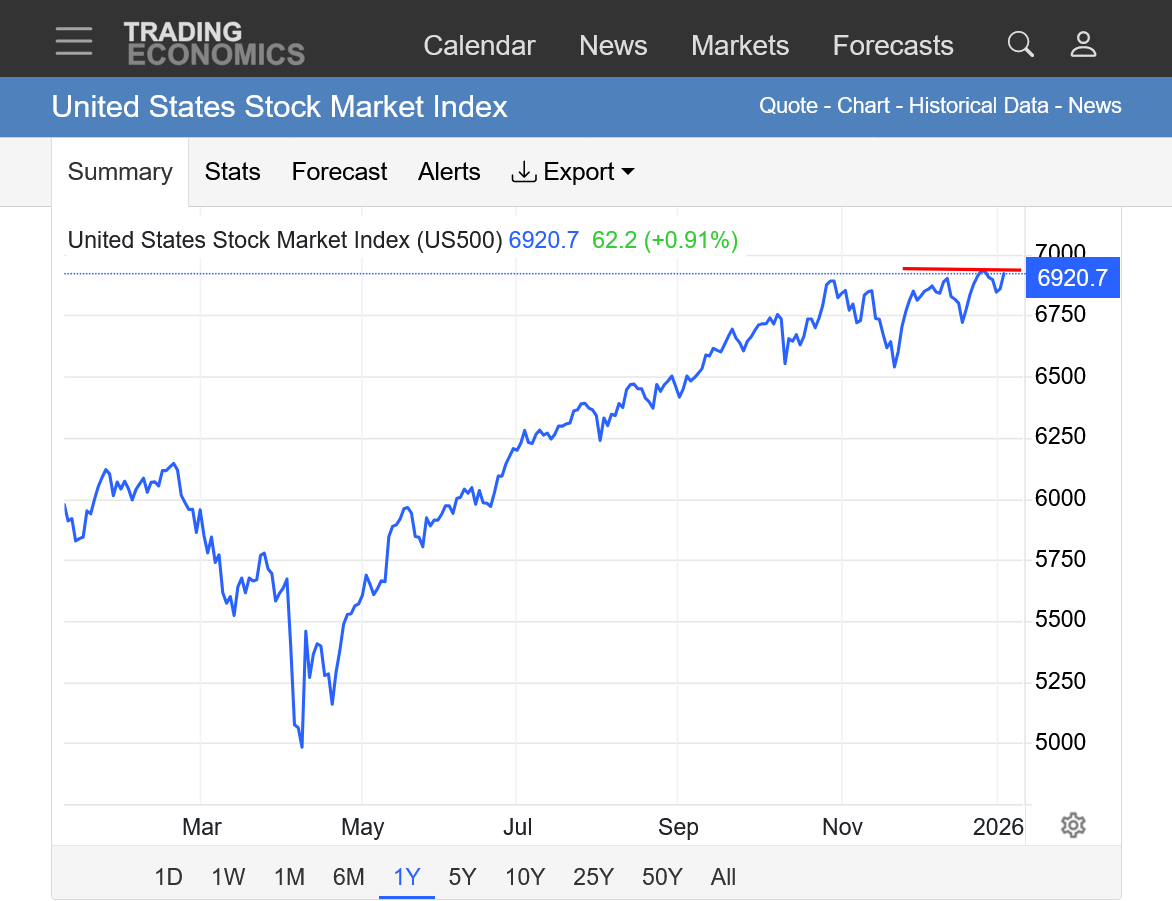
2. 1 year: Rounding top. Below November highs. Bulls running out of steam.
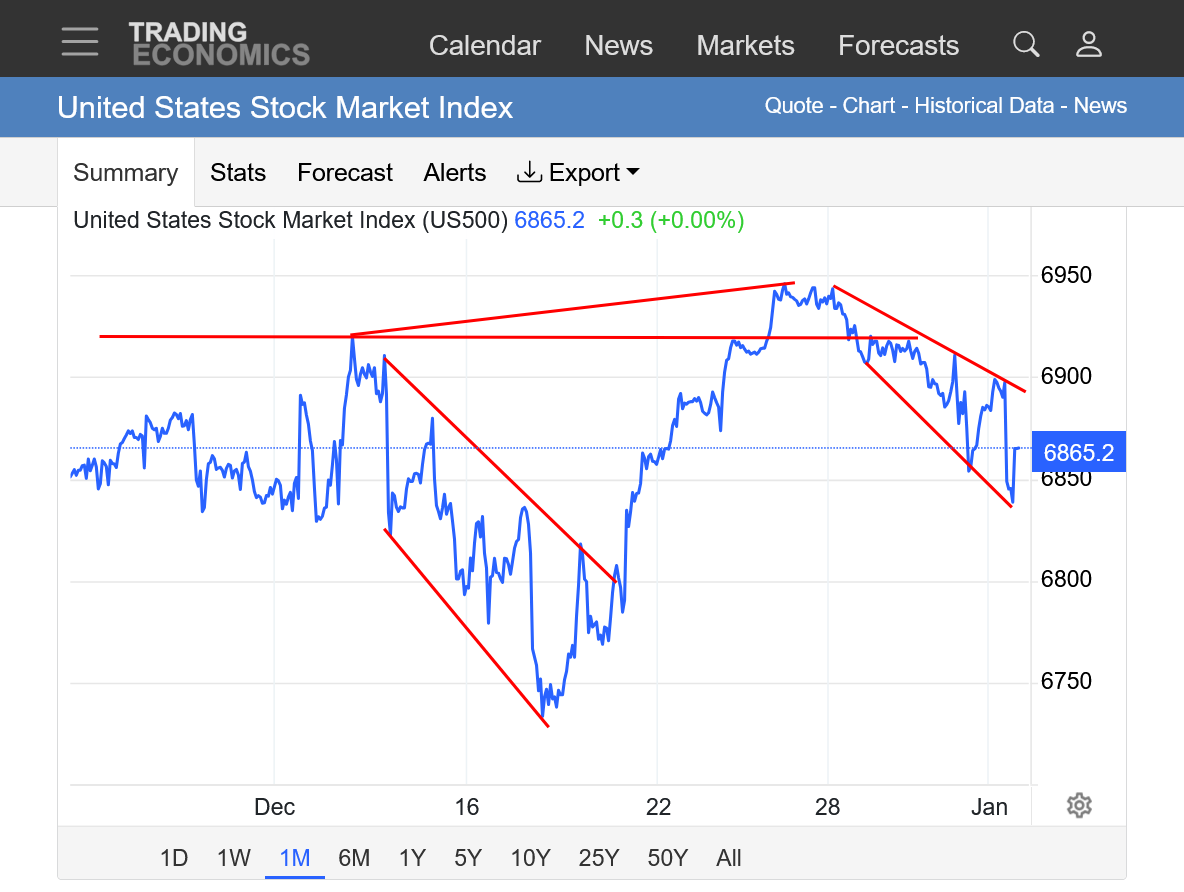
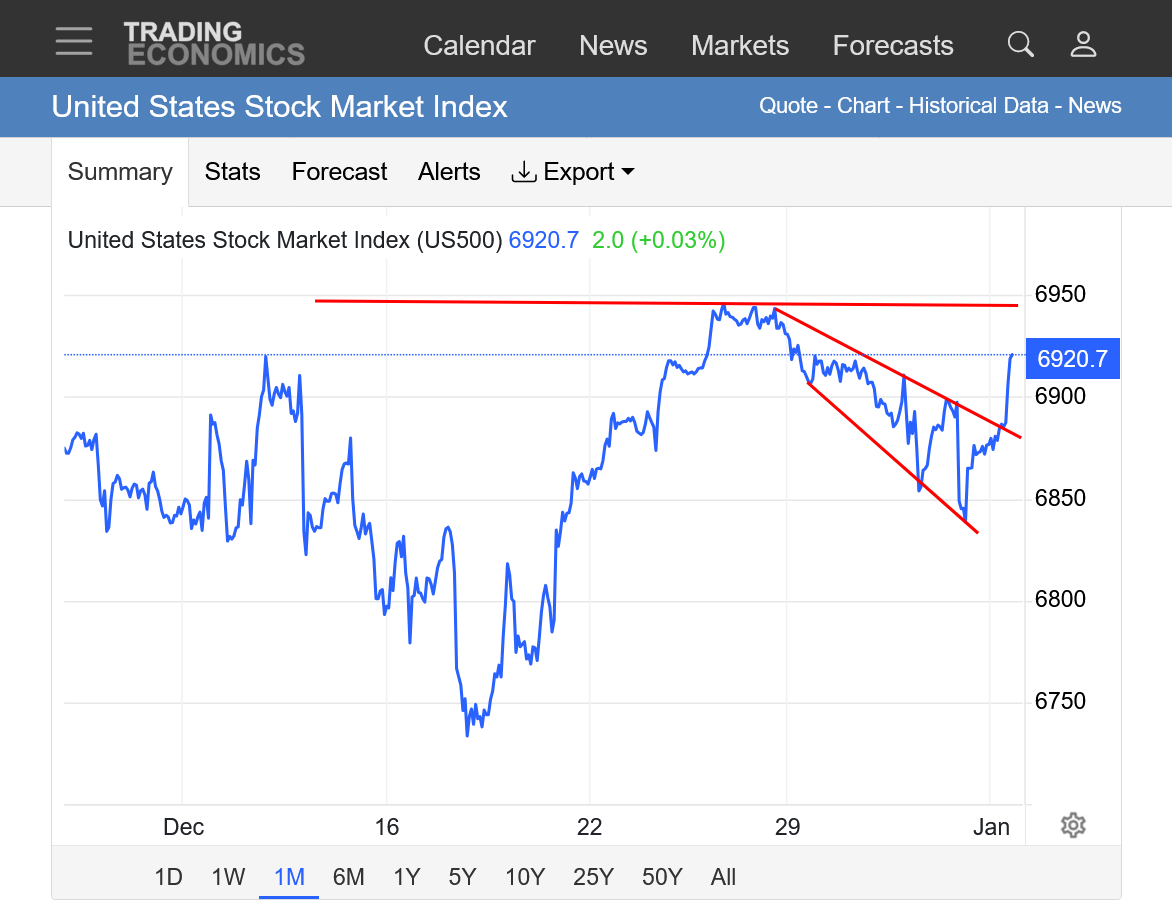
3. 1 month: Top or another bull flag?
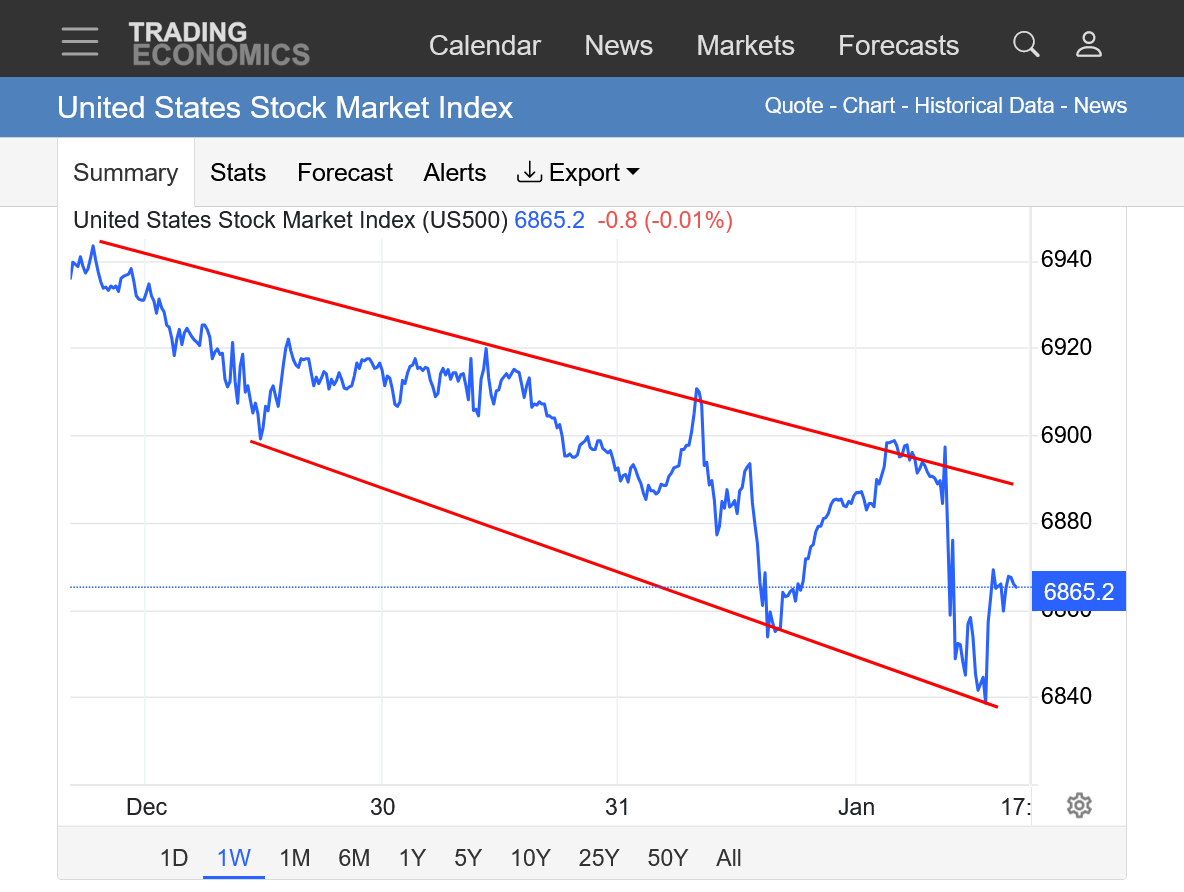
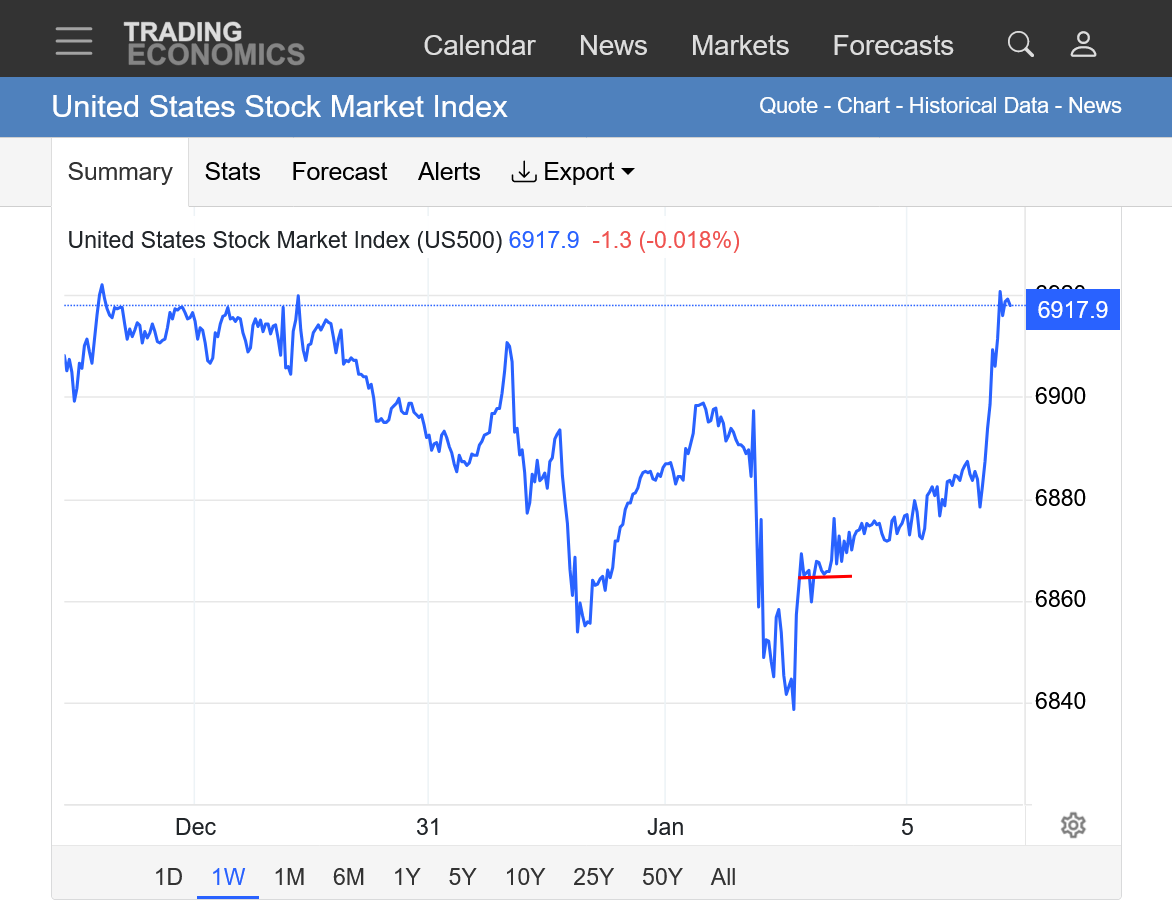
4. 1 week: Down trending channel.
+++++++++++++++++++++++
Re: Re: Trump's Influence on Markets/Economy
By metmike - Dec. 27, 2025, 1:46 a.m.
Rounding top formations in the stock market indices at several time frames. Losing momentum! I have never traded stock indices and this is NOT a prediction of THE top. Just a pattern recognition post based on the signatures right now. I can only draw straight lines on these price charts and not curved/oval lines/half circles to illustrate the rounding tops appropriately.
Basically, in a rounding top, the slope up the uptrend becomes flatter and flatter, with new highs being set by smaller and smaller increases above the previous new highs.
Then, after the top there is a downtrend that starts with a very mild/modest slope.
https://www.ebc.com/forex/rounding-top-pattern-explained-how-to-spot-market-reversals

The rich and powerful people's in the rich people's Ponzi Scheme are giving Donald Trump a standing ovation on the first trading day after he kidnapped the leader of the country with the most oil reserves in the world to take it over using a ruse in order to get the oil.
This continues to also be a self fulfilling prophesy as explained in the post below:
By metmike - July 31, 2025, 4:39 p.m.
++++++++++++++++++
This is just 1 stock market price index below. Some are setting all time highs today!
https://tradingeconomics.com/united-states/stock-market
1. 1 week Open on Sunday Night at red line. Way to go Donald Trump says the stock market!
2 1 month: Breaking out of another bull flag? Still below the December highs
3. 1 year: Still below the highs with a rounding top formation still valid/possible. This would be violated if the stock market experiences an enormous rally that decisively takes out the previous highs...........like it has done umpteen times before. .........and could do again here for many of the same reasons.
4. 10 years: The long term trend is a still solid UP and this could have been just another bull flag, despite the parabolic part of the move losing momentum as the uptrend decelerates.
Hi friends now Columbia Mexico Cuba and Iran attacks are coming what your take and impact on the market--
Wonderful question, fayq!
The stock market and metals markets are telling us this is bullish today.
At some point, however it will backfire badly, in my opinion, market impacts then could go the other way if/when Donald Trump is impeached.
Trump gets Maduro
27 responses |
Started by mcfarm - Jan. 3, 2026, 9:47 a.m.
Most of the major stock indices have smashed thru previous record highs. Not sure why the free one that I use here(which is sometimes flawed) is lagging but it too is breaking out to the upside.
I can usually note the flaws and the charts, in the vast majority of cases depict the relevant chart patterns/formations that reflect the authentic technical picture.
https://tradingeconomics.com/commodity/silver
I’ll fix the link when back in my office….sorry about that