Previous thread:
USDA September 12, 2025/Grains
78 responses |
Started by metmike - Sept. 12, 2025, 4:01 p.m.
https://www.marketforum.com/forum/topic/114629/
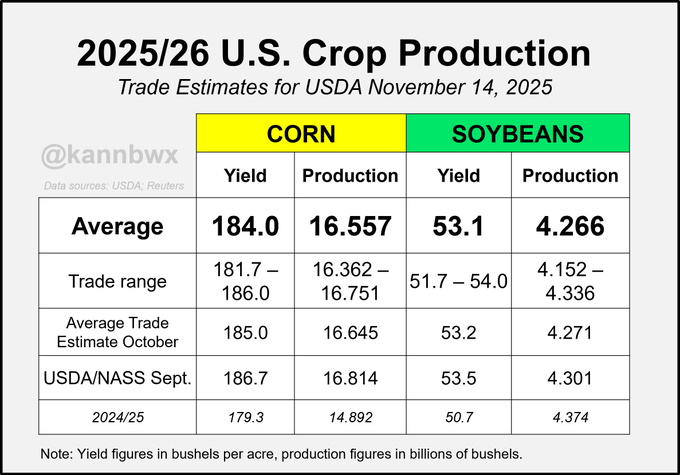
The trade is certain that U.S. corn yield will decline from the September levels on Friday, but that's not the case with soybeans (some see yield rising). Analysts peg the U.S. corn crop up 13.5% on the 5yr production average, but the soy crop is seen 0.7% below.
·
Very wide estimate ranges for U.S. corn and soybean ending stocks on Friday, driven by varying ideas of both production and demand. Just looking at the average trade guesses (i.e. they are very similar to Sept) doesn't tell the whole story.
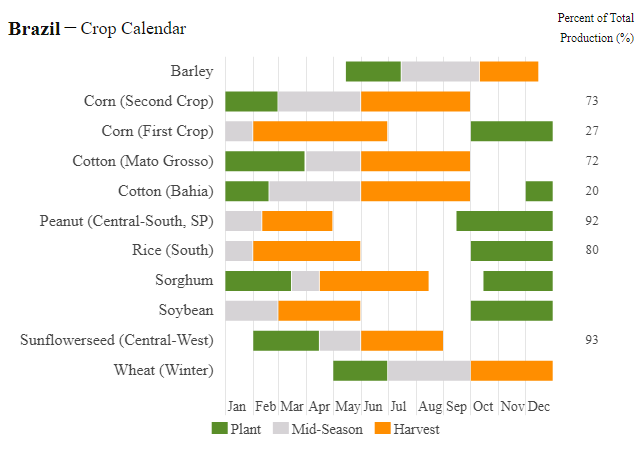
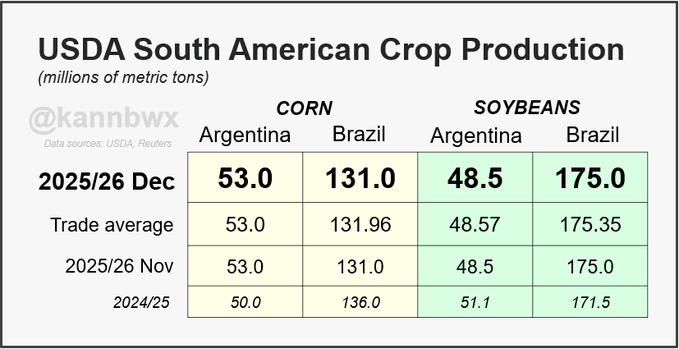
Conab updated Brazilian S&D on Thursday - negligible changes to soy and corn. USDA is updating on Friday. Biggest diffs w/ Conab are on corn. FYI, USDA's last estimates (mmt): 24/25 corn - 135 24/25 beans - 169 25/26 corn - 131 25/26 beans - 175
South America weather matters big now.
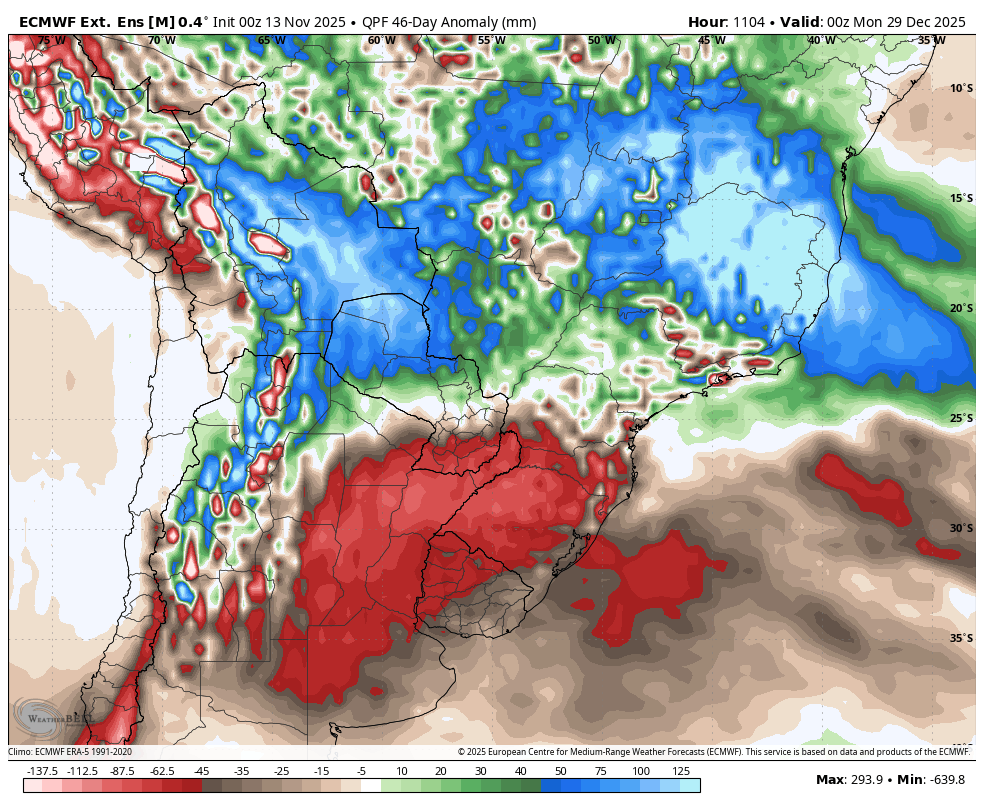
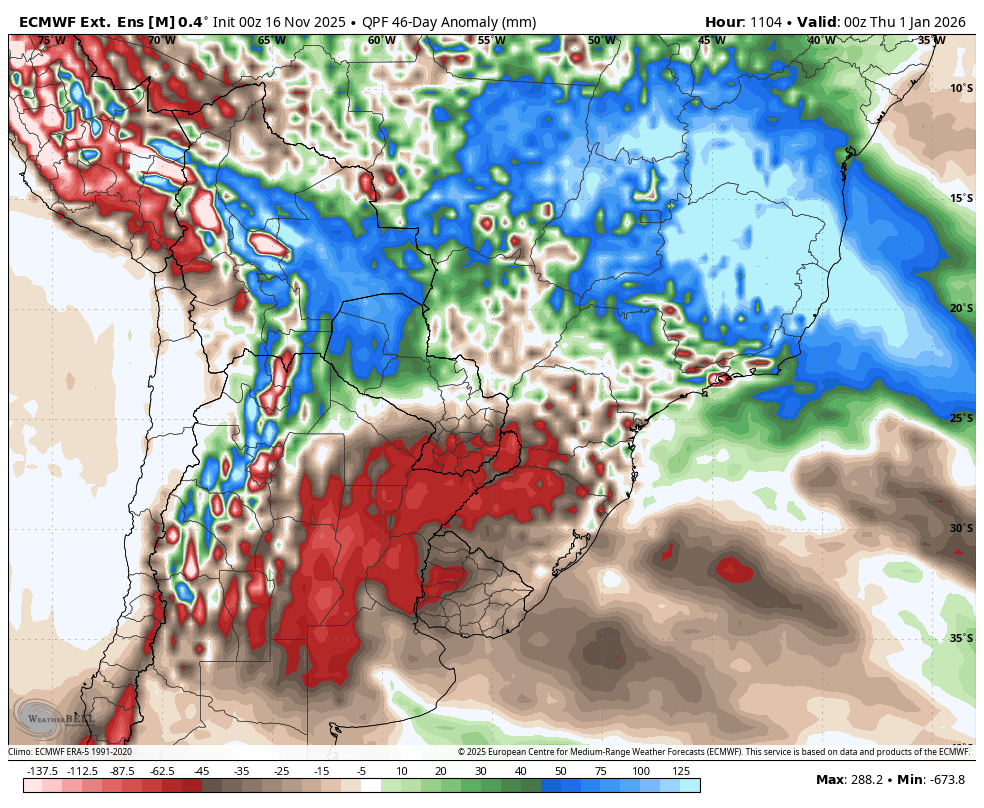
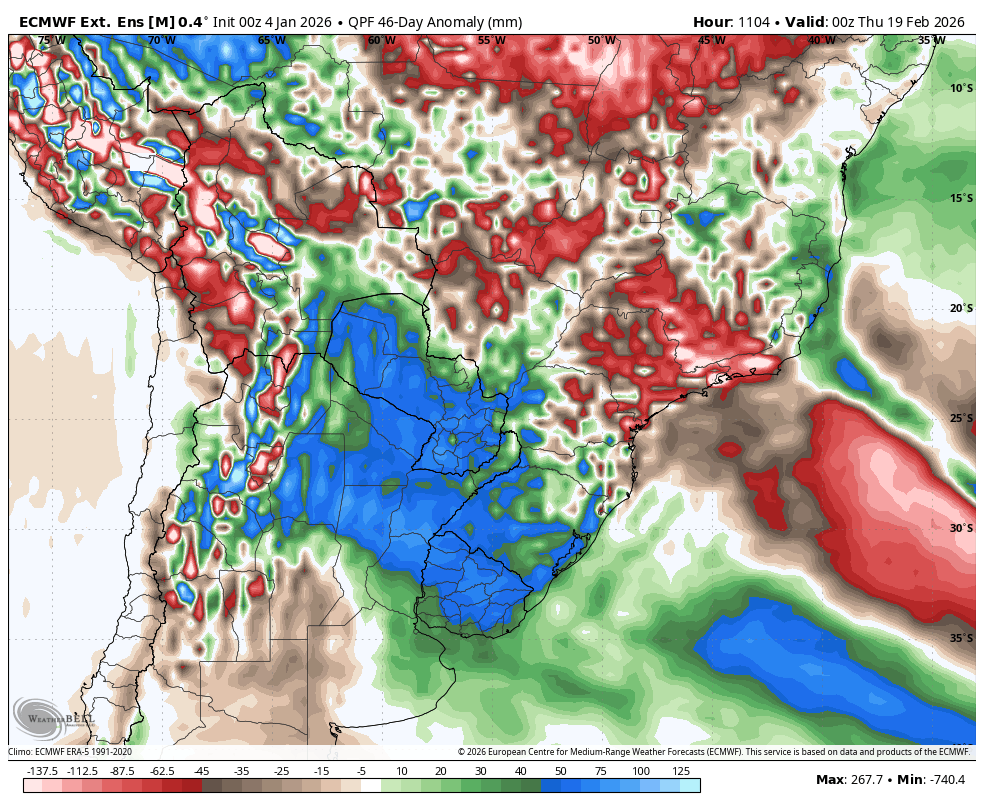
I just checked the long range forecast for the next 46 days from the European model Weeklies. Holy Cow!!!
This model has a drought in Argentina and S. Brazil. Maybe this is part of why the beans shot higher a few weeks ago?
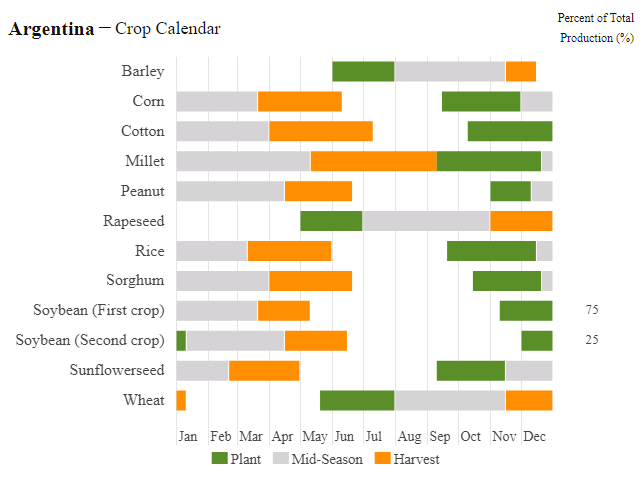
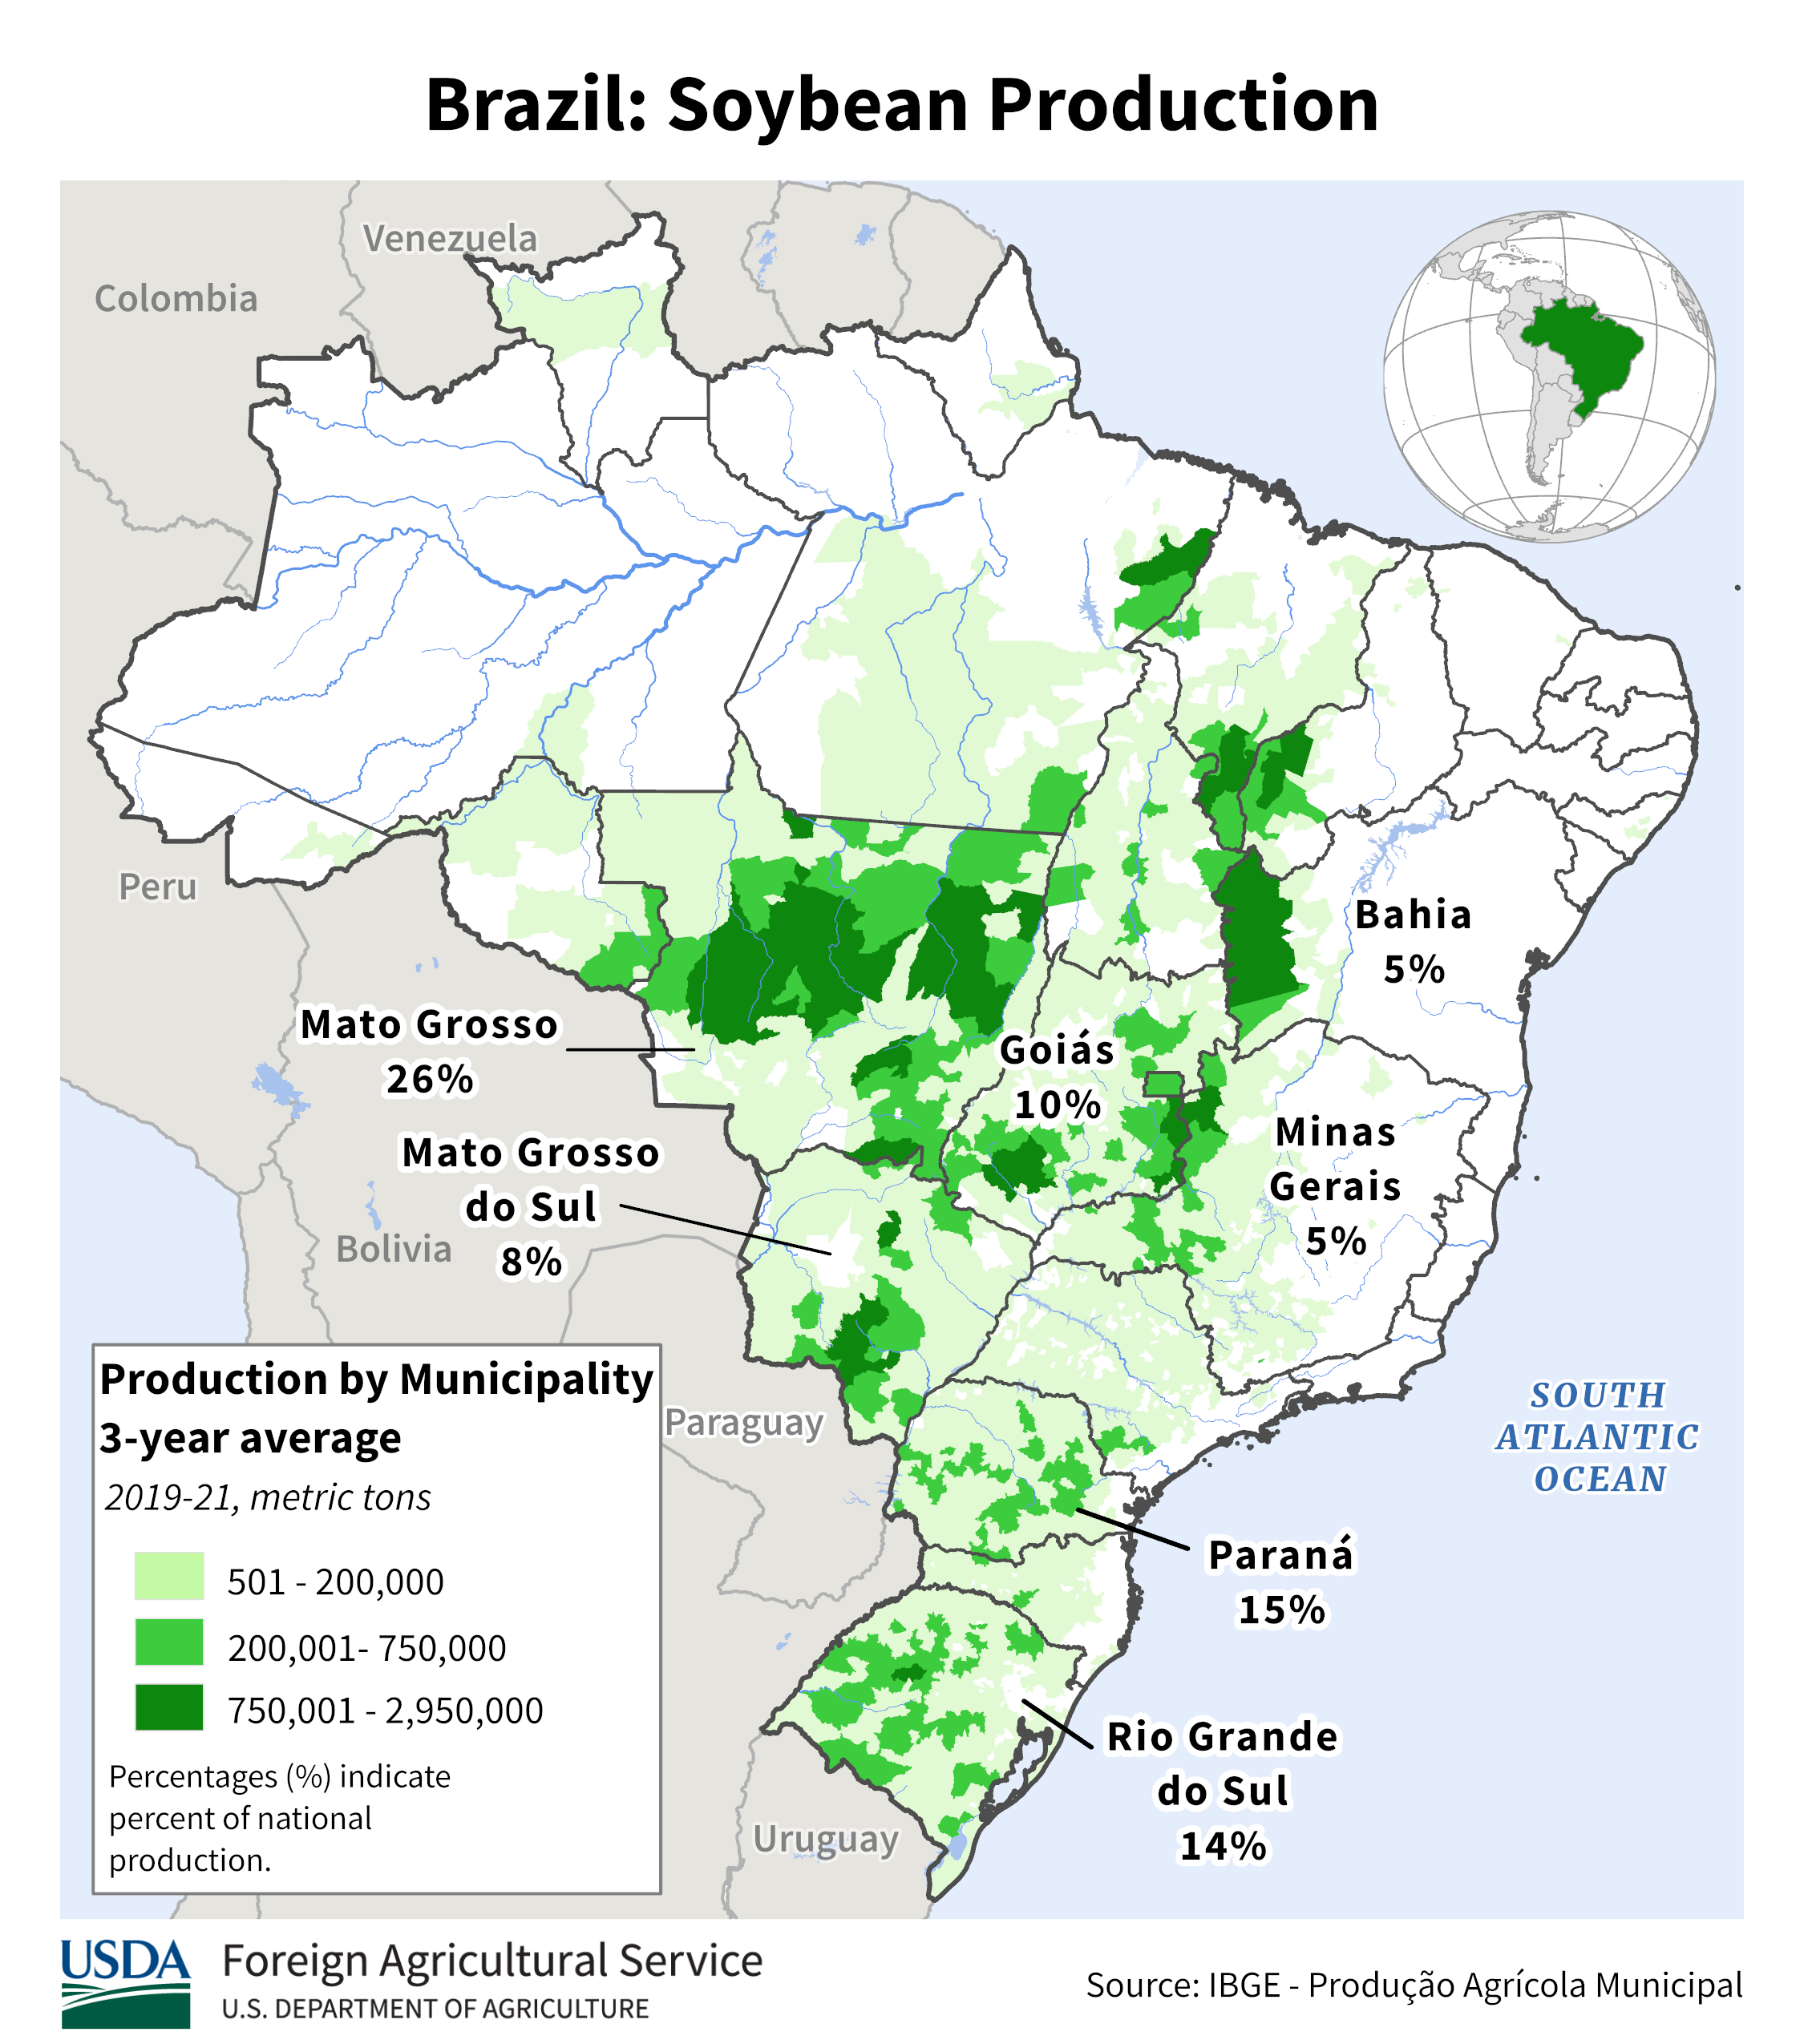
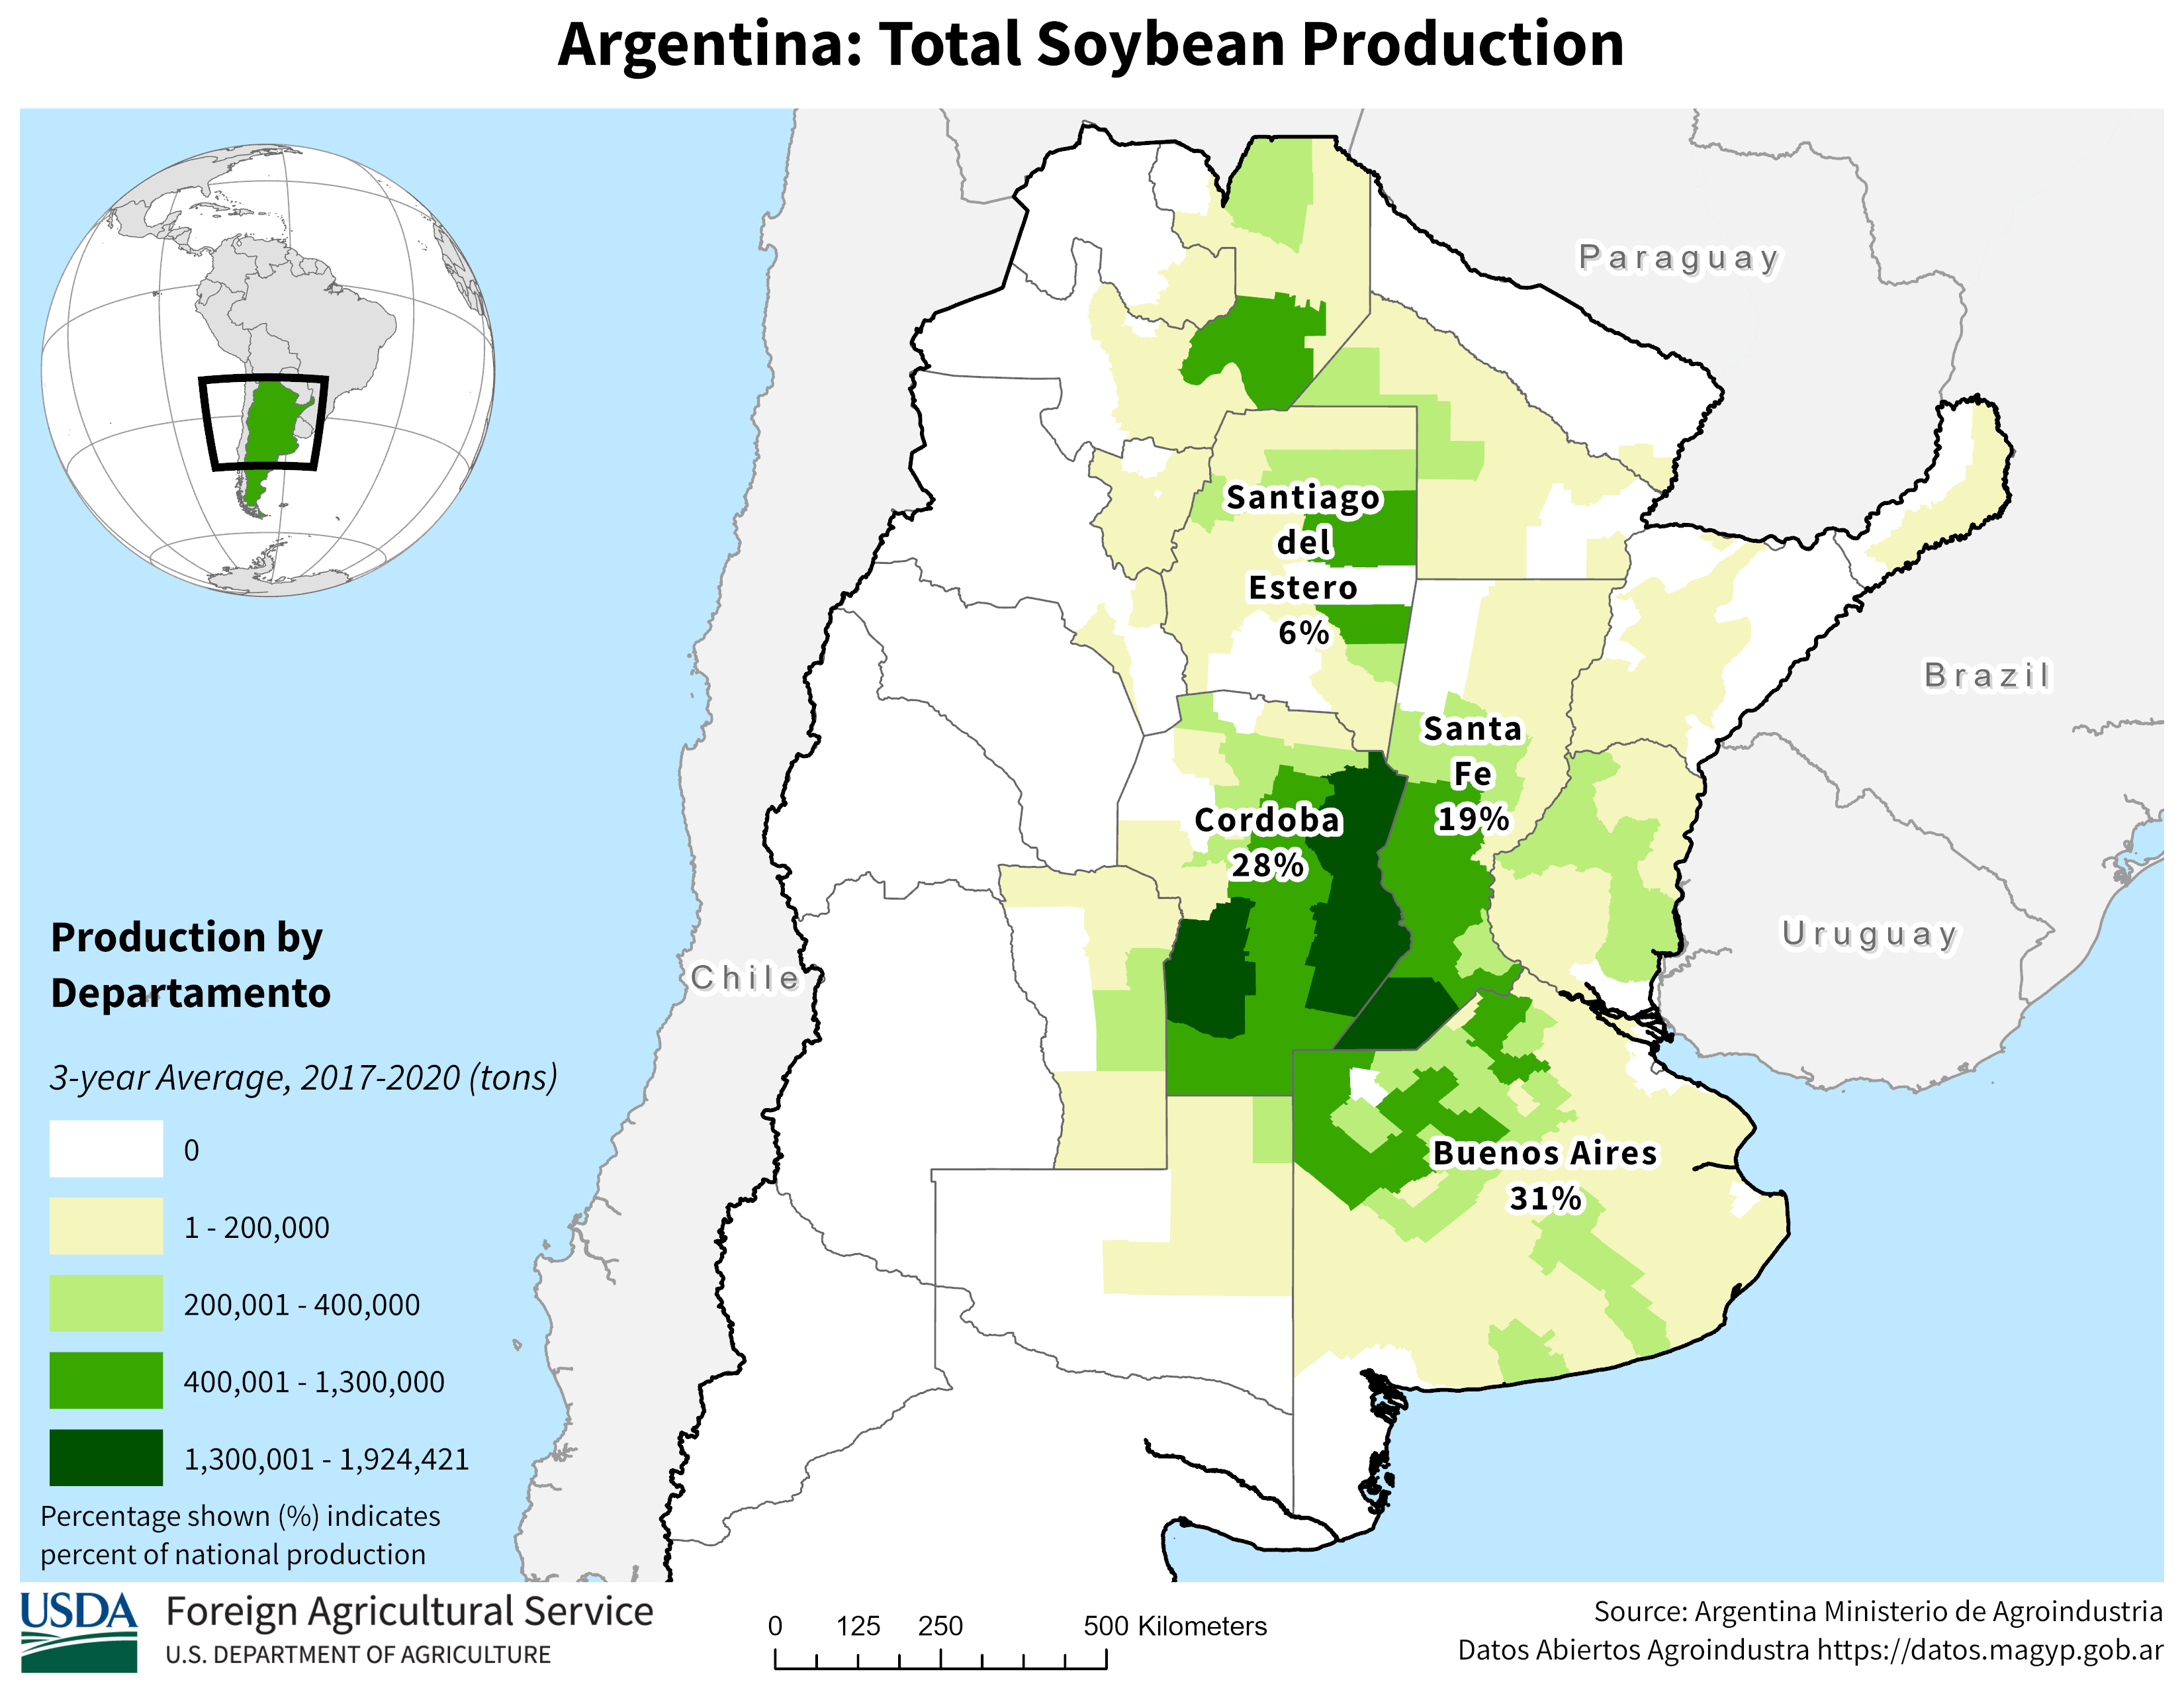
This forecast has most of the Argentina crop at high risk of severe drought and around 20-25% of the Brazil crop in the south. Beans have clearly made MAJOR lows but this could really launch prices higher.
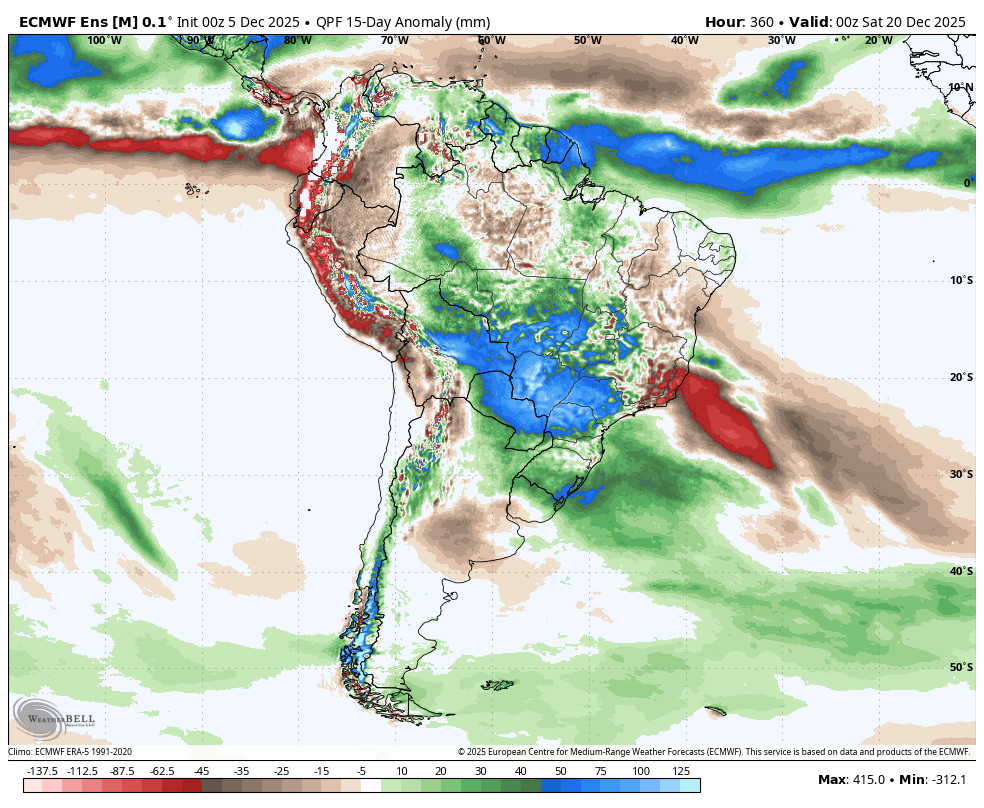
The map below is CUMULATIVE rain anomalies or the next 46 days.
https://ipad.fas.usda.gov/countrysummary/default.aspx?id=BR
https://ipad.fas.usda.gov/rssiws/al/crop_production_maps/Brazil/Municipality/Brazil_Soybean.png

https://ipad.fas.usda.gov/countrysummary/default.aspx?id=AR

Recent rains in South America. It's been dry in Brazil but their rainy season(monsoon) usually kicks in right around now. Argentina looks ok from what I can tell.
https://www.cpc.ncep.noaa.gov/products/Precip_Monitoring/Figures/global/n.30day.figb.gif

https://www.cpc.ncep.noaa.gov/products/Precip_Monitoring/Figures/global/n.90day.figb.gif

https://www.cpc.ncep.noaa.gov/products/Precip_Monitoring/Figures/global/n.180day.figb.gif
The USDA WASDY report today at 11 central time
USDA Flash sales reports from during the shutdown will be released at the same time. This is what the market will be watching for Chinese business.
A lot of info in a short time, Extra volatility
opinion: someone has been buying beans, will this be a buy the roomer sell the fact. Or do we go higher???
nov beans go off the board yesterday jan beans have some carry. That could leave a gap on the continuous chart which could leave an island reversal on the chart.
Thanks, cutworm!
Clearly bearish compared to expectations!!!!
·
US corn and soybean yields come down from September, corn by less than expected.
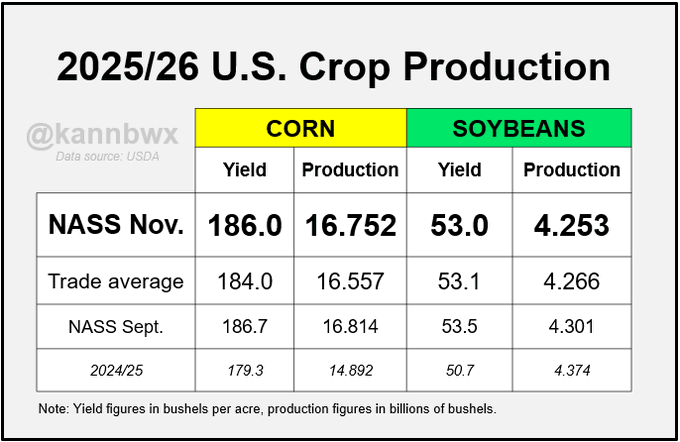
U.S. corn stocks are slightly higher than in Sept (smaller crop, bigger exports, bigger carry-in). Beans are slightly smaller - smaller crop, smaller exports, smaller carry-in).
USDA increased 24/25 Brazil and Argentina soybean production and 24/25 Brazil corn production.
I believe the huge drought for Argentina, shown above is playing a major role in the beans leaping higher today after a small gap lower open last night that was immediately filled. Beans going to China, of course are the main headlines.
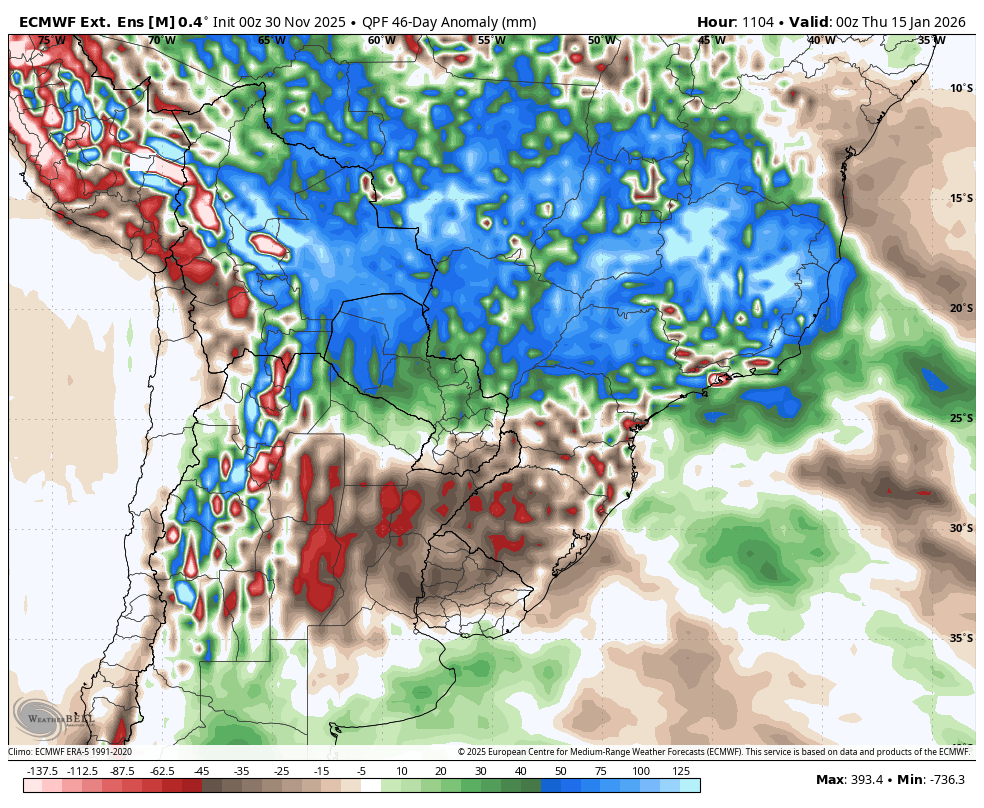
1pm: This was the latest, with the updates coming in mid afternoon, the one for today not out yet.
These are the total rain anomalies between now and January 1, 2026 from the European Ensemble weeklies.
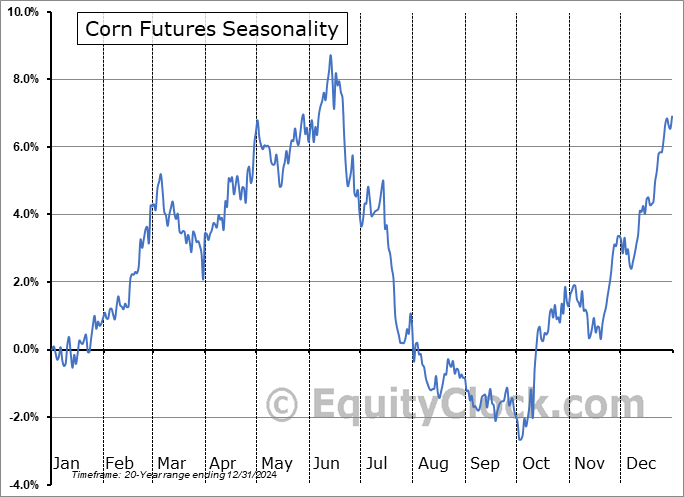
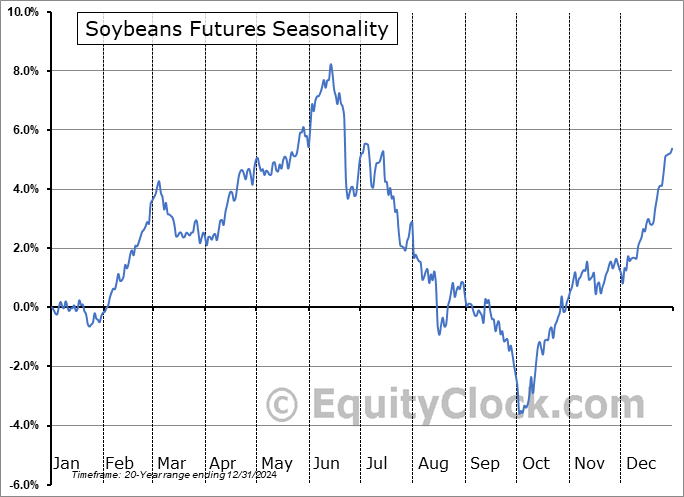
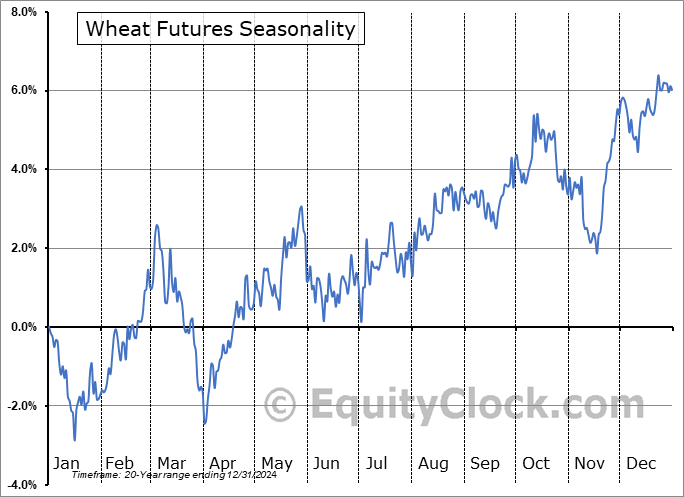
Seasonals are VERY strong this time of year, recovering from harvest spike lows typically.
https://equityclock.com/seasonality/
https://equityclock.com/charts/
https://charts.equityclock.com/corn-futures-c-seasonal-chart
https://charts.equityclock.com/soybeans-futures-s-seasonal-chart
https://charts.equityclock.com/wheat-futures-w-seasonal-chart
+++++++++++++
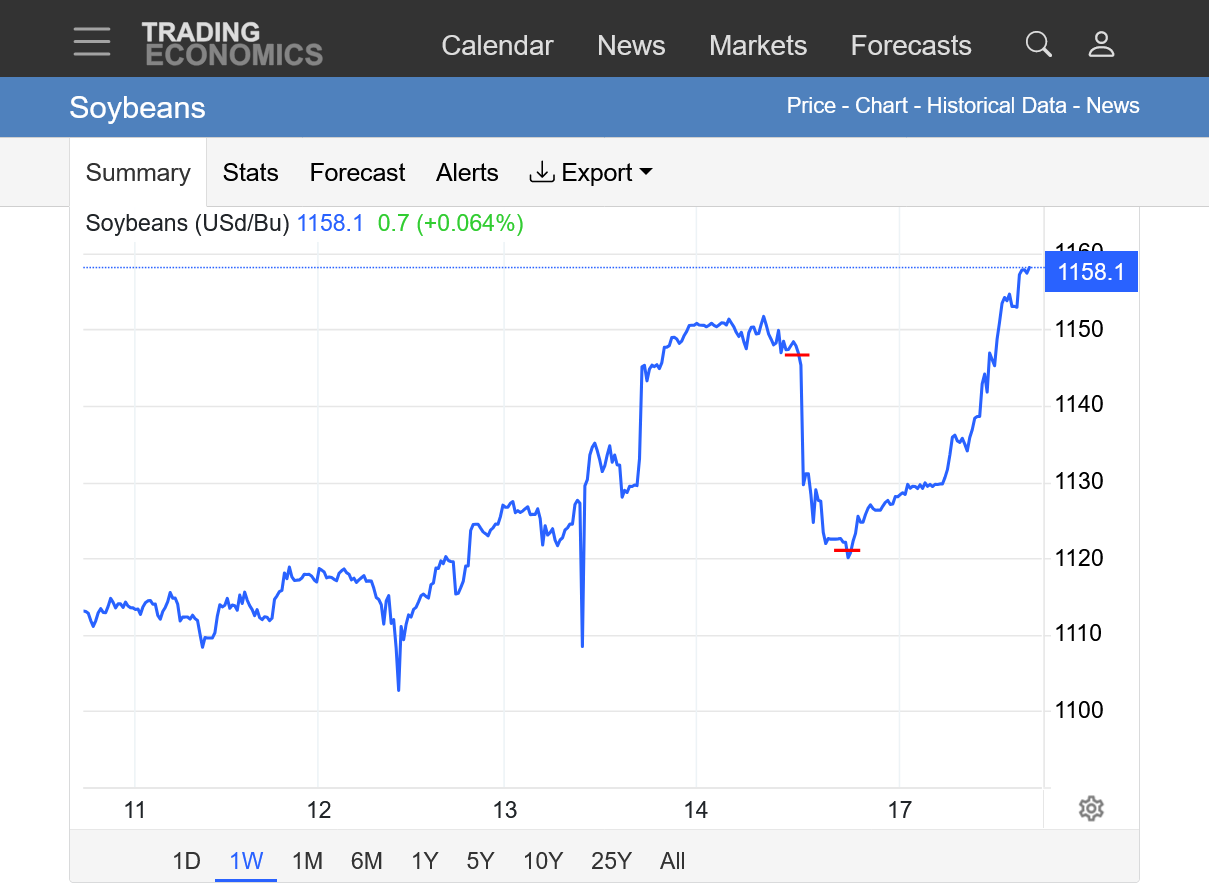
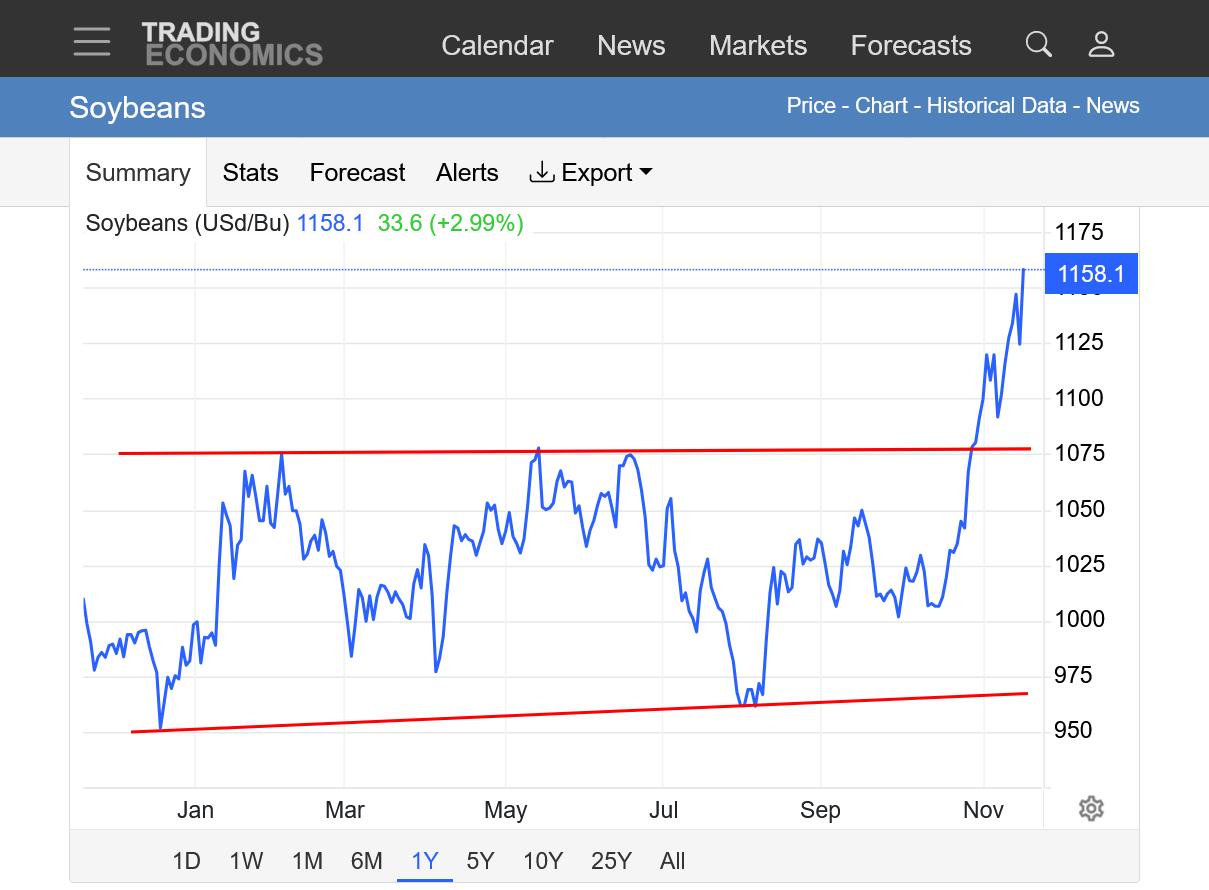
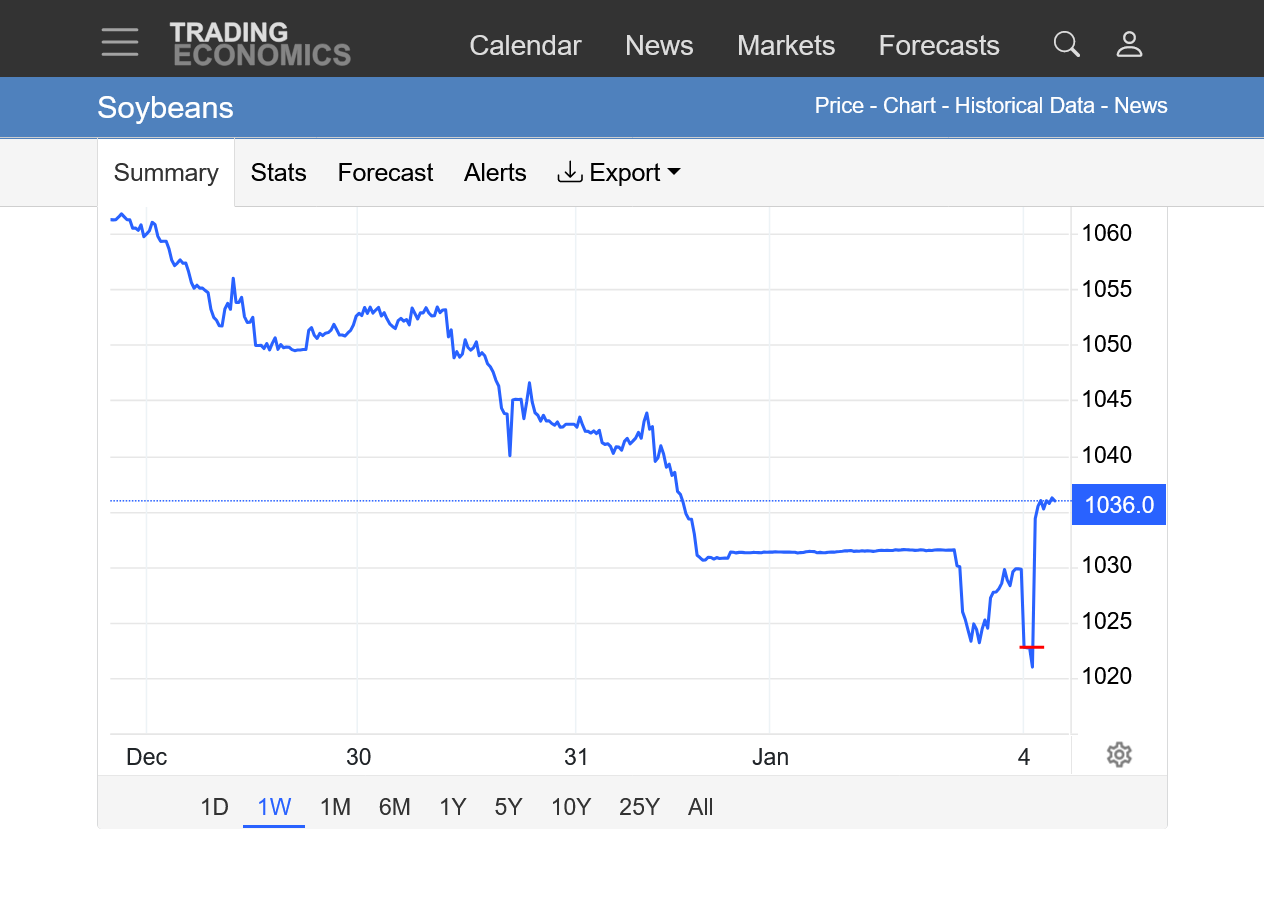
https://tradingeconomics.com/commodity/soybeans
1. 1 day: Top line was the release of the bearish USDA report on Friday. Bottom line was the Sunday night, small gap open lower. Filled and then straight up for +35c without any corrections. Now ABOVE the pre report high.
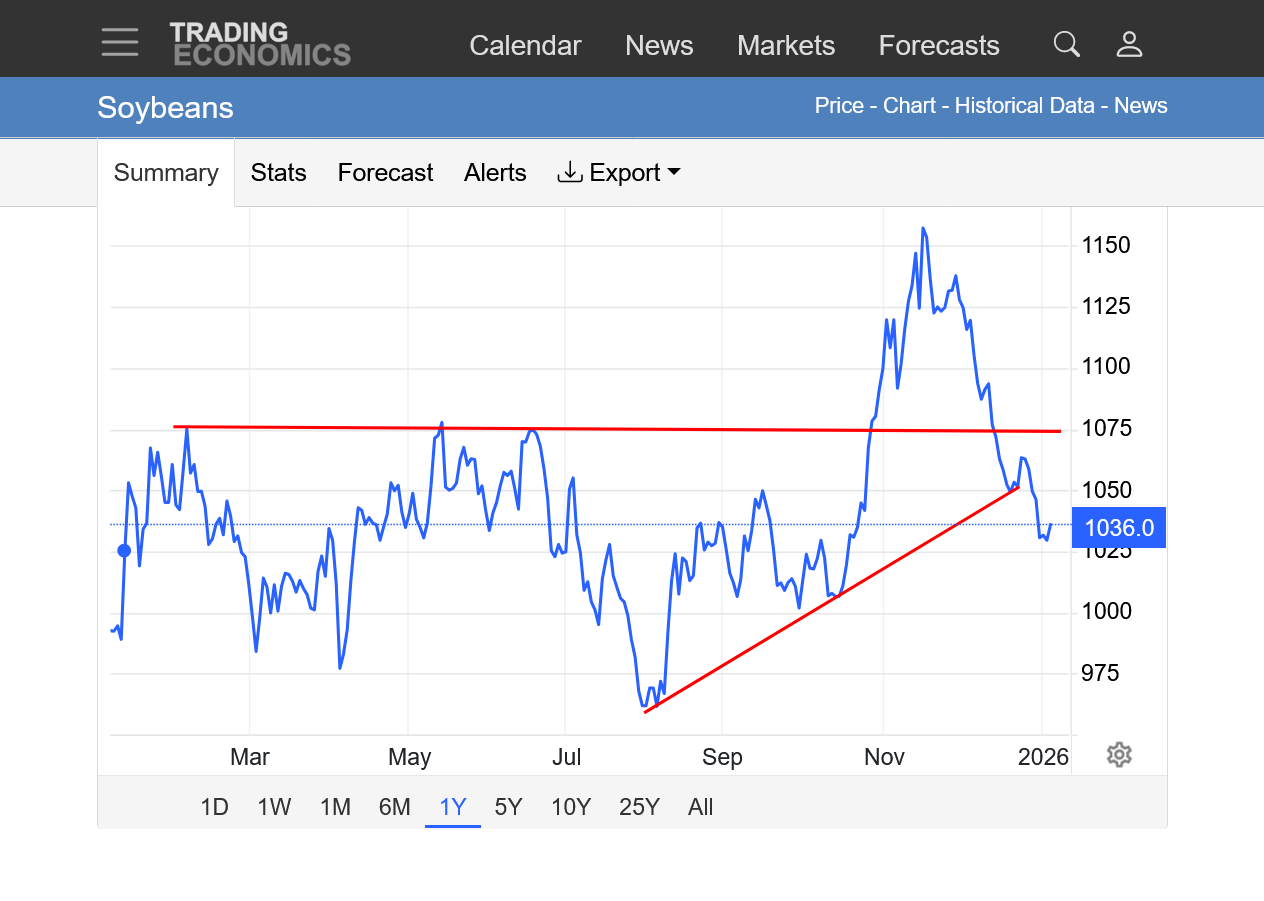
2. 1 year: Major breakout above a wedge pattern
3. 10 years: Major break out from the wedge, above long term resistance.
+++++++++++++=
The analysis from a month ago was anticipating this that included cutworm:
Re: Re: USDA September 12, 2025/Grains
By metmike - Oct. 20, 2025, 4:30 p.m.
++++++++++++++
Re: USDA September 12, 2025/Grains
By metmike - Oct. 26, 2025, 11:25 p.m.
++++++++++++
Re: Re: Re: USDA September 12, 2025/Grains
By metmike - Oct. 28, 2025, 11:39 p.m.
++++++++++++++
Re: Re: Re: Re: USDA September 12, 2025/Grains
By metmike - Oct. 30, 2025, 3:03 p.m.
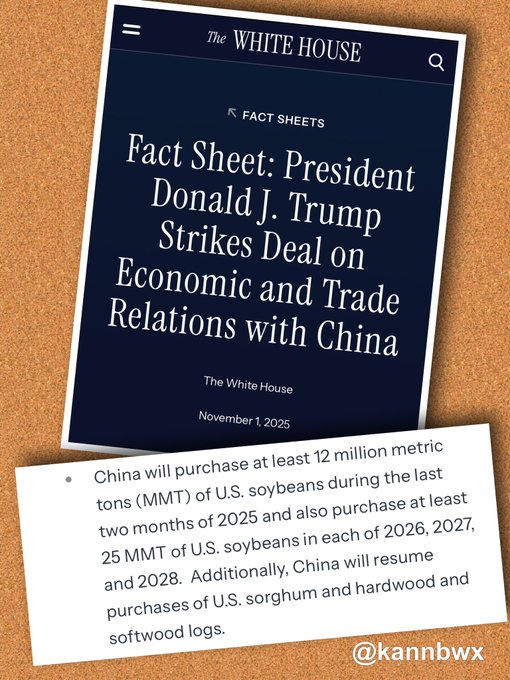
The White House's official stance is that China will book 12 mmt of U.S. soybeans in Nov-Dec. Let's be generous and say China has bought 1 mmt so far. Starting today through the end of the year (incl. holidays/wknds), China must buy 3.5-4 cargoes PER DAY to fulfill this.
++++++++++++++
This comes directly from Trump, so the complete opposite is more likely!
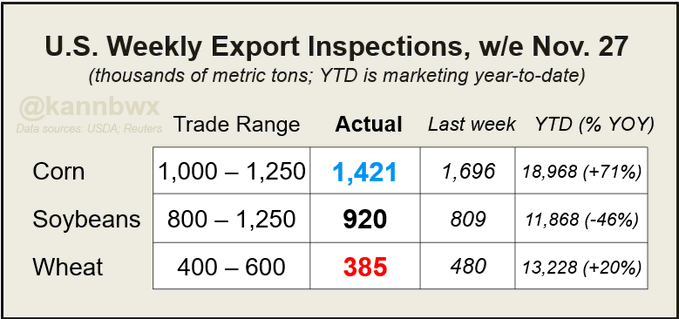
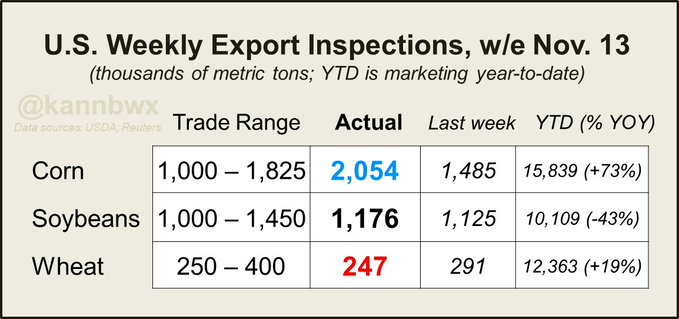
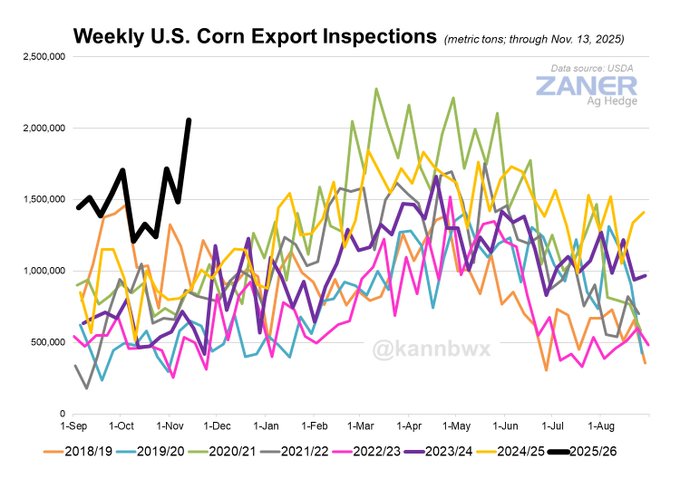
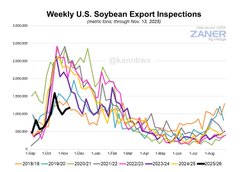
MASSIVE U.S. corn export inspections last week - according to my quick check, this is roughly the sixth best week on record since 1982. Nothing at all inspected for China, and bean inspections were down 48% from the same week last year.
Corn and beans look like they switched seasons. Over 10 mmt of beans inspected so far in 2025/26 as of Nov. 13. As of Sep. 25, total sales were at 11.9 mmt. How much of the sales ledger has been shipped so far is a mystery and will remain that way for weeks, unfortunately.
2 week rain departures from the last 12z European Ensemble model. It's still early in the growing season but the deficits include almost of of Argentina's key soybean growing areas as well as maybe, potentially 15-20% of Brazil.
This pattern is likely to continue in December from the La Nina but that can change.

https://www.youtube.com/watch?v=pAVS9TSMQM8
Thanks, Eric!
+++++++++++++
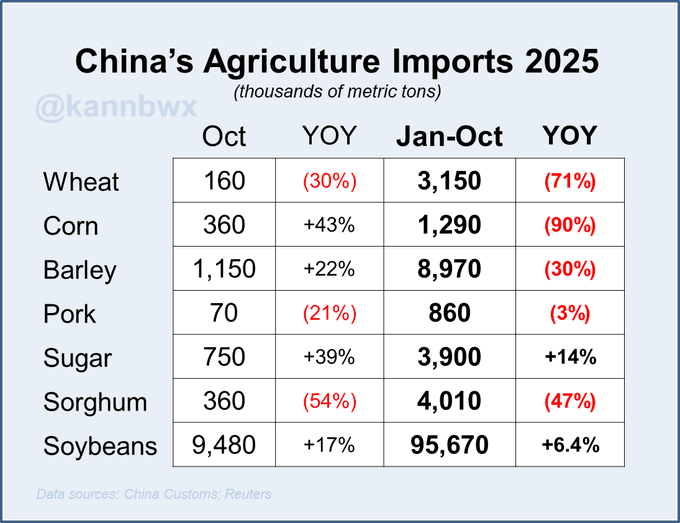
China imported more corn in Oct 2025 than Oct 2024, but YTD imports are down 90% on the year. Soybean imports are up 6.4% anchored by massive Brazilian arrivals, but most other imports - particularly grains - are down sharply from last year.
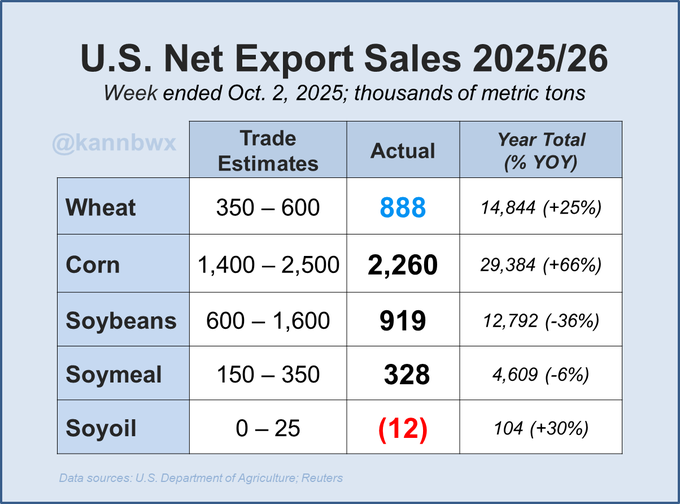
Large wheat, corn and soymeal export sales were seen in the week ended Oct. 2.
+++++++++++++++++++++
USDA confirms the sale of 462,000 metric tons of U.S. soybeans for delivery to China in 2025/26. A sale of 132,000 tons of U.S. white wheat was also confirmed for delivery to China in 2025/26.
Thanks, Matt!!!
Nov 20, 2025: TX Flood Threat | Holiday Week Cold Front | Nor'Easter? | Pacific Ridge Dominates
Eric was in with the weather today! Excellent presentation!
Great report from Eric today!
·
Last week's U.S. corn export inspections were the week's best in well over 30 years, but soybean inspections were among the lowest in 20 years. Wheat topped trade expectations. Still no cargoes of any kind inspected for China.
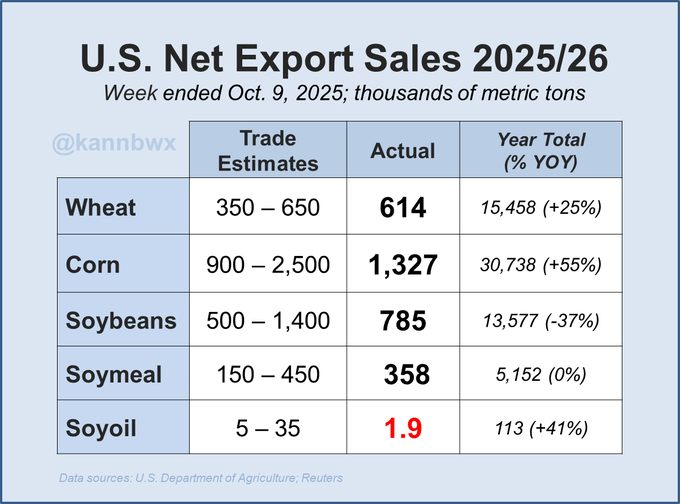
U.S. export sales in the week ended Oct. 9 were mostly as expected. Corn sales were above the week's average but much below the year-ago levels. Soybean sales were less than half of the avg/year-ago levels, still no China by this point.
The weather in South America is bearish grains/beans, especially in #1 soybean producer Brazil.
These are total rains the next 2 weeks from the last 0z European Ensemble model. The dryness in Argentina is actually much LESS dry than previous forecasts:

This was the longer range, 46 day forecast:
We are hitting increasingly important times frames in their growing season. This would be BULLISH(still is potentially) for Argentina because of the rainfall deficits, especially in red but its not AS dry as previous forecasts. This is in response to the strengthening La Nina. If it verifies, in January, the crops in Argentina will be needed rain pretty badly
Compare that to the same forecast 2 weeks ago seen below.
Not AS bullish above with the latest prediction into mid January.

Again, this is where they grow soybeans. Rio Grande de Sul in S.Brazil is likely to experience dryness along with N.Argentina.
U.S. soybean export inspections met expectations but were the week's lowest in 18 years. Once again, zero China-bound soy vessels. Corn inspections topped all estimates and were the week's best in 18 years.
Eric was in with our weather this morning! Awesome video as usual!
Matt was in with our awesome agriculture weather today!
https://www.youtube.com/watch?v=jZ10o_3tTF4
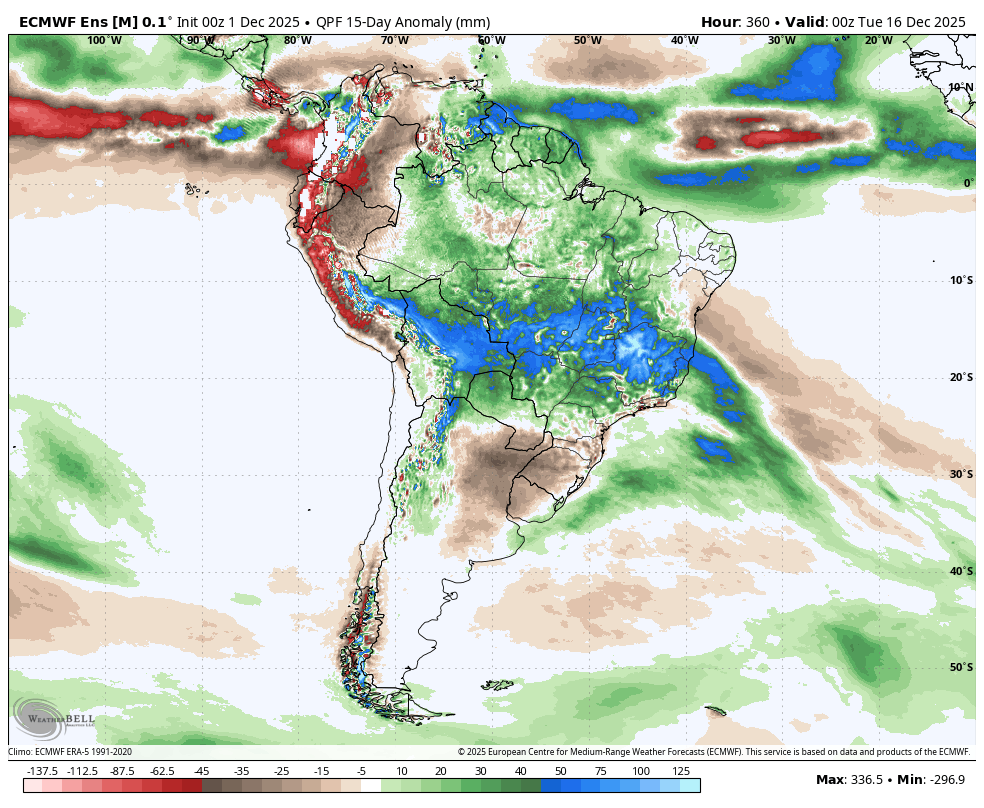
The South American weather has turned pretty bearish for the soybeans.
These were the 2 week rain totals from the last 0z European Ensemble model.
++++++++++++++++++++==
This was the same forecast to start this week, December 1:
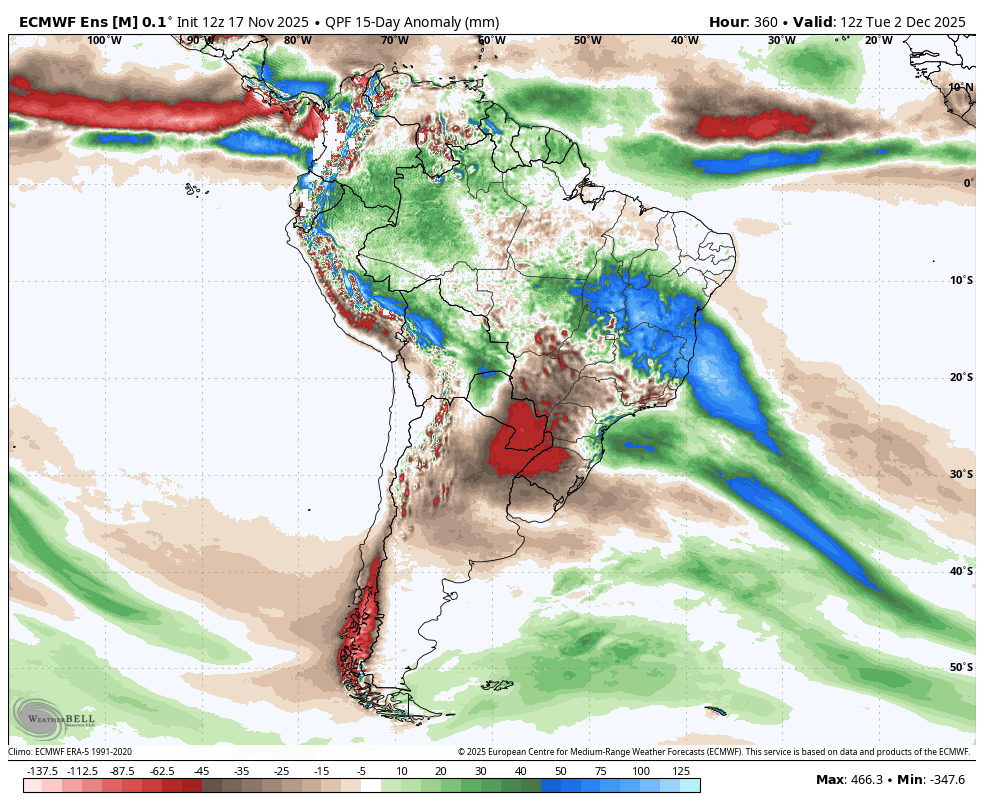
++++++++++++++++++++
This was the 2 week forecast on November 17:
Eric was in with the weather on Friday:
wait another 20-30 minutes(8pm cst)--then place buy stop at overnight high
Thanks, tjc!
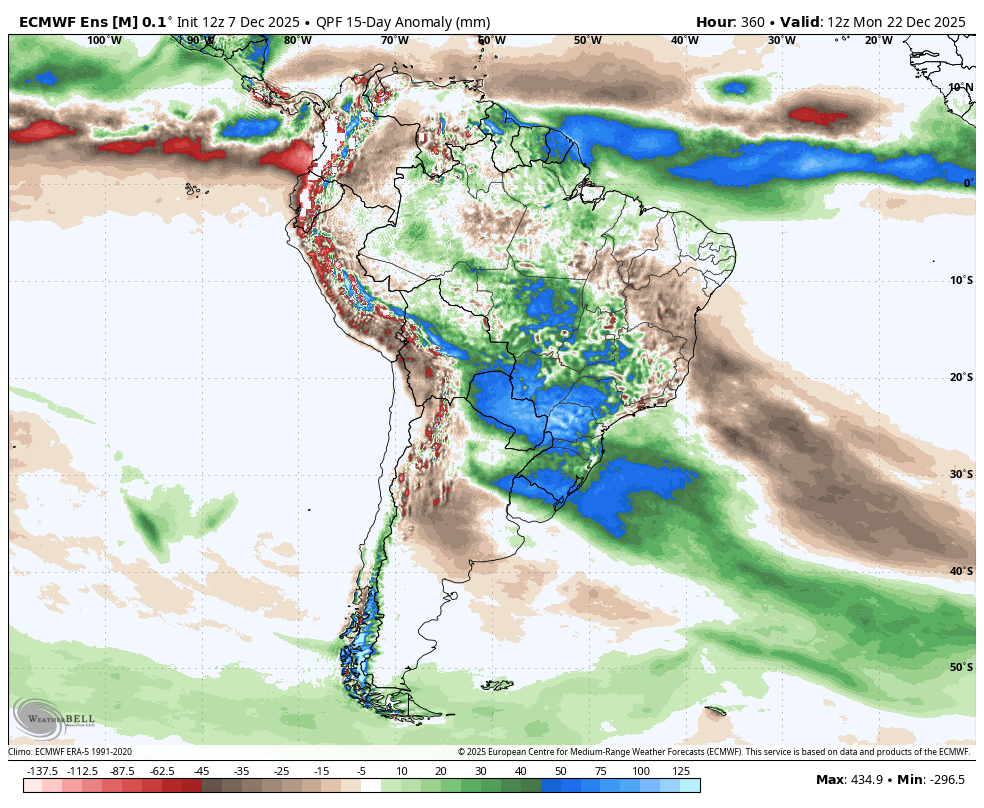
The 2 week weather forecast in SA continues to morph more bearish! This was the last 12z European Ensemble model total rains.
This is a major factor but there are other important ones, like how much China will buy and others.
These below were total rain departures from the EE model going out thru mid January. Still dry in Argentina but not AS dry as forecasts in previous weeks and Brazil is in line for huge rains.
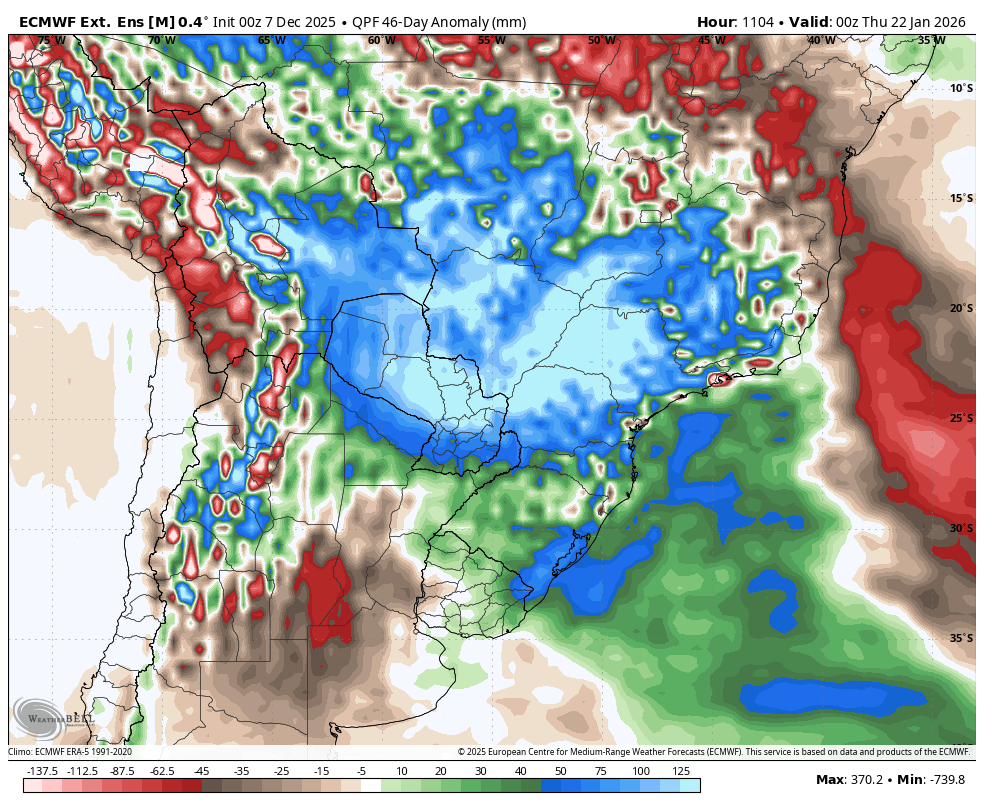
Weather forecasts have continued to get wetter the past month to erase the expected La Nina induced drought FORECAST in Argentina and southern Brazil the market was trading in November.
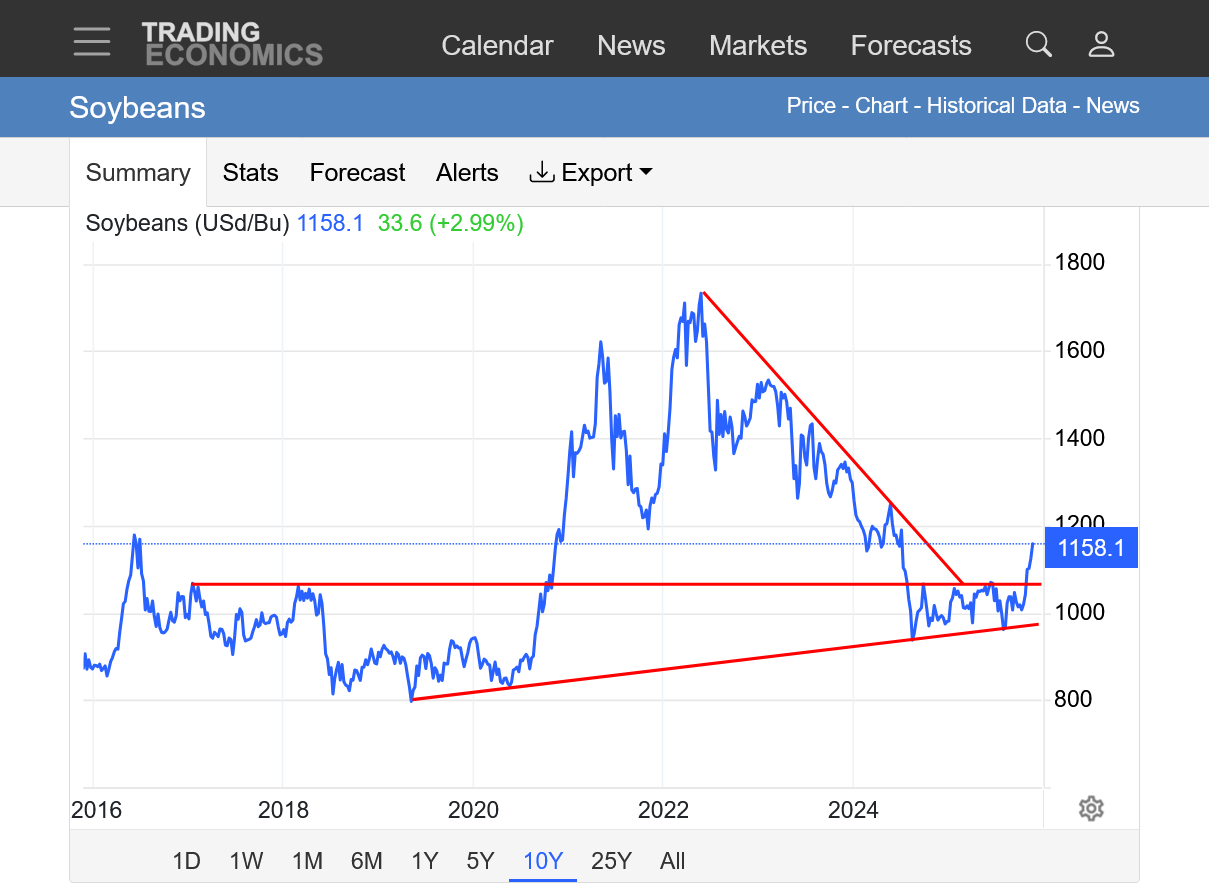
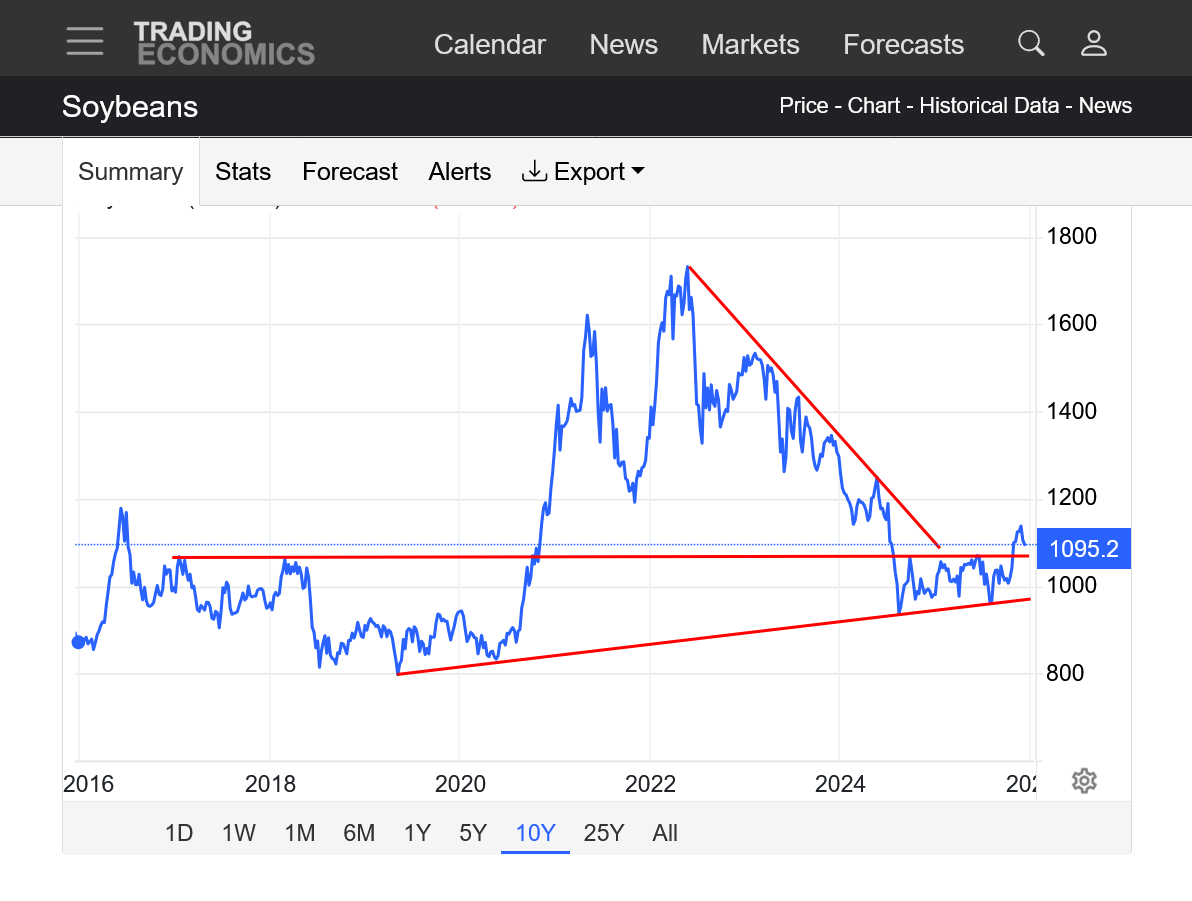
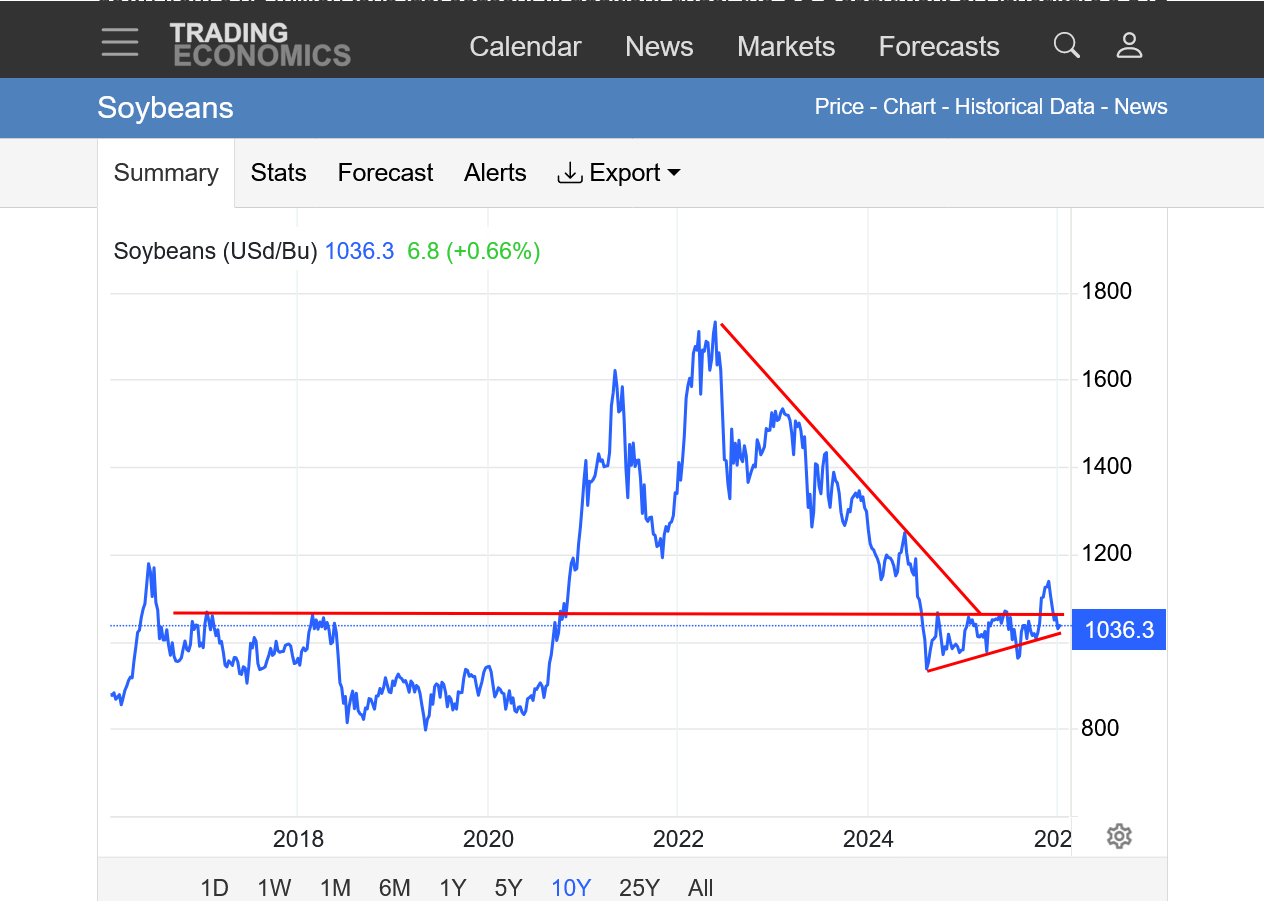
https://tradingeconomics.com/commodity/soybeans
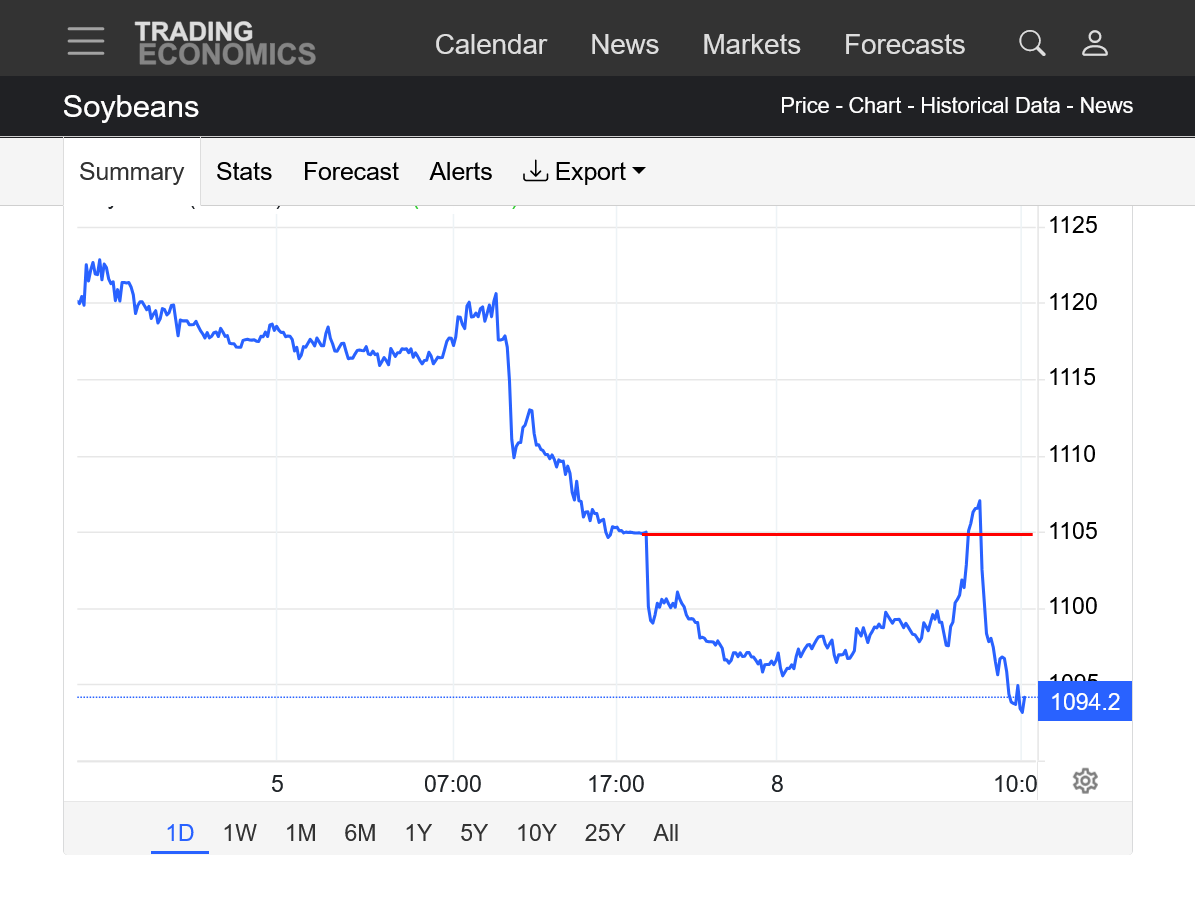
1. 1 day. Red line was the open Sunday Evening. We spiked above that just before the day session open.
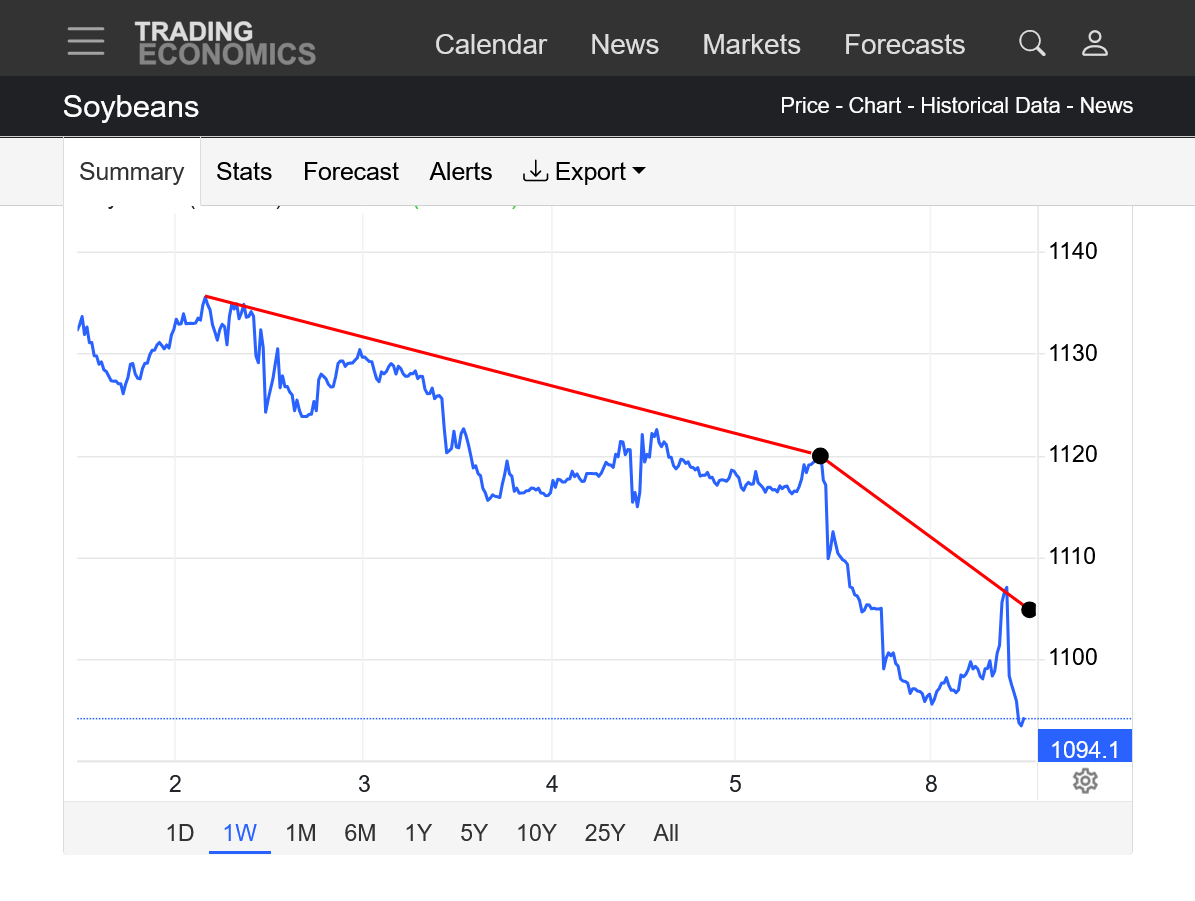
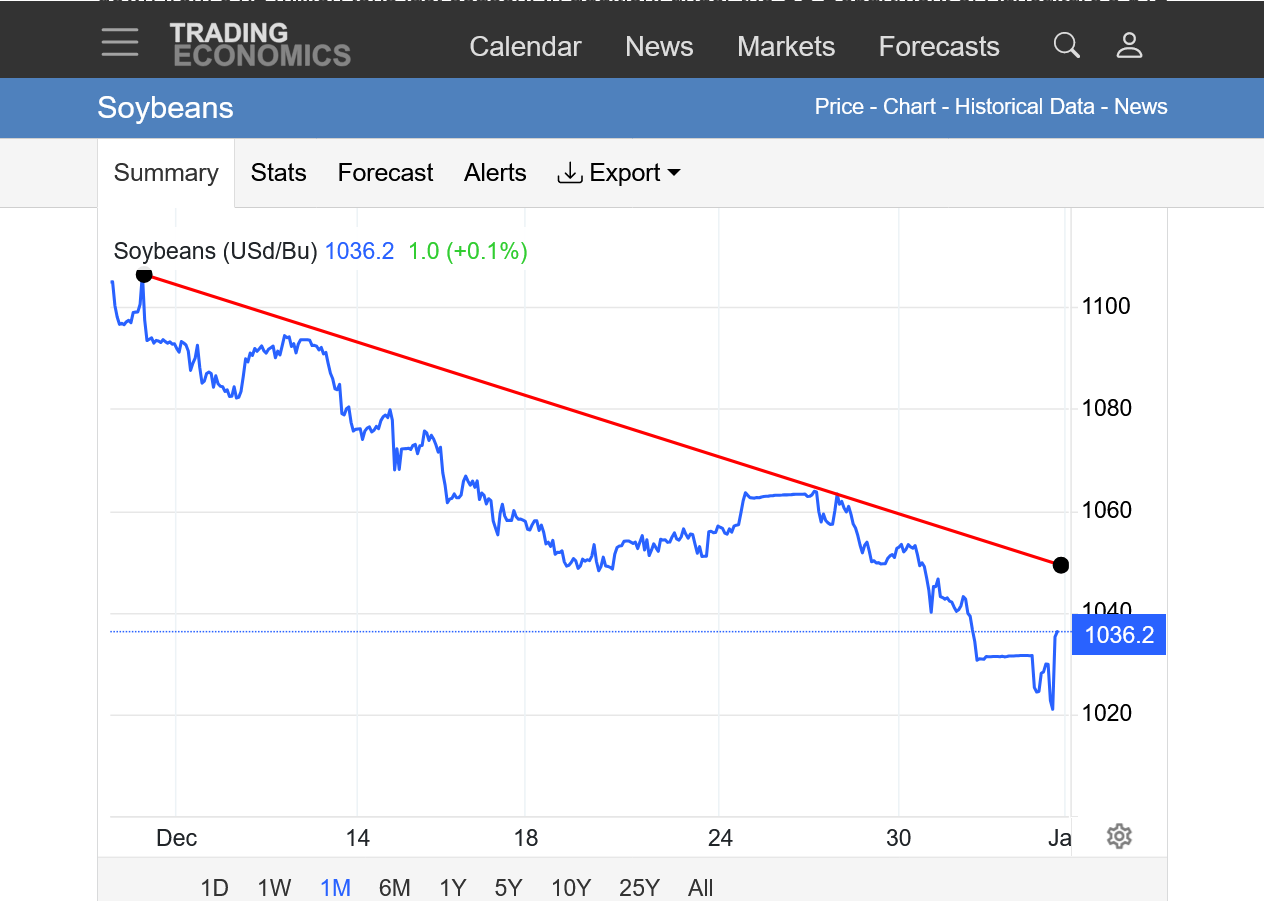
2. 1 week: Strong downtrend, -35c as rains increased in the forecast.
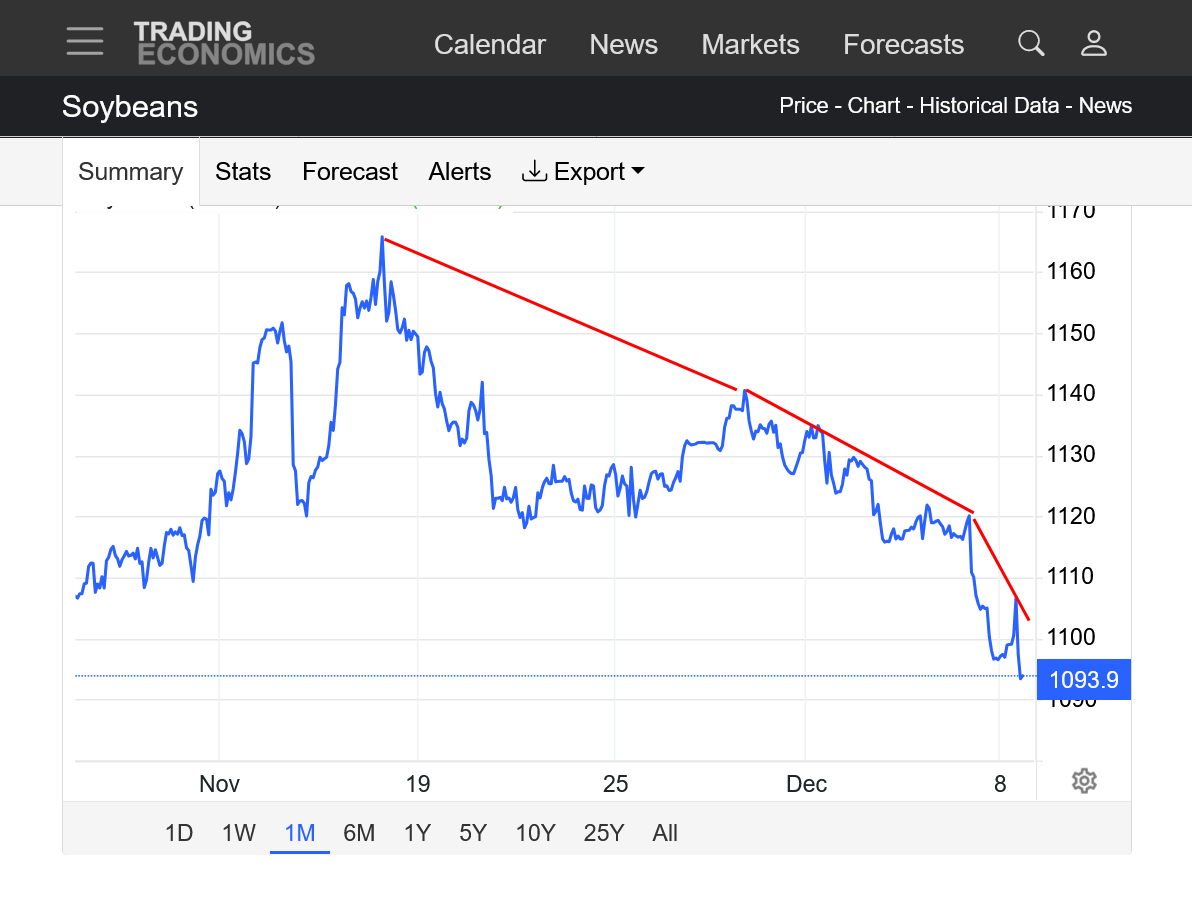
3. 1 month: -70c from the highs as rains increased in the forecast for expected drought areas
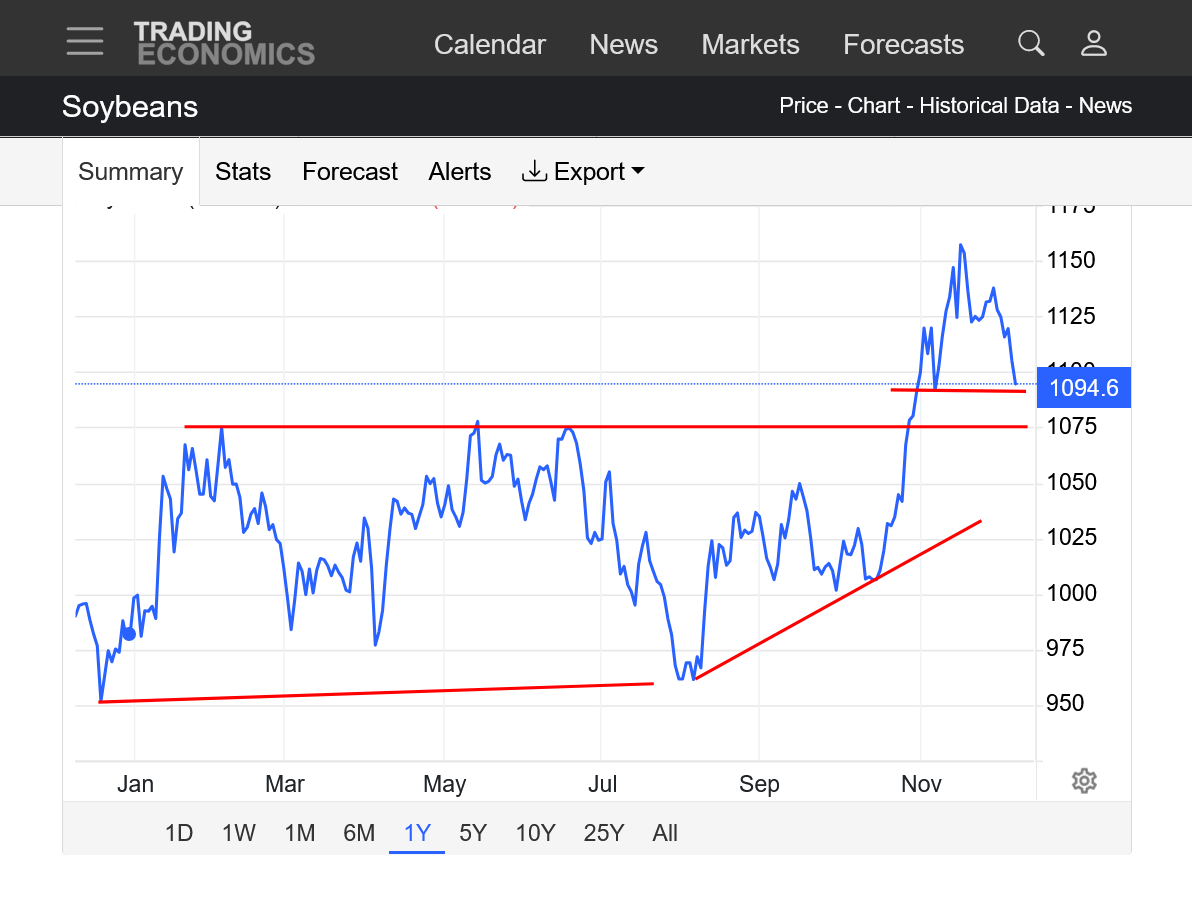
4. 1 year: Despite the short term, blow off top in November, still bullish. Potential bull flag? Above previous support. And above previous resistance. Well defined double bottom lows in late Summer and new uptrend after that.
5. 10 years: Bullish! Upside break out from long term symmetrical triangle(higher lows and lower highs). Upside break out of sideways channel in 2025.
WASDY report tomorrow
Thanks for the reminder, cutworm!
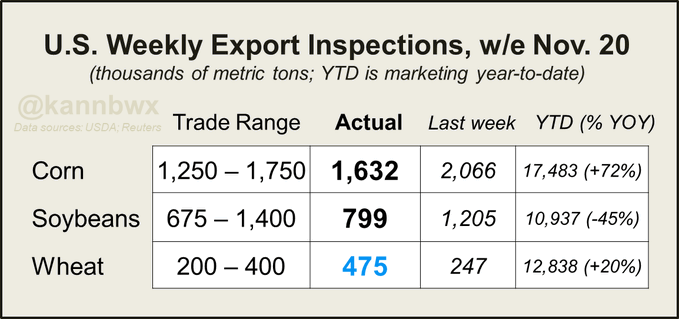
Last week's US corn export inspections landed just above the top trade estimate, and the prior week's number was revised notably upward. China finally appeared on the soybean ledger with 2 cargoes insp. @ the Gulf. Bean YTD now at -45% YOY vs -46% YOY last week... interesting.
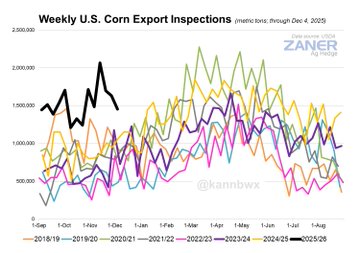
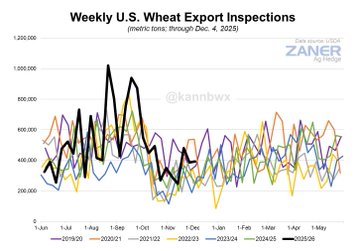
Soybeans avoid another "18-year-low" metric. Corn inspections continue at a jaw-dropping pace. Wheat inspections remain respectable - better than in the last few years as they should be - 25/26 wheat exports are predicted to reach a 5-year high.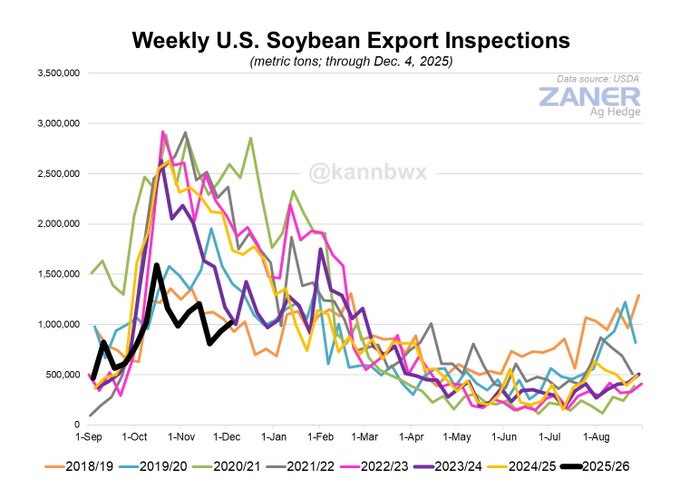
China imported 8.11 million metric tons (298 mln bu) of soybeans in November, up 13% from last Nov but the first time a new monthly record hasn't been set since April. China has taken in a record 104 mmt of soybeans in Jan-Nov 2025, up 7% from Jan-Nov last year.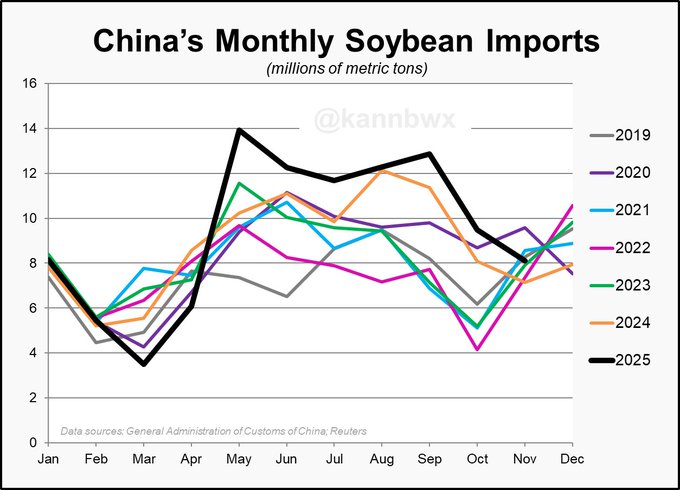
·
Trump will announce the farmer aid Monday at 1 pm CST.
+++++++++++++++
How about, instead of compensating farmers and consumers for the incredibly damaging tariffs that are destroying long lived relationships with our trading partners that are responding by replacing us........get rid of the tariffs!
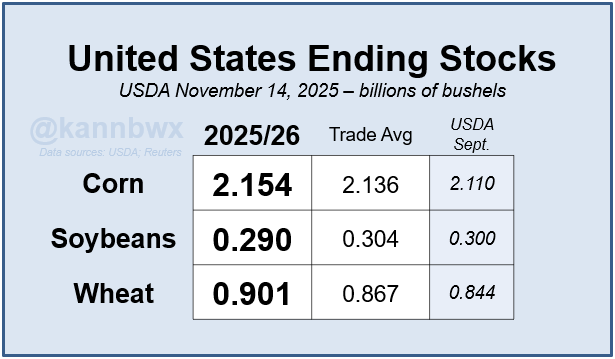
USDA cuts U.S. corn ending stocks (exports went up 125 mbu), but soybean stocks were unchanged as were soy exports. U.S. wheat stocks also unchanged.
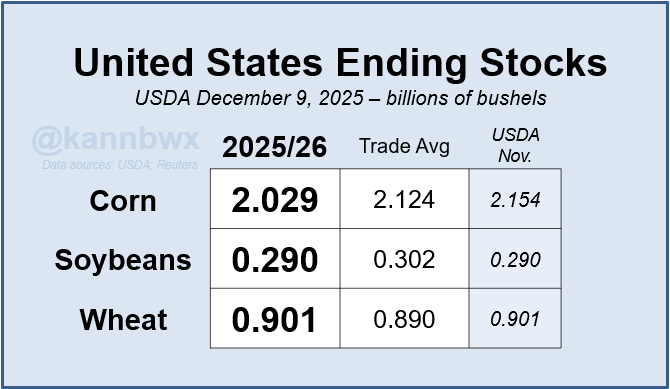
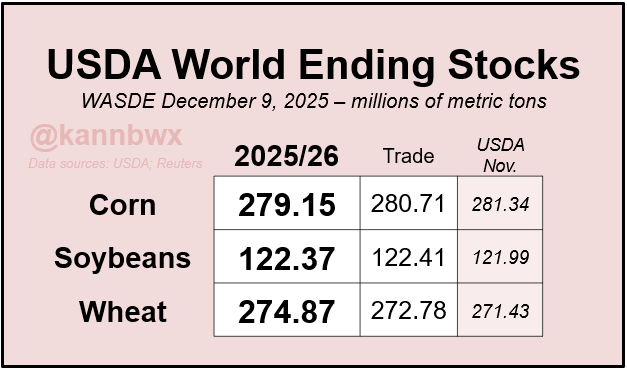
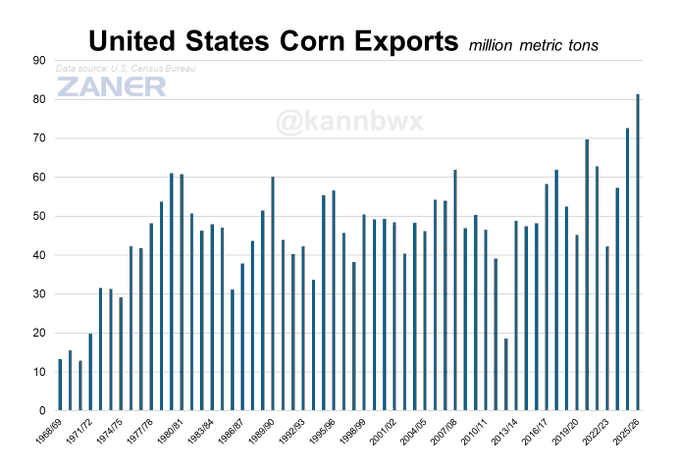
U.S. corn exports: a RECORD 81.3 million metric tons projected for 2025/26. That's slightly more than USDA's 2025/26 outlooks for Argentina & Brazil COMBINED (80 mmt).
Eric was in this morning with his wonderful weather presentation from Nutrien Agriculture!
The area that was supposed to have a drought in N.Argentina/far S.Brazil, instead will be having heavy rains the next 2 weeks.
A bit dry in S.Argentina and far NE Coffee land
Here's the rain total forecast thru January 29, 2026 from the same European Ensemble model.
A bit dry in far SW. Argentina and maybe for far NE. Coffee(Bahia) but otherwise, TONS of rain.
Eric was in this morning with our weather!
Dec 19, 2025: Wind/Fire Threat | 70s in Plains | Deep Western Trough | Christmas Outlook | Dryness
Stone X , exports to China, funds, ect
Markets Now Closes - 12/22 Grain & Livestock Rally: What Drove it & Can Markets Build on It?
Thanks very much, cutworm!
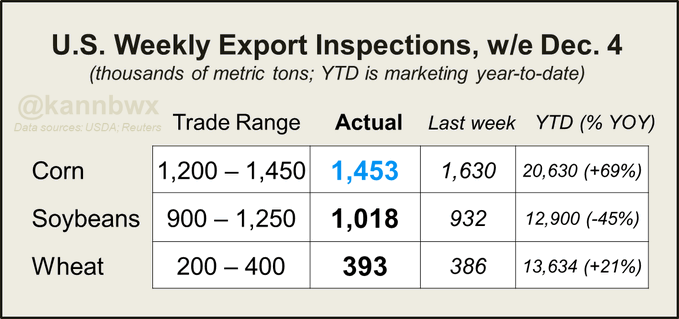
U.S. wheat export inspections last week were well above expectations and corn was near the higher end of ideas. Some 44% of the week's soy volume was destined for China.
+++++++
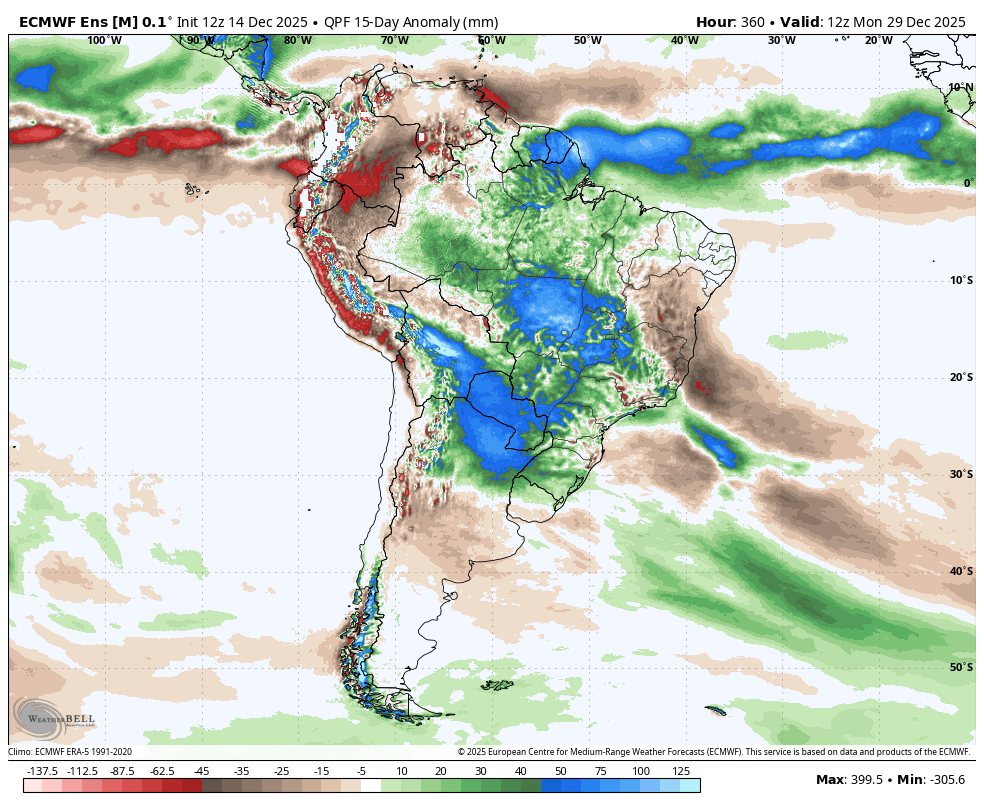
From the European Ensemble model, 2 week rains for South America. Pretty good for most areas except for a few dry spots.

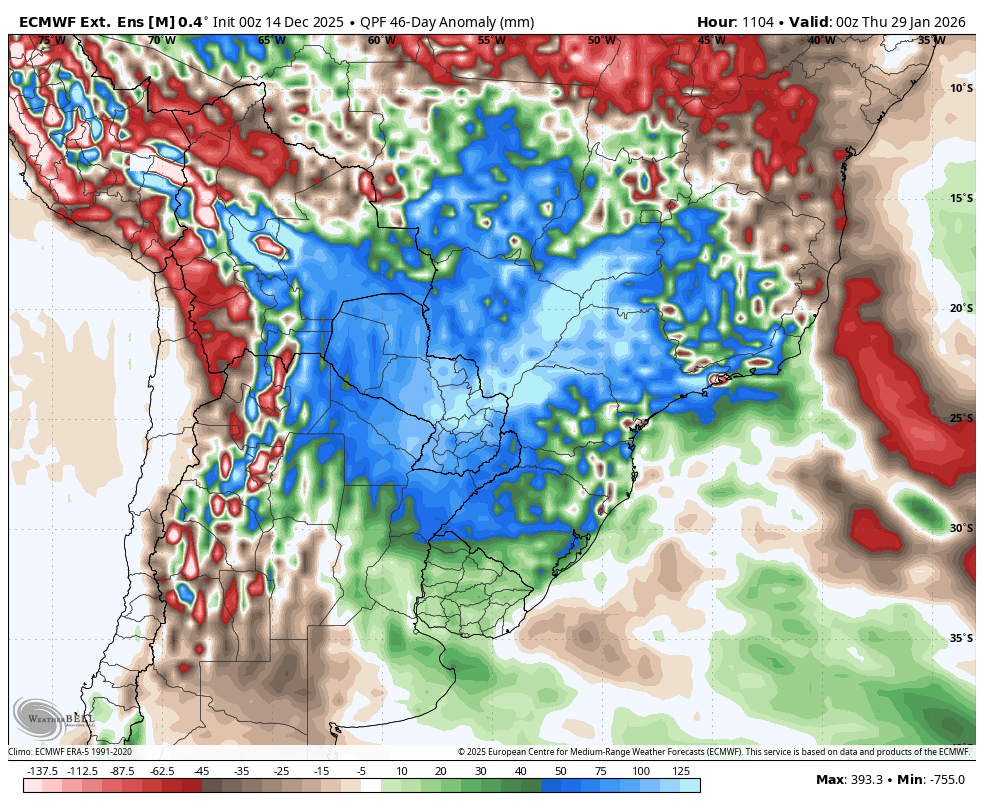
Same model and area below(zoomed in) for the next 46 days. Maybe dry in southern Argentina and far northern Brazil.
The weather is going to get pretty dry in Argentina the next month:
2 weeks from the last 0z European Ensemble model:

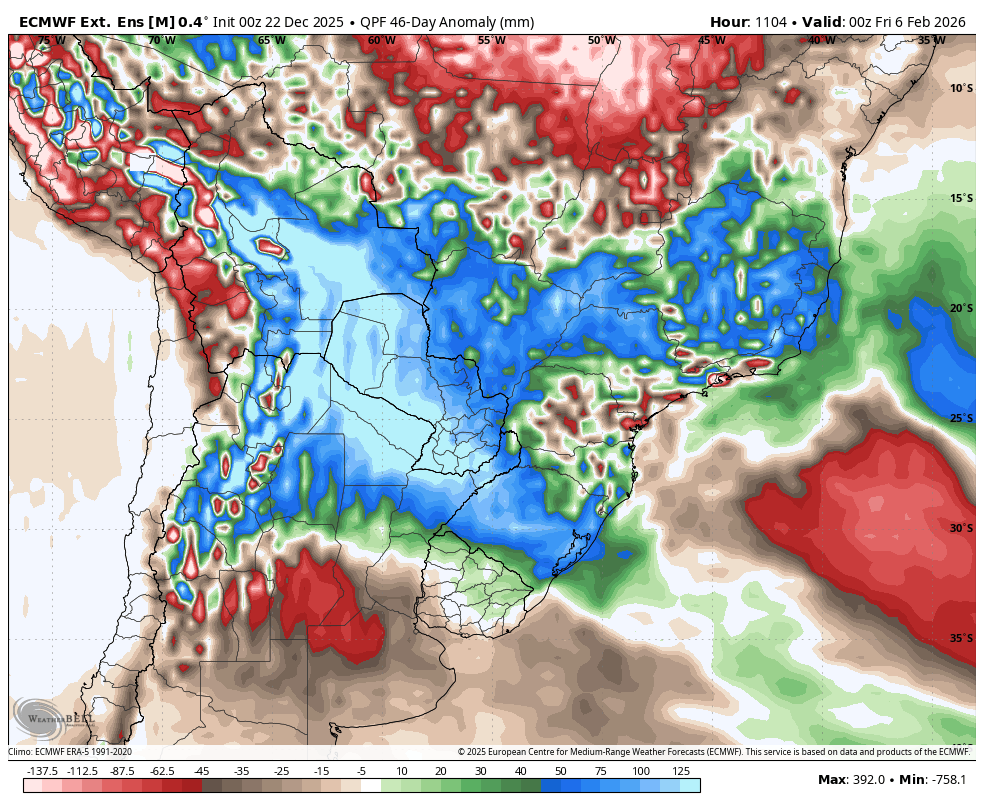
All the way out to February 14, 2026 from the same model: Pretty big rainfall deficits in Argentina. A surplus to BIG surplus in most of Brazil's key crop producing areas.

U.S. soy sales fell well short of expectations in the week ended Dec. 18 and China accounted for 63% of the net sales. Corn export sales were the week's largest ever, at least back ~25 years. Morocco and Venezuela were the top bean oil buyers.
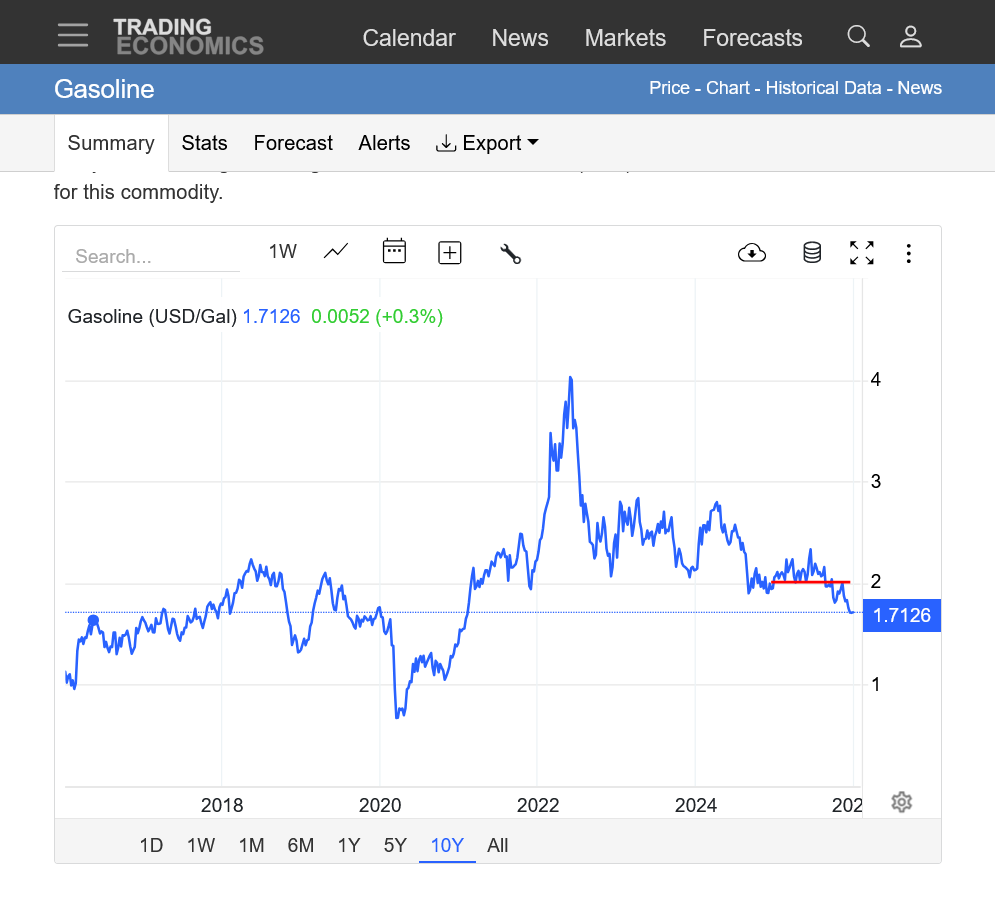
for all the whining and Trump griping you read here you might want to notice Jan 26 beans 32 1/2 higher than Jan 25 close at. Corn exports record. Gas purchased yesterday at 2.11/g inflation down, energy down, take home pay up. Just so wished we could of gotten Walz and Harris over the finish line and now had to pick a new VP because this Minnesota mess would of taken old Crazy Walz right out even before his crazy policys would of taken him out. The Minnesota mess is growing by the day and will not go away. Hell its so large even some here or the MSM will even have to recognize it before long.
Sure seems logical if Trump is going to take all the hate for some markets he ought to get some notice of others....other than constant hate, And hate is exactly what it is to be honest. And again if you had not noticed his ratings even after all the constant hate are exactly twice what congress rating are....so strange.
And all this hate for taking no pay and getting shot in the head....again so strange
Thanks very much, mcfarm!
Happy New Year and I agree strongly that there's too much hate in the world.
It's true that gas prices are down and I appreciate Donald Trump's position on the fake climate crisis too!
Hate(and love)
Started by metmike - Oct. 17, 2023, 4:15 p.m.
Americans are paying less at the pump than they were a year ago, but industry analysts are mixed on how much credit President Donald Trump deserves.
++++++++++++
I would be interested in hearing why you think Trump is responsible for the lower gas prices(other than he and Fox saying it over and over).
By metmike - Aug. 15, 2025, 8:42 p.m.
https://www.marketforum.com/forum/topic/113965/
++++++++++++++=
The Biden administration faked like they were cutting back on fossil fuels while they were gushing them out at a greater rate than Trump did.
yes more oddities. Trump ran on certain policies and for the most part is delivering. Biden and Harris lied cheated and stole. Or has old Joe himself told us "son of bitch".....who would of guessed
Thanks, mcfarm!
Not sure if the market will interpret this as bullish or not but Brazil's forecast has had abundant rains in it for quite some time but over the weekend, the models have cut back on alot of that rain for some places including parts of #1 producer Mato Grosso. Nothing extreme, just NOT AS wet.
Coffee-land(Minas Gerais) looks drier than average too.


2 week rainfall anomalies from the last 12z European Ensemble model:

7 week rainfall anomalies from the 0z EE model:
Latest radar for Brazil. I have not been tracking recent rains very closely, just the forecasts which have turned drier in some places. The heavy rains will be shifting more into Northern Argentina now!
SH opened on the lows, down a tick and are +6c right now!
The lows could be in!
This is the January contract. The main contract now is March.
https://tradingeconomics.com/commodity/soybeans
1. 1 week: open tonight at red line
2. 1 month; downtrend with bearish weather adding selling. This could switch to buying from bullish weather in Brazil.
3. 1 year this looks bad but drier weather in brazil could flip things for the bulls
4. 10 years
Eric was in with the weather on Tuesday:
Jan 6, 2026: Mistimed Shortwaves (Too Much Tilt) | Two Late Week Storm Systems Stronger Storms South
Crop report Monday Jan 12th at noon.
Thanks, cutworm!
We all remember the USDA report last January!
After you and me were talking about yield losses from hot dry weather during the last month of the growing season(especially bad for beans that need moisture for late pod filling) and the USDA ignoring it in Oct-Nov-Dec, then suddenly, 4 months later they hit us with a shocker to tell everyone what they should have told us AT LEAST 2 months earlier.
Alot of traders believe that the corn yield needs to come down from 186 to something about 180-182ish. I would think maybe this is in the market???? also feed use is 25million to high??? Also exports have been great.
Still a 1.9 billion carry over????
Just what I hear
What if the usda doesn’t back off much in corn production. What if it is only a one or two bushel decline. I agree we have a long term uptrend, but the minutiae of the market could force a short term set back. Look at the September stocks report that added back every bushel they took away in January
well Vinny here it is ain't pretty. And MM I was with you on the lows were maybe in....if this report had any data that matched what we reported to usda after we planted. This report in the next few n=months will be remembered for being one of the most inaccurate crop reports ever but today its the real word that is traded
Thanks very much, mcfarm for reminding me about this important report.
I'll start a new thread to cover it and new discussions in the grains.
Corn prices especially are taking it on the chin today


