

*Please move to TR part of forum**
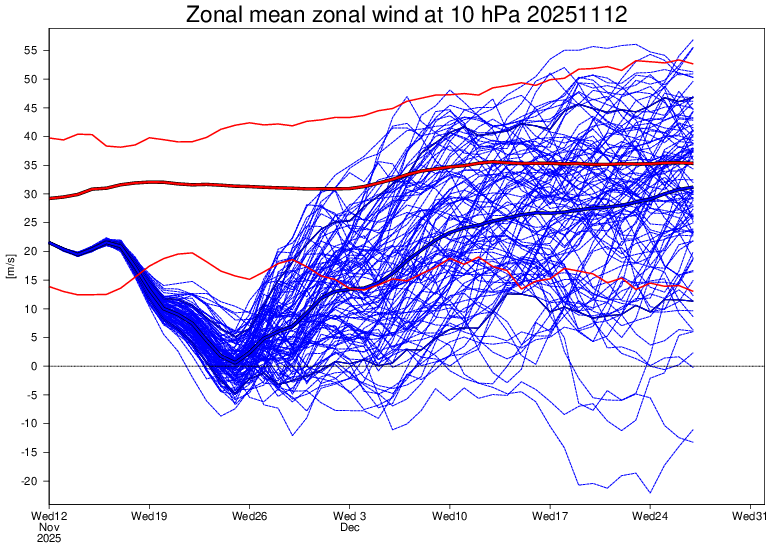
The chance for the earliest in the season major SSW (Stratospheric Warming Event) since 11/24/1968 increased markedly today. The significant threat of one has been showing up on the Euro Weeklies since the 11/5/25 run, but since then it has been more of a good possibility rather than a likelihood. With today’s run and even the end of the two week EE runs now, the chance has increased to likely for ~11/24-6. Implications from this, alone, are for an increased threat of a cold dominated E 1/3 of the US for a 2++ week long period starting after a lag period of unknown length (usually 1-2+ weeks). Natgas may very well have been reacting to this possibility in a bullish manner.
Today’s Euro Weeklies SPV (at 10 mb):
Thanks, very much, Larry!
I've been wanting to check on the SSW data a dozen times recently but keep getting distracted by other priorities and forget, so this is especially wonderful.
For sure, the past month the market has been trading expectations for cold during the period that this would impact (for other reasons too).
NG 11/10/25+
12 responses |
Started by WxFollower - Nov. 10, 2025, 10:14 a.m.
This was the last 384 hour 500 mb map from the 12z GEFS.
It continues to scream pattern change to much colder in late November!
Big building upper level ridge from Alaska to the Arctic, teleconnecting perfectly with a downstream upper level low in Central Canada with a trough digging into the central US.
This is the perfect set up for the Polar Vortex to be displaced extremely far south of its normal position in the Arctic. The colors are the relative anomalies(deviation vs average).

Previous thread:
Sudden Stratospheric Warming 2-3-25
21 responses |
Started by metmike - Feb. 3, 2025, 4:42 p.m.
https://www.marketforum.com/forum/topic/109818/
+++++++++++++
Re: Sudden Stratospheric Warming 2-3-25
By WxFollower - March 19, 2025, 1:49 p.m.
Mike,
Look at the blue dashed line on this:

Current forecast again. We've never crossed below 0(wind reversal) before the very end of November as shown on the graph above(record min). This is from the winds reversing from their normal westerly flow to easterly flow. Looks like we might not quite get there this time:

This explains the SSW from a previous event:
++++++++++++++
https://www.noaa.gov/jetstream/atmosphere/layers-of-atmosphere

Average temperature profile for the lower layers of the atmosphere above
+++++++++++++++++++++++++=
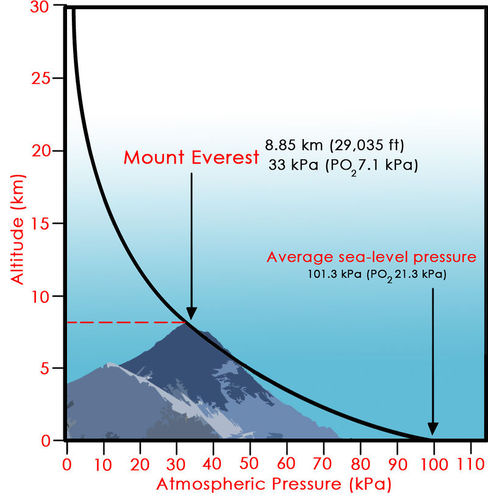
These predictions are for the 10 mb(millibar) level. The pressure at the surface is around 1,000 mb, so at 10 mb, there's only 1% of the atmosphere left! (it's in the stratosphere)
This is 65,000 feet above the ground, which is 12 miles up.........well above where the planes fly.
It would be over 2 times higher than Mt. Everest, the highest point on earth.
The conversion to KPa (pressure) below is:
1 KPA = 10 mb which is towards the top of the stratosphere with only 1% of the atmosphere left.
On the forecasts at the top we are using 10 mb which is the same as 1 KPa(Kilipascal) below. 10 MB is the pressure that we are using for the stratospheric wind forecast. It would be towards the top of the chart, which is 30 km. 30 km = 98,000+ feet on the left/Y axis below. The stratosphere actually starts much lower in the Arctic compared to the Tropics because the thickness of the atmosphere increases as the temperature increases. So the 10 MB level in the Arctic might only be a bit more than twice as high as Mt. Everest.
We won't quite make it to the earliest stratospheric wind reversal! The dark blue has to drop below 0 on the graph below which means the winds flip from their usual west to east direction to the opposite direction:
https://charts.ecmwf.int/products/extended-zonal-mean-zonal-wind?area=nh&base_time=202511150000
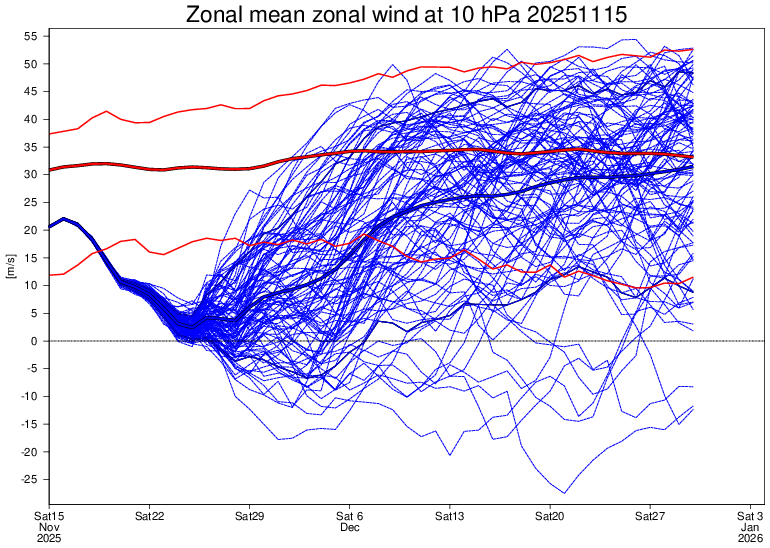
This is the latest forecast. As usual, an extremely wide range in solutions but the ensemble mean forecast is tracking close to climatology.
https://charts.ecmwf.int/products/extended-zonal-mean-zonal-wind?area=nh&base_time=202512300000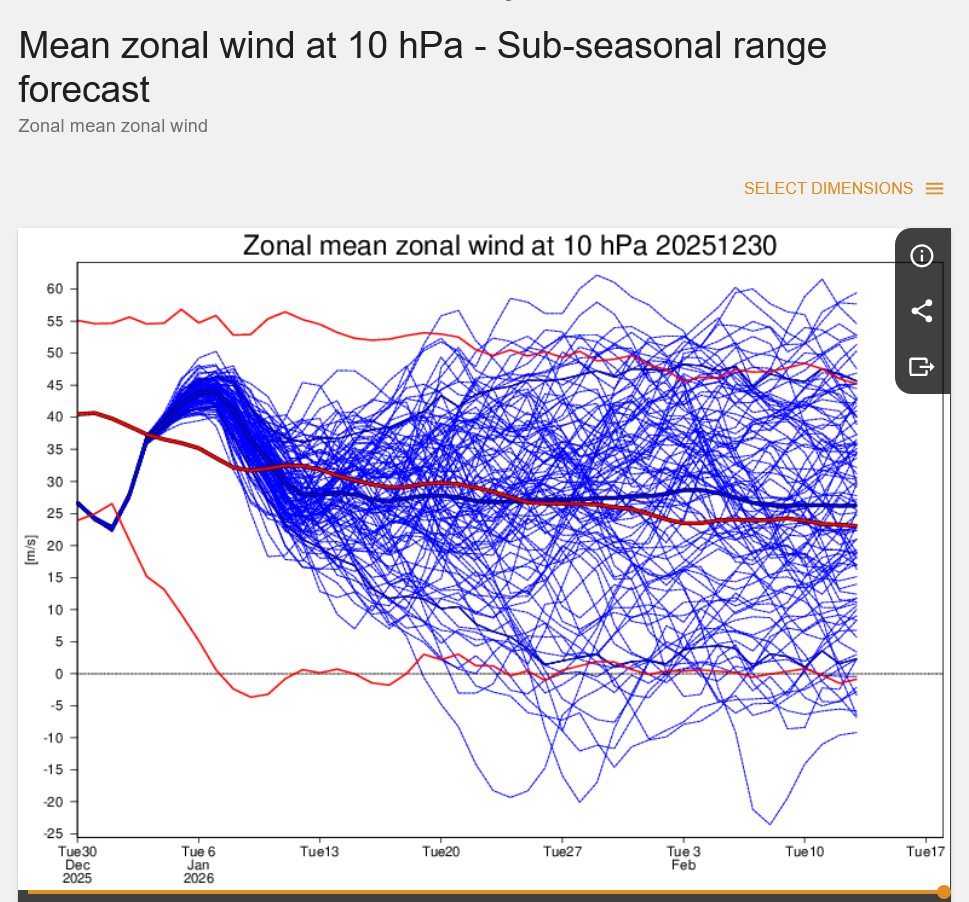
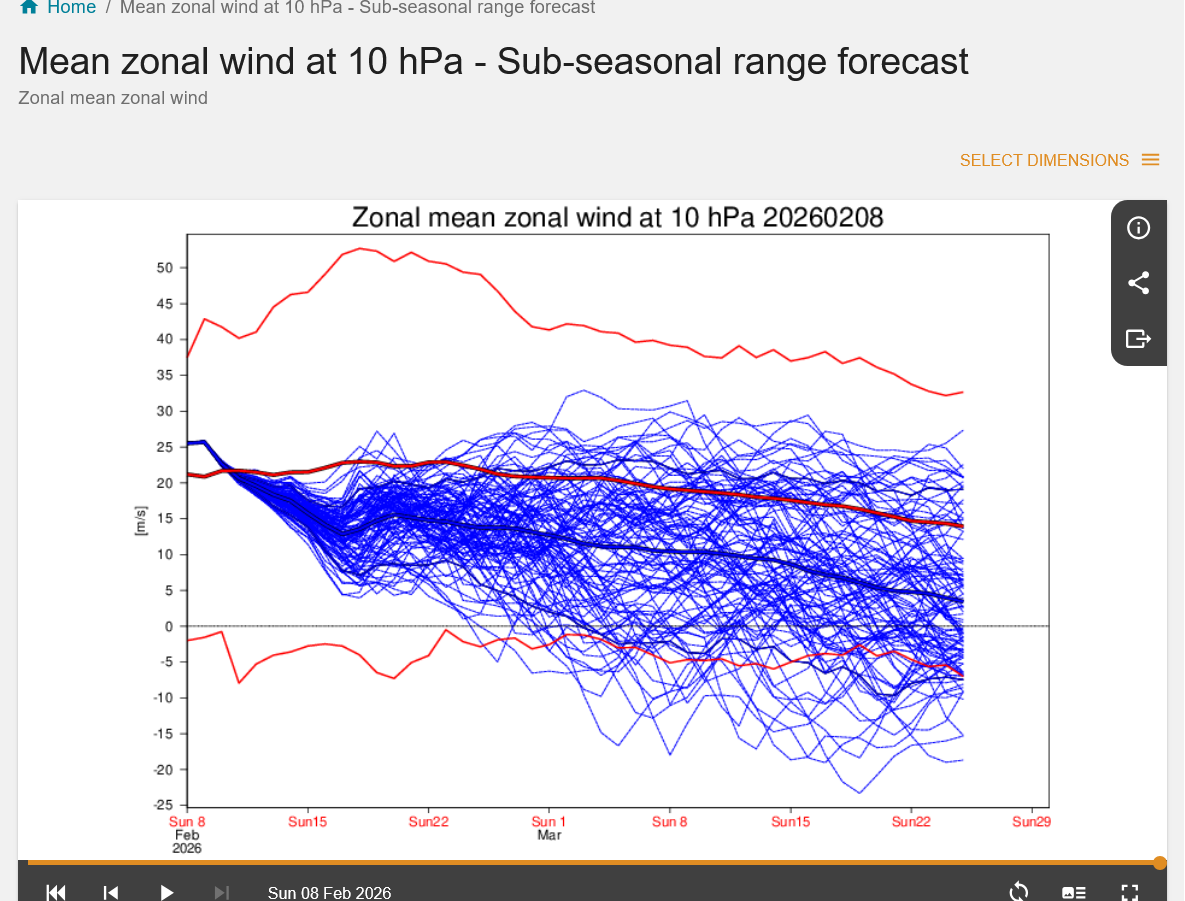
Potential sudden stratospheric warming coming in late March(stratospheric winds slowing down and reversing fromm the usually westerly to easterly direction).
https://charts.ecmwf.int/products/extended-zonal-mean-zonal-wind?area=nh&base_time=202602080000
Explanation:
Chance for earliest SSWE since 1968 increasing!
By metmike - Nov. 15, 2025, 5:21 p.m.