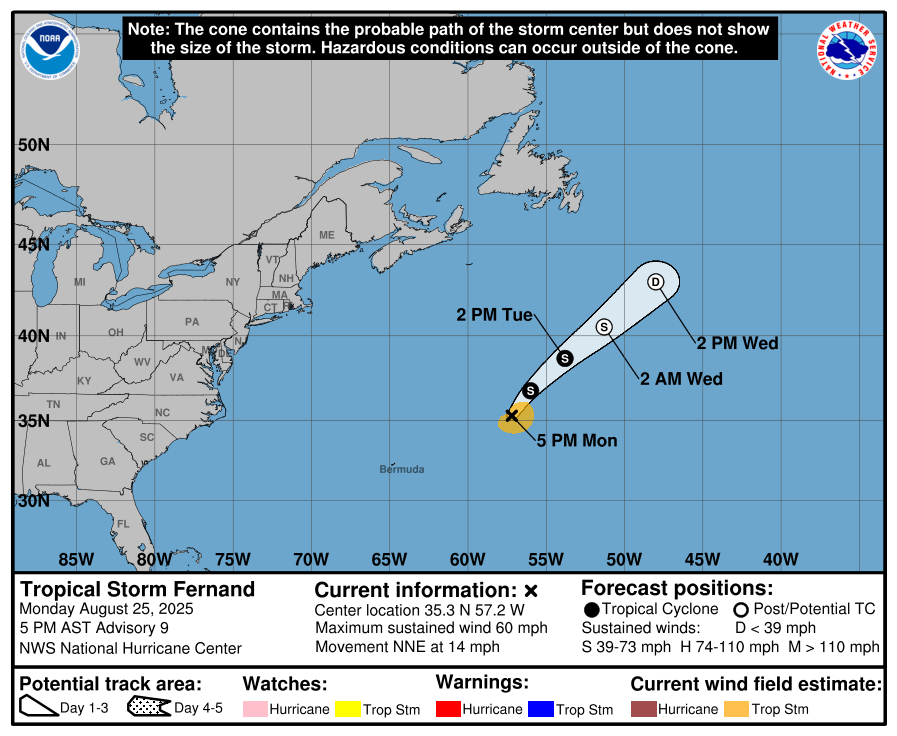
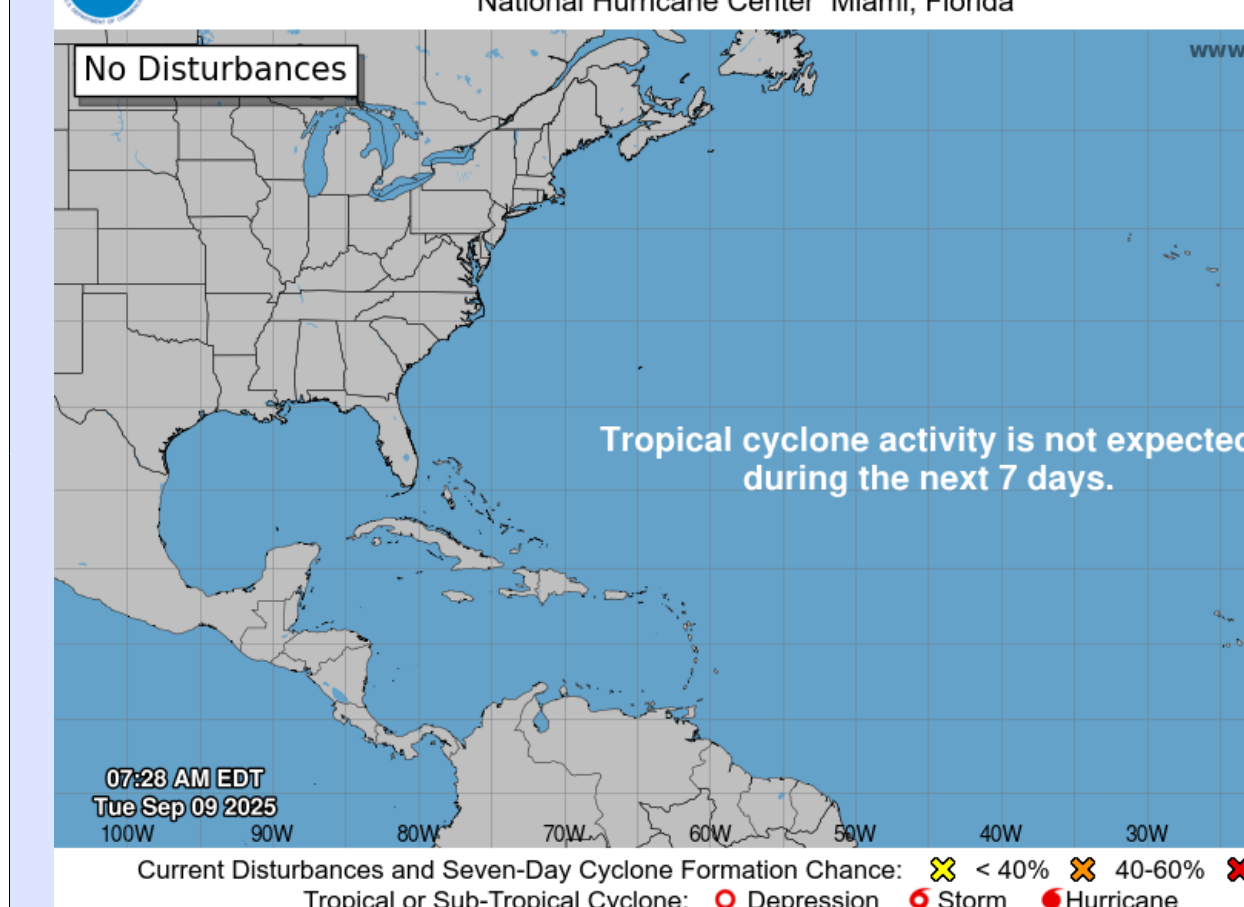
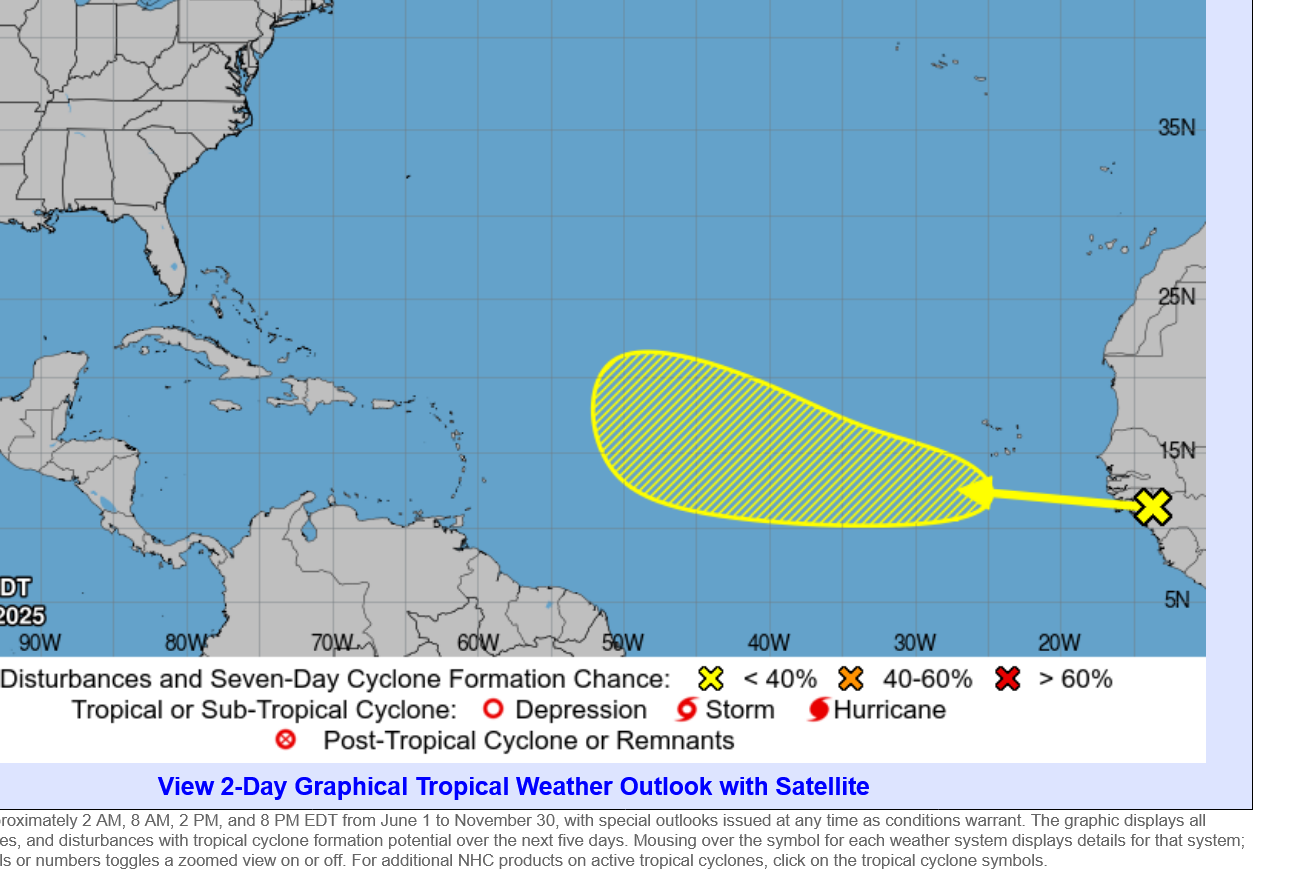
Nothing Burger!
https://www.nhc.noaa.gov/refresh/graphics_at1+shtml/252033.shtml?swath#contents
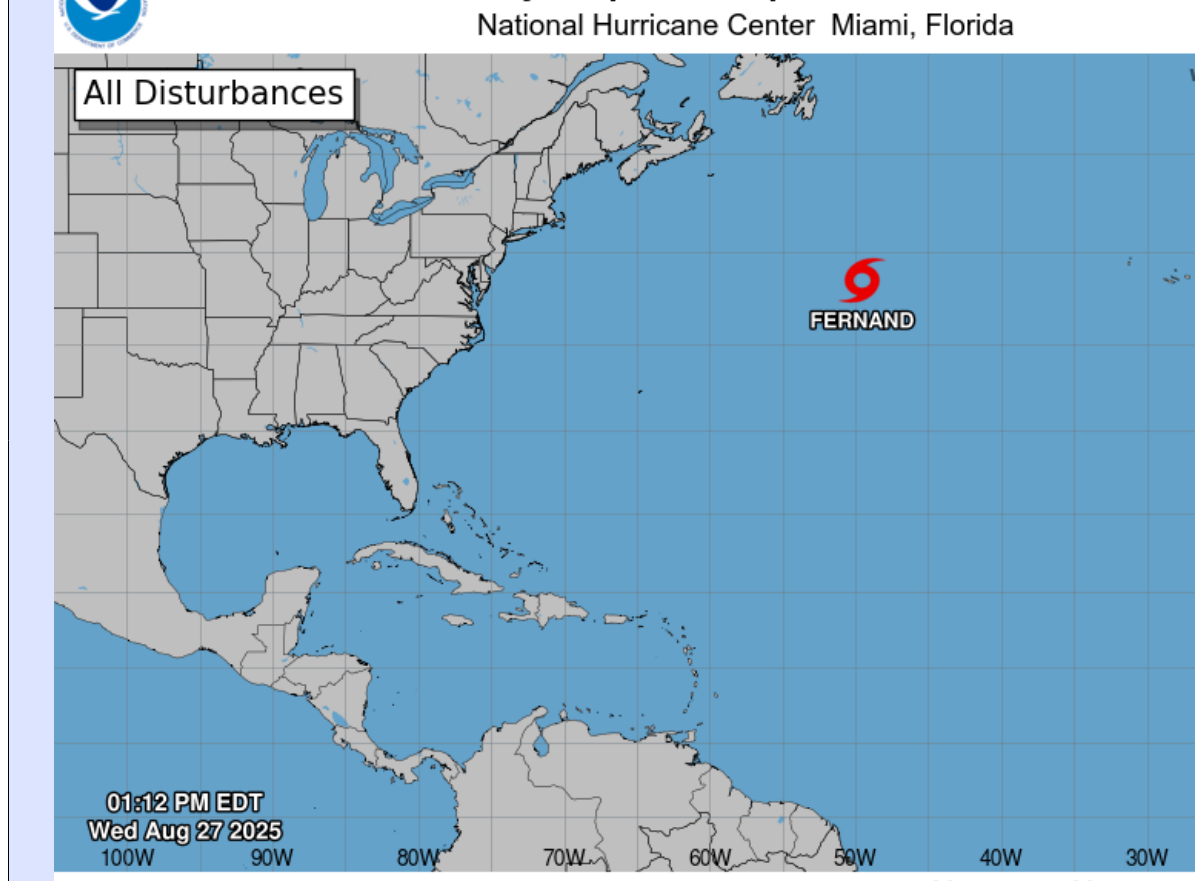
Elsewhere, the tropical Atlantic Basin is amazingly quiet for this point in the hurricane season.
https://www.nhc.noaa.gov/gtwo.php?basin=atlc&basin=atlc&fdays=7
Previous thread:
2025 NATL Tropical Season
18 responses |
Started by WxFollower - Aug. 3, 2025, 12:08 p.m.
https://www.marketforum.com/forum/topic/113730/
https://www.nhc.noaa.gov/climo/
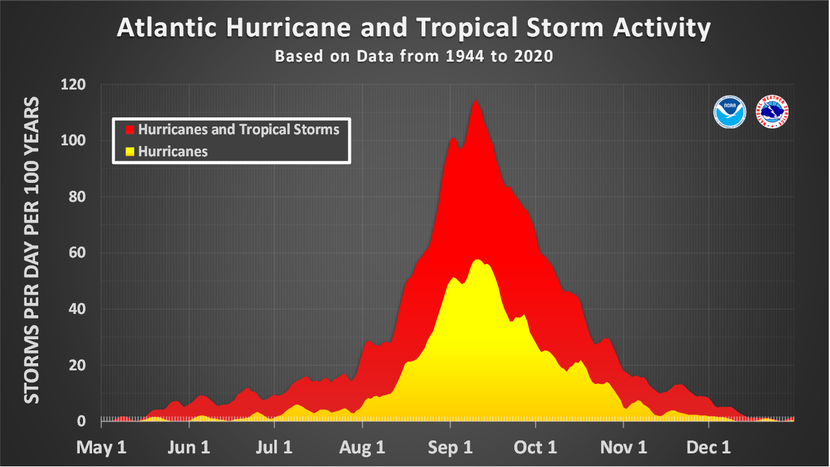
https://www.nhc.noaa.gov/climo/
More on the frequency stats between August and September.
The top graphs are from August. The bottom graphs are from September.
The graphs on the left are TSs on the right are Hurricane numbers.
The EE is telling us that in 2025 it will be the exact opposite, right?

What's coming up?
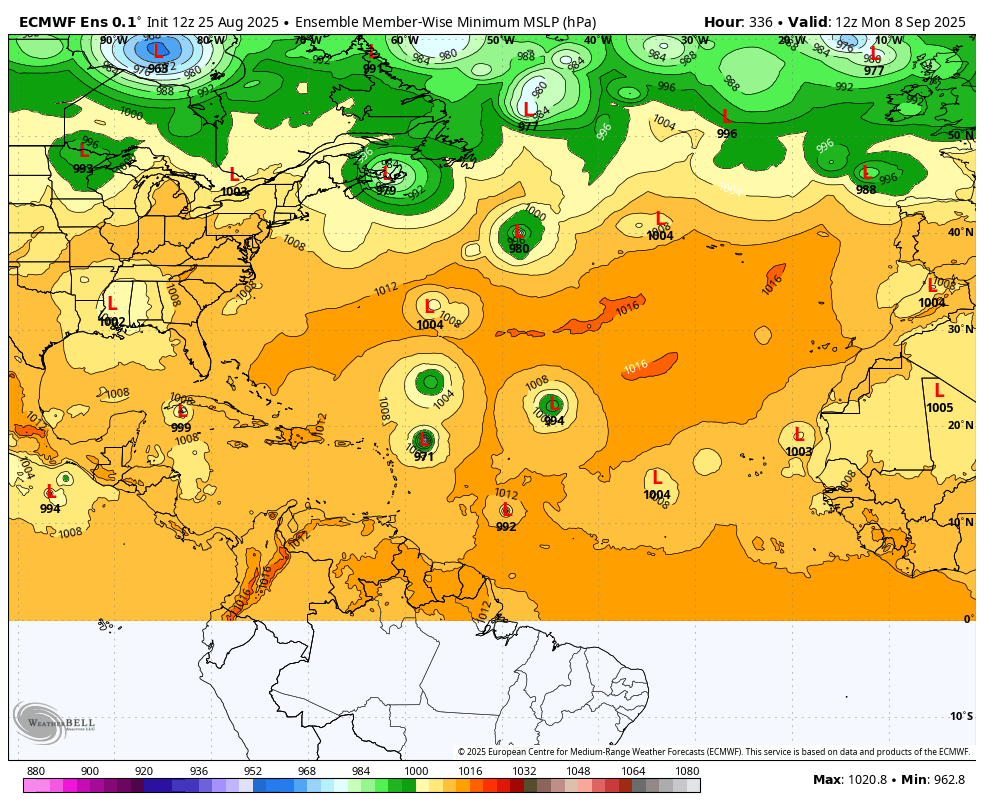
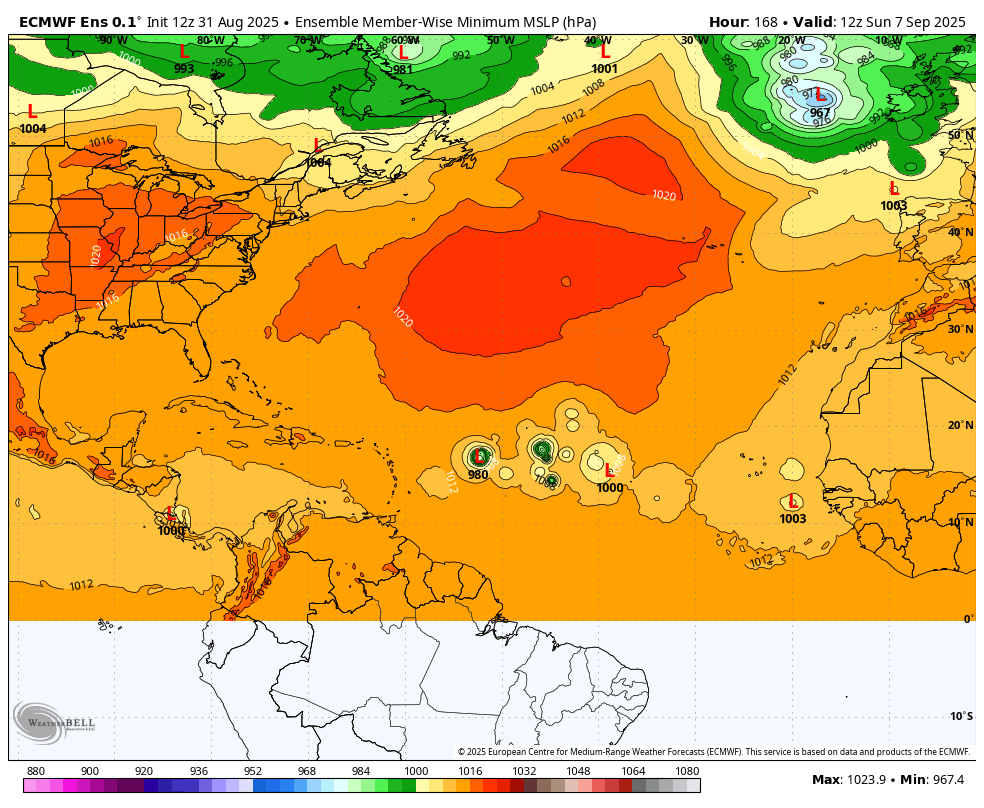
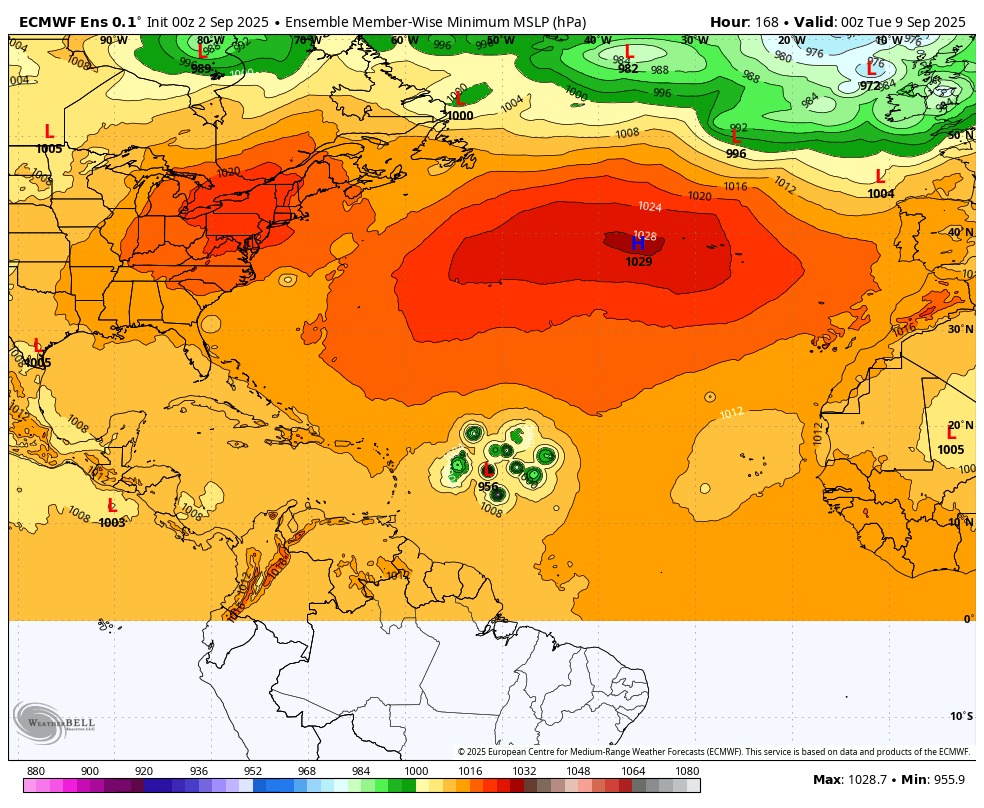
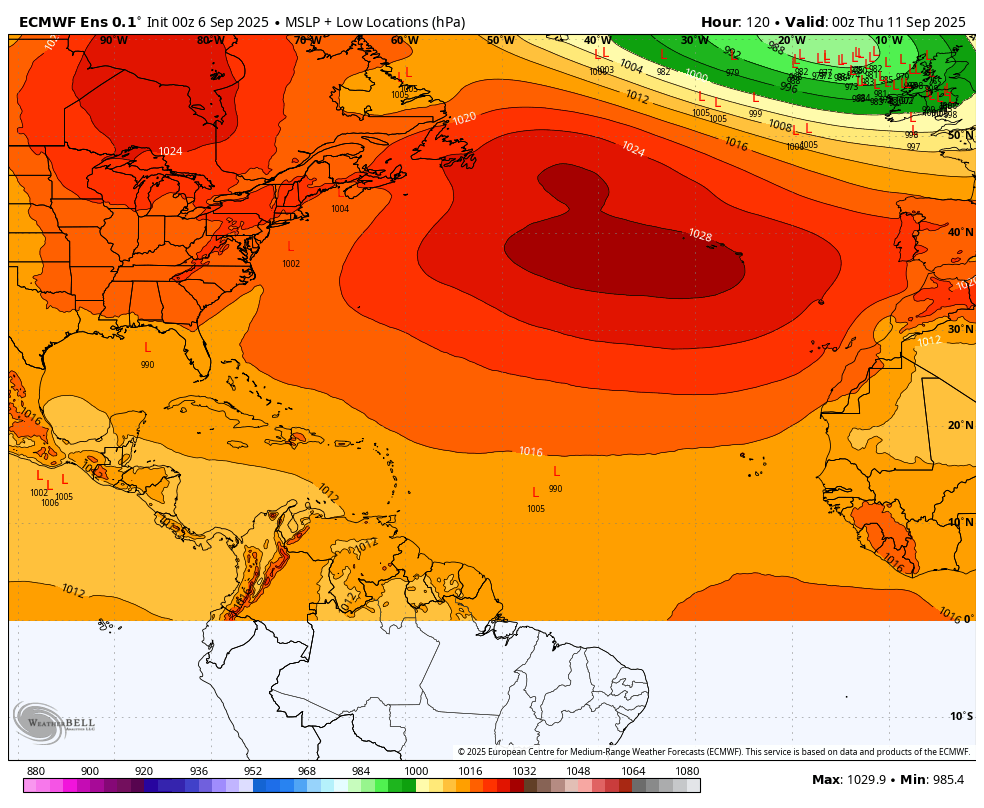
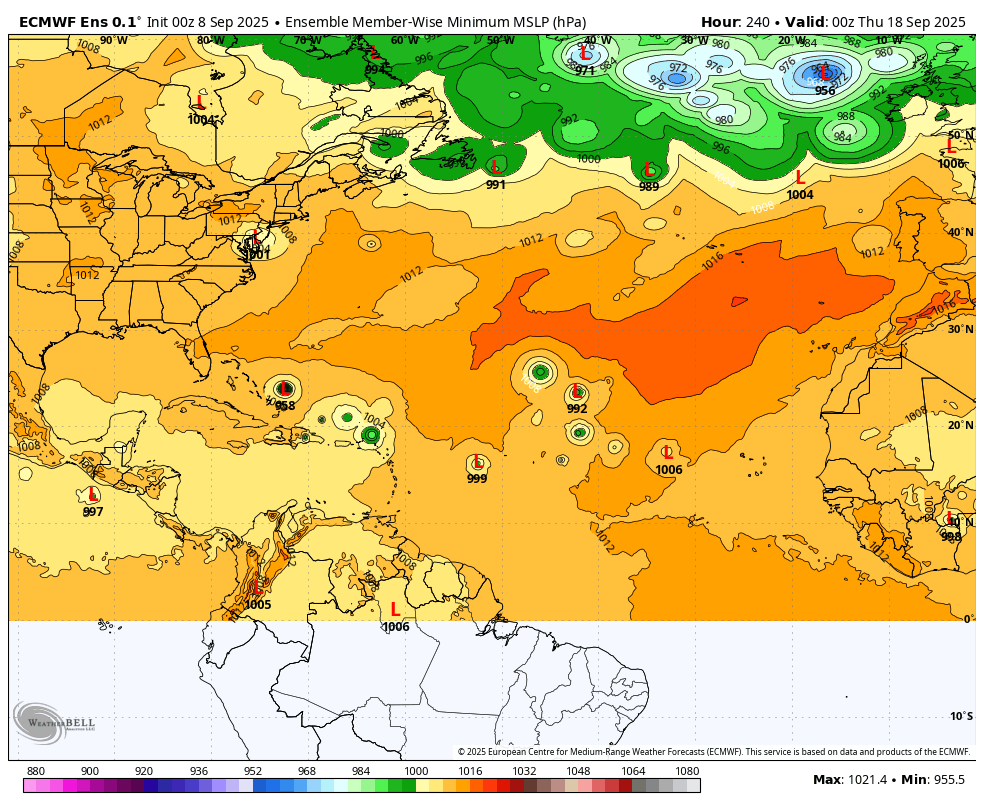
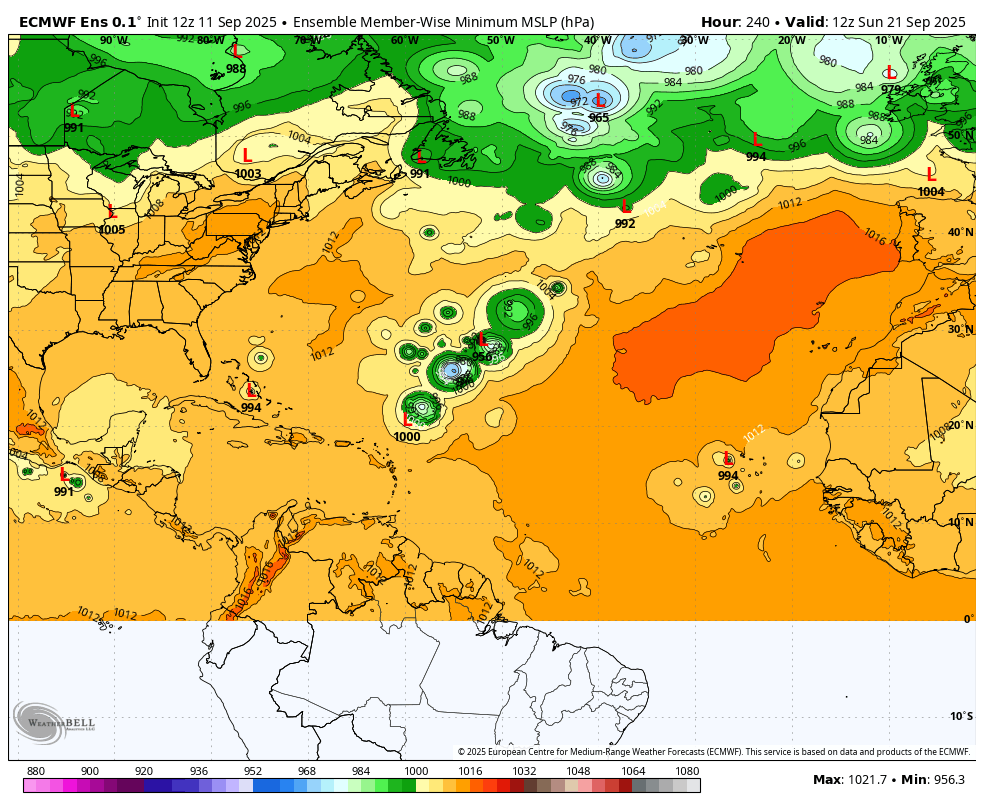
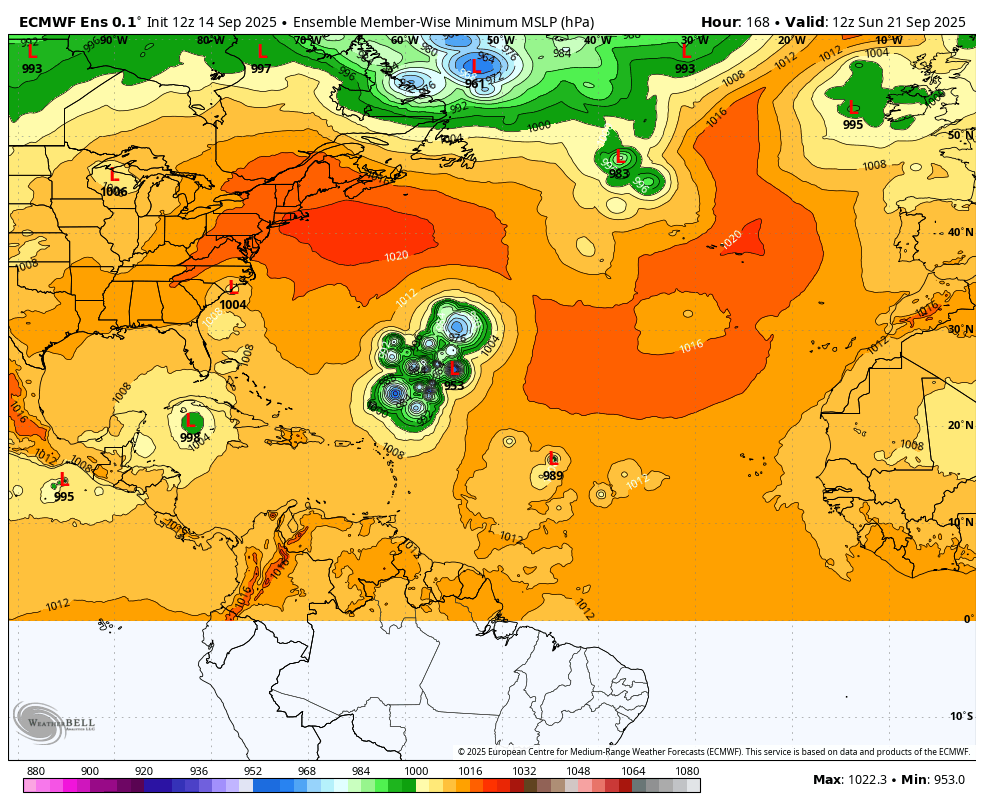
Here's the Surface Low Pressure solutions from the 12z European Ensemble models individual members for some interesting time frames.
Not much going on the next several days.
Day 8: Storm off the East Coast
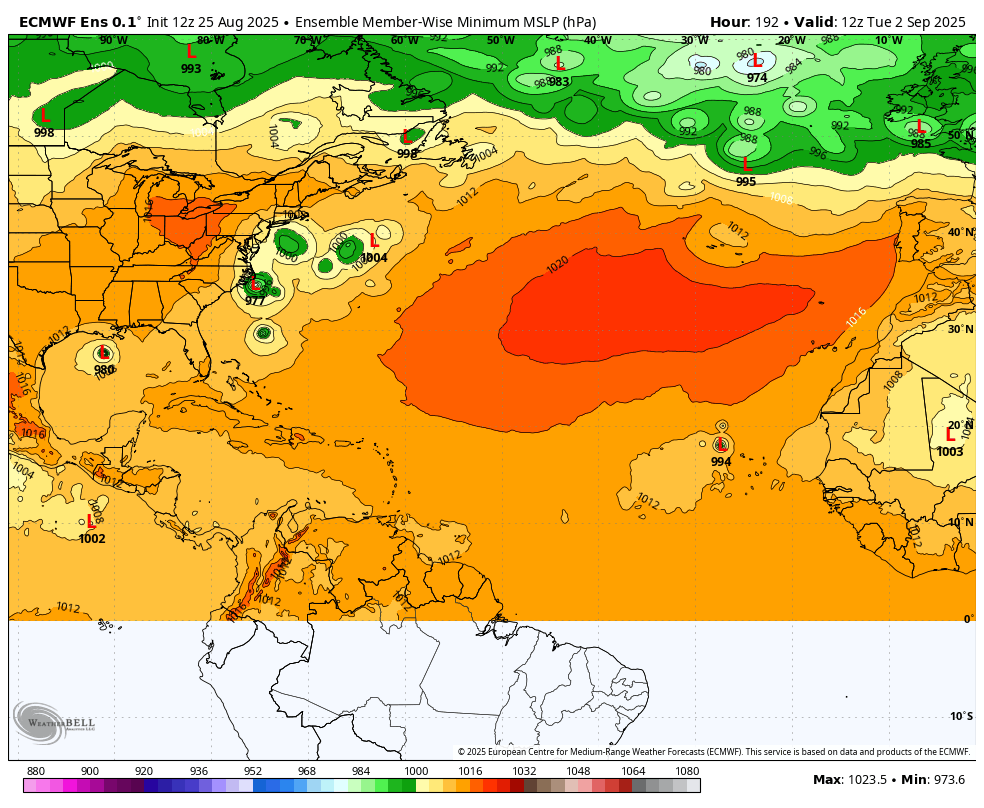
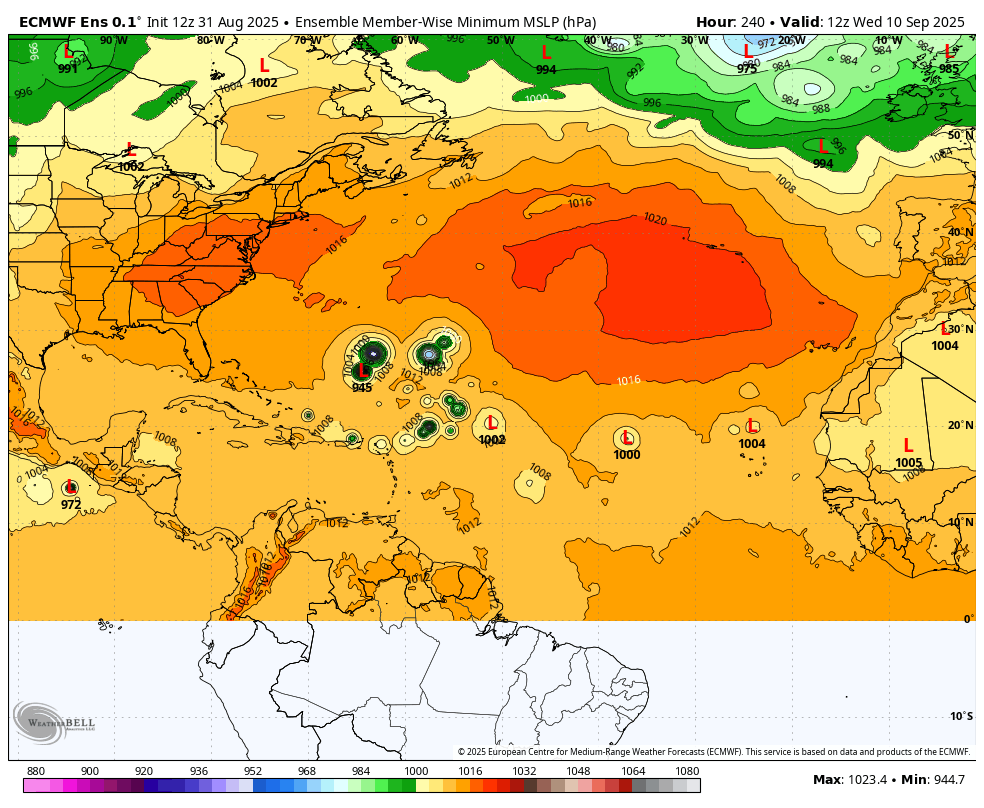
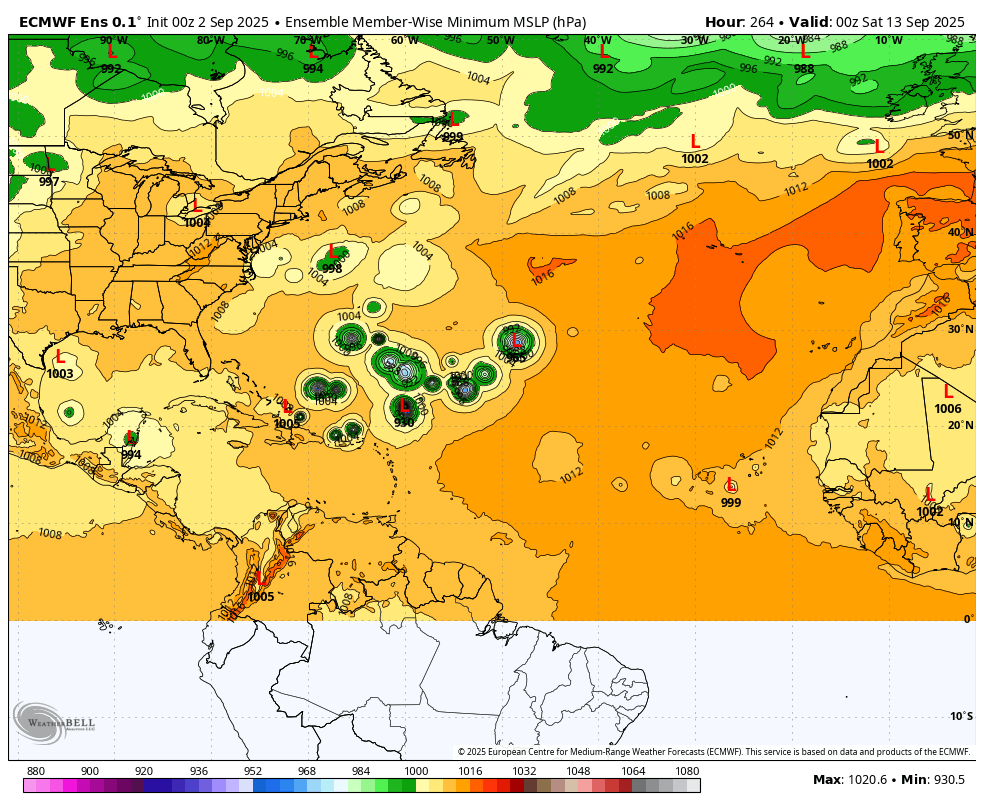
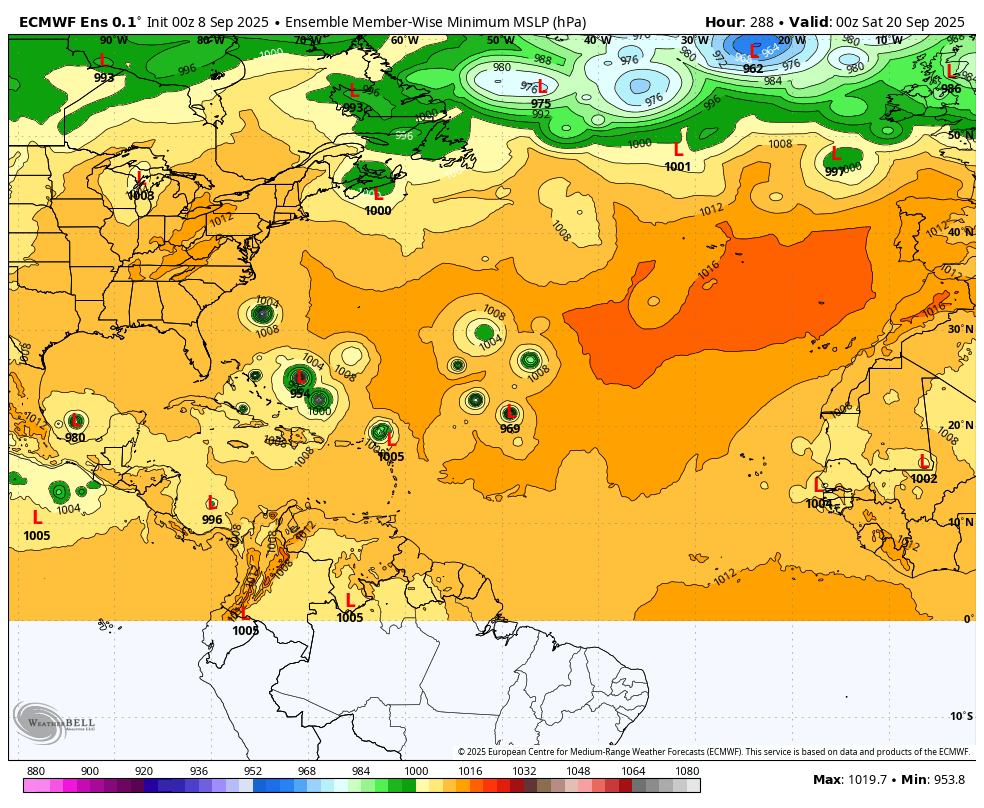
Day 14: Lots of potential new activity blossoming in the key area for storm births
EXTREMELY quiet in the tropics for this time of year. Ferdinand is at 45 mph and weakening.
https://tradingeconomics.com/commodity/natural-gas
Models don't show much thru the first week in September. Seasonally tropical storms really pick up then, so odds are high that mid September will feature many more storms.
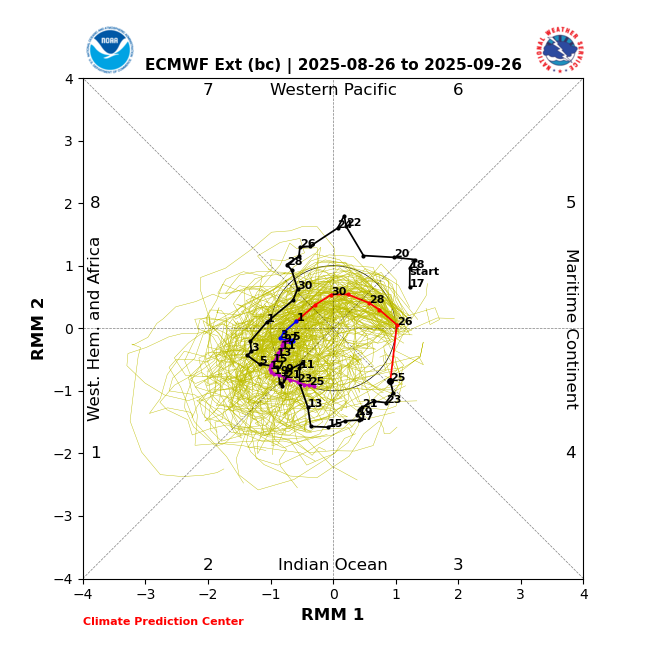
MJO is in phase 4-5 now which suppresses tropical activity but should be sliding around to phases 1-2, around the 2nd week in September which, along with the warm ocean temps and time of year, might really ignite alot of tropical activity.
https://www.daculaweather.com/4_mjo_phase_forecast.php
https://www.ospo.noaa.gov/data/sst/contour/usatlant.fc.gif
We can see the cooler water band in the Western Atlantic in the wake of Erin. Erin stirred up cooler water from significant depths below the surface.
Ocean temps of at least 26 deg. C are needed for a hurricane, which is around 79 deg. F.
Warmer ocean temps have been associated with rapid intensification(when all other elements are favorable at the same time).
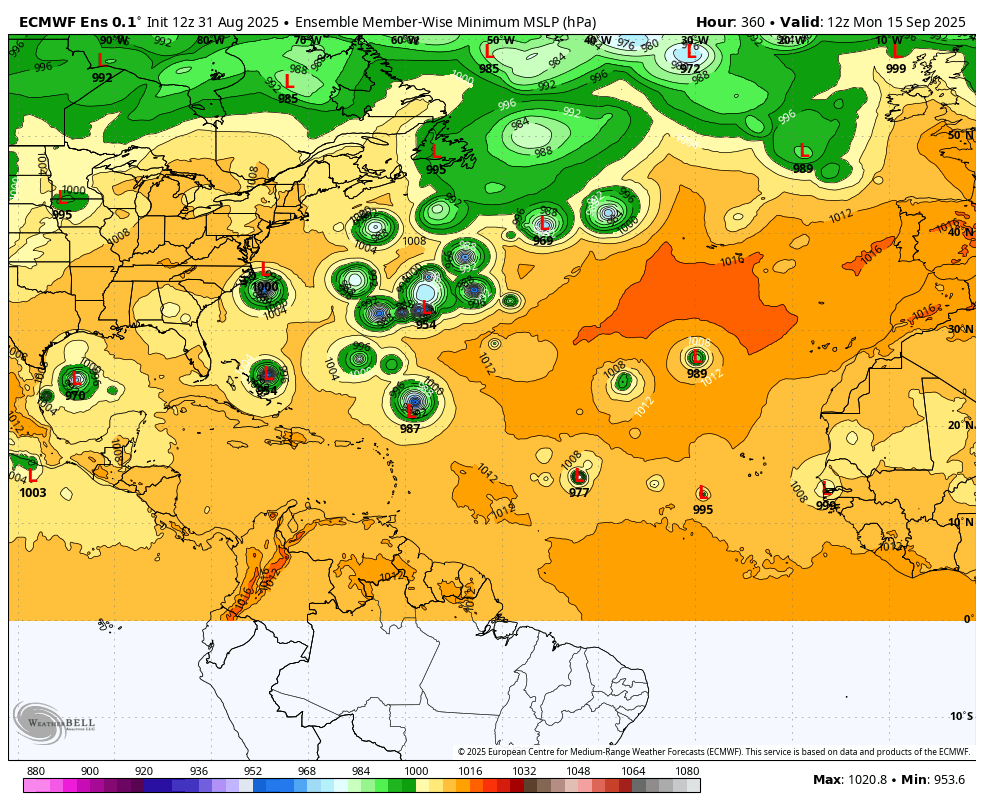
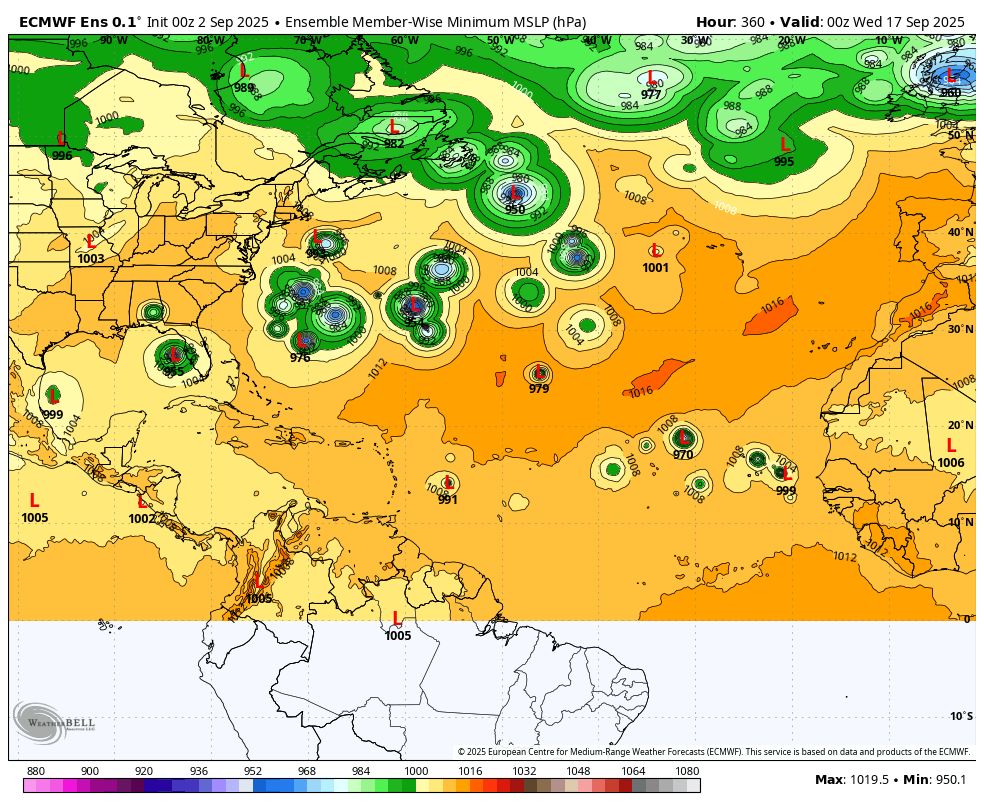
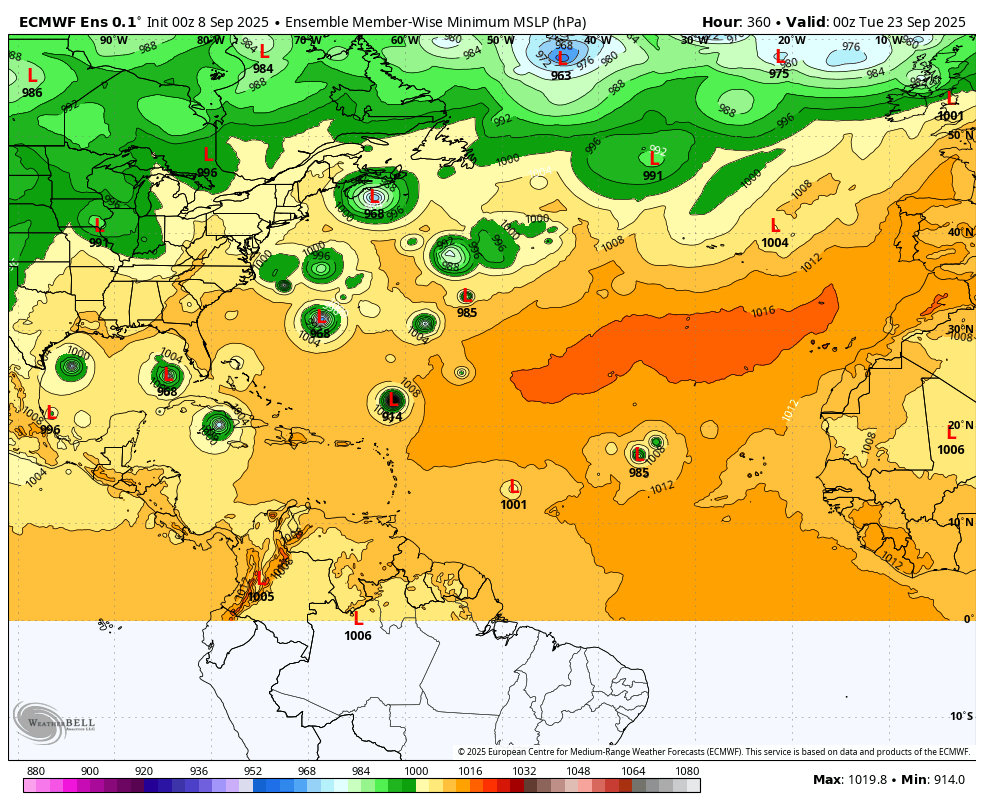
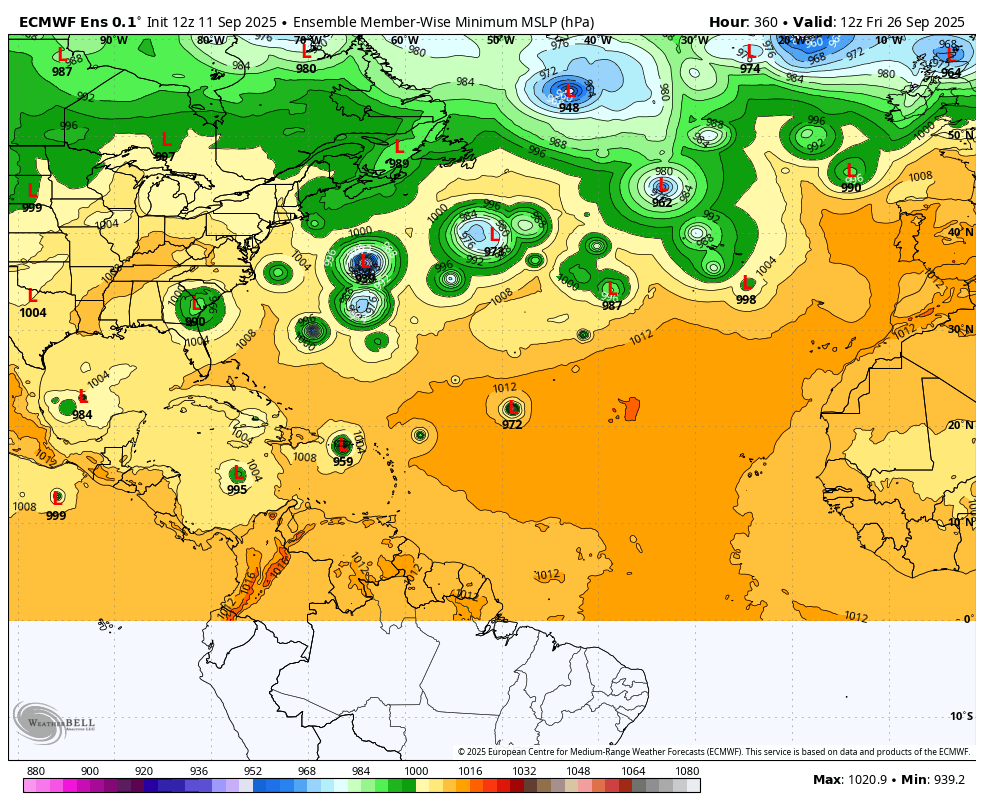
This was the Surface Low Pressure forecasts for the different European Ensemble model individual member forecasts from the last 12z run for September 12th, 360 hours/15 days from now.
The Atlantic Basic is coming to life with tropical activity!! This is also approaching the season peak, along with the warm waters and the MJO in a favorable phase.
Hopefully, these storms will not threaten the US with any direct hits.
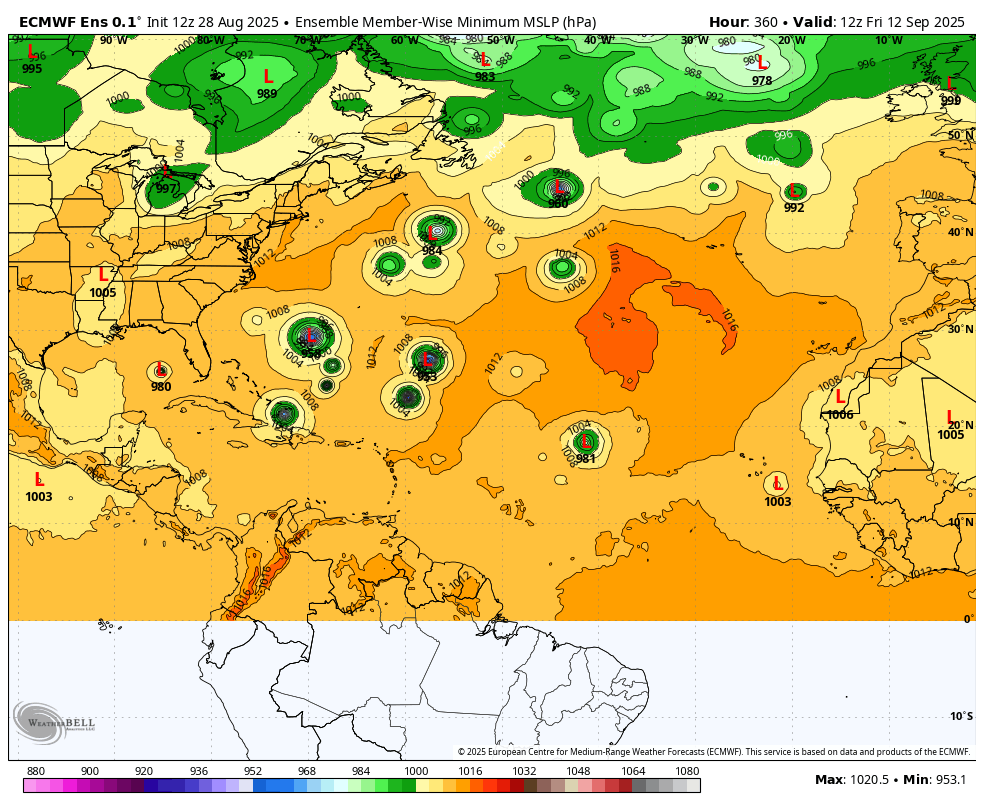
The tropics will be EXPLODING with activity in week 2! These are all the individual solutions for SLP from the Europe Ensemble model. There may be 3 different storms going at the same time.
1. Day 7: Birthplace for new storms
2. Day 10: Storms develop and move west
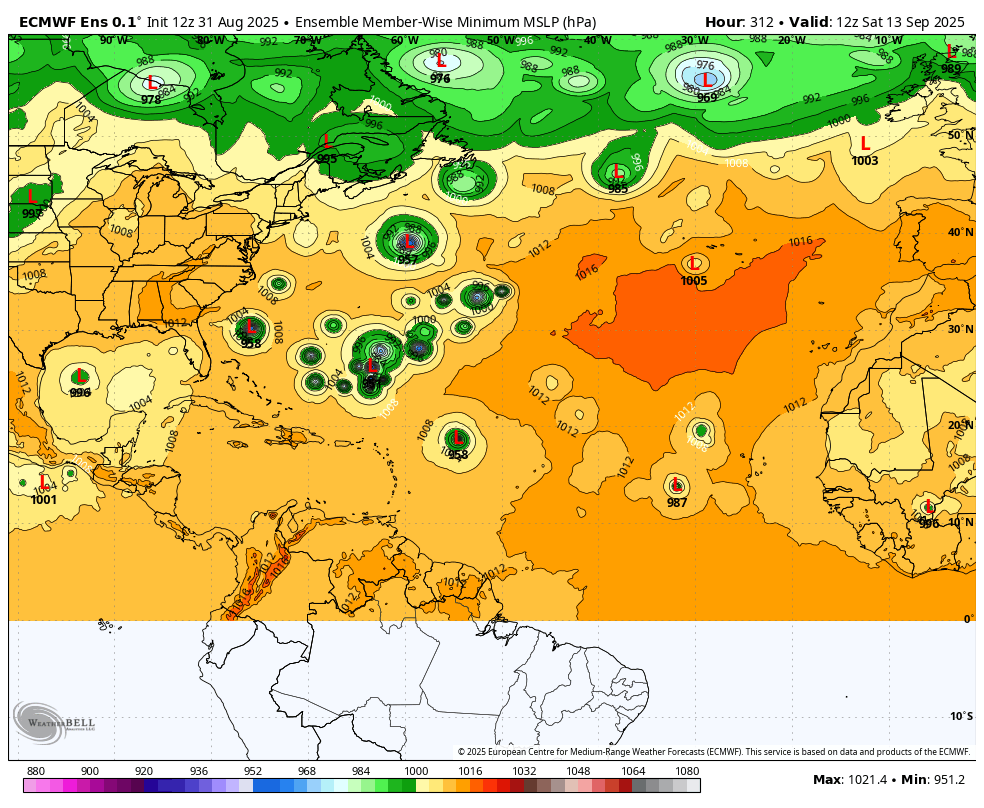
3. Day 13: Storms develop, move west and turn sharply north before hitting the US Coast, though a couple of outliers hit the US, including an outlier in the Gulf of Mexico.
4. Day 15: Same extremely active pattern continues. Most likely paths are similar to Erin, WELL off the East Coast. However, there are a couple of solutions that hit the East Coast or Gulf of Mexico but they are close to outliers.
Very interesting ,Mike
Thanks
Oh. Didnt realize how that was graphed.
You're welcome, John!
The surface low pressure forecasts are all the different places that the individual ensemble members think that a storm could be in at a certain time frame. Most of them show a different location FOR THE SAME STORM. So it's not like the different locations mean different individual storms, although its likely that there will be more than 1 at the same time.
Here's that same product, from the last 0z European Ensemble Model. This is for Surface Low Pressure and dozens of individual members of the ensemble model.
1. 7 days out. There is some VERY strong agreement on a storm in that vicinity(each solution is a tiny bit different), so confidence is fairly high.
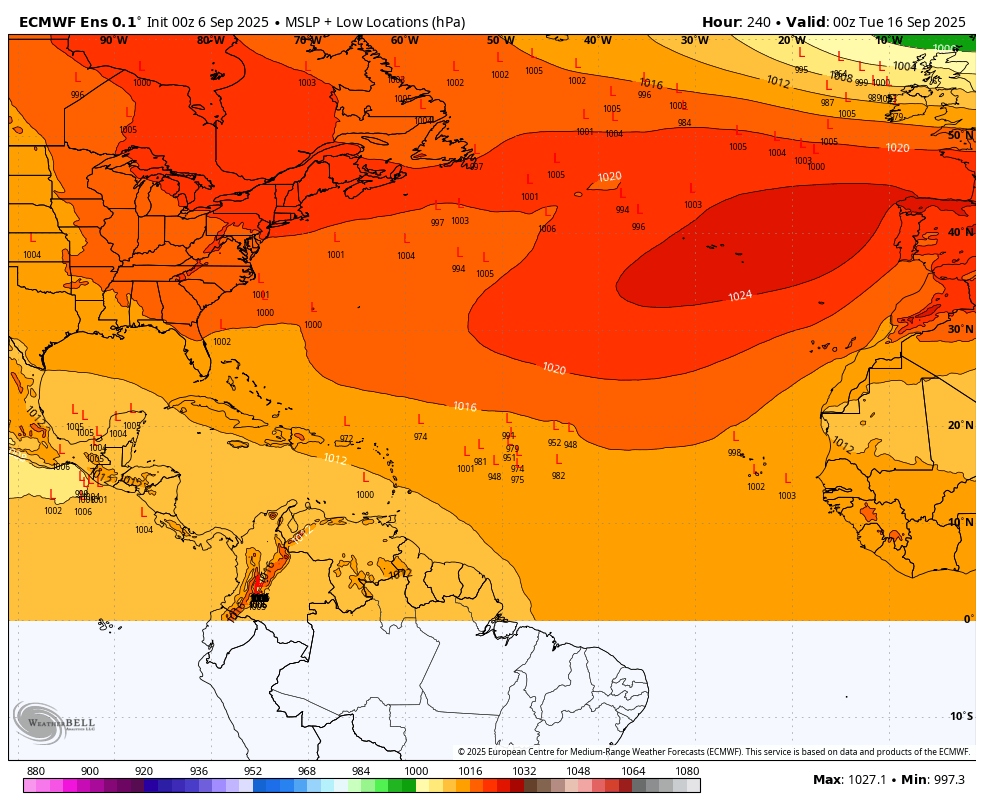
2. 11 days out. Location and intensity spread is pretty wide that far out but it does look active. Storms look like they will make a north turn as they approach the United States. A couple of outliers allow a storm to track or develop into the Gulf of Mexico!
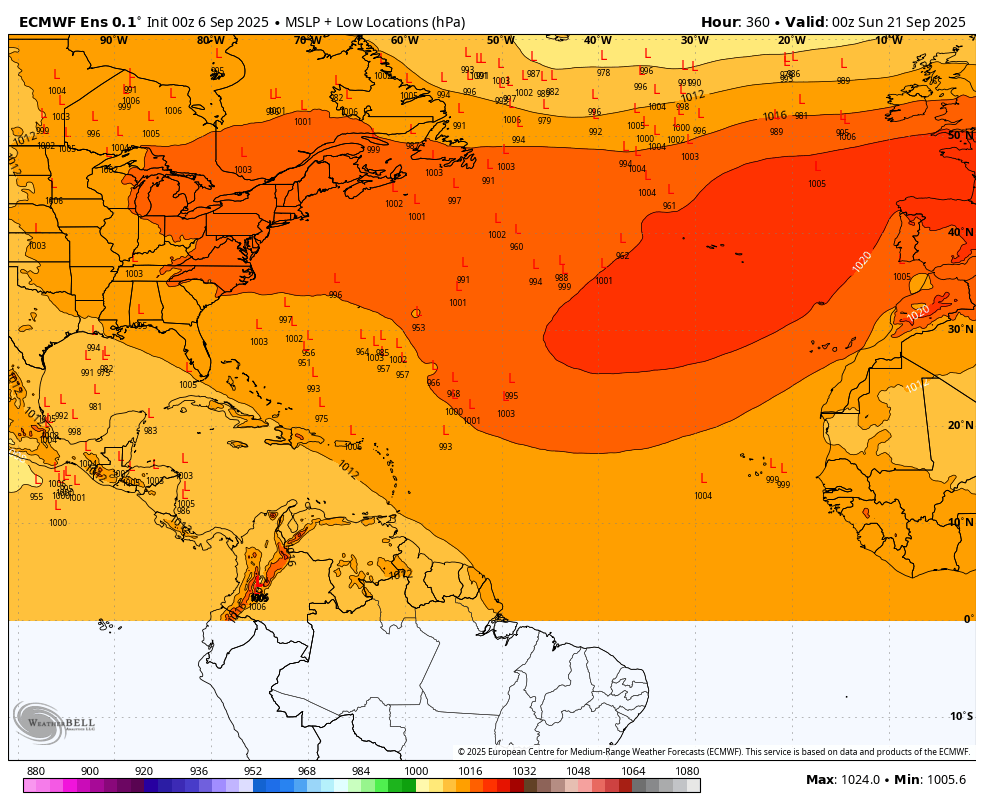
3. 15 days out. New disturbances being generated in the East Tropical Atlantic, which will likely end up as week 3 storms/hurricanes as they track west in the tropical Atlantic.
The best POTENTIAL news is that the consensus solutions do not target the US thru around day 10. However the uncertainty and threat in 2 weeks is elevated compared to the periods before that.
9-6-25 update: Down to a 30% chance of this turning into a depression!
Still pretty quiet but not for long:
 |
Tropical Storm Gabrielle May Form By This Weekend And Is An Increasing Lesser Antilles Threat Next WeekA tropical wave may develop into Gabrielle as soon as this weekend in the eastern Atlantic Ocean. Here's our latest forecast thinking on its future next week and beyond.https://weather.com/storms/hurricane/news/2025-09-02-tropical-storm-gabrielle-atlantic |
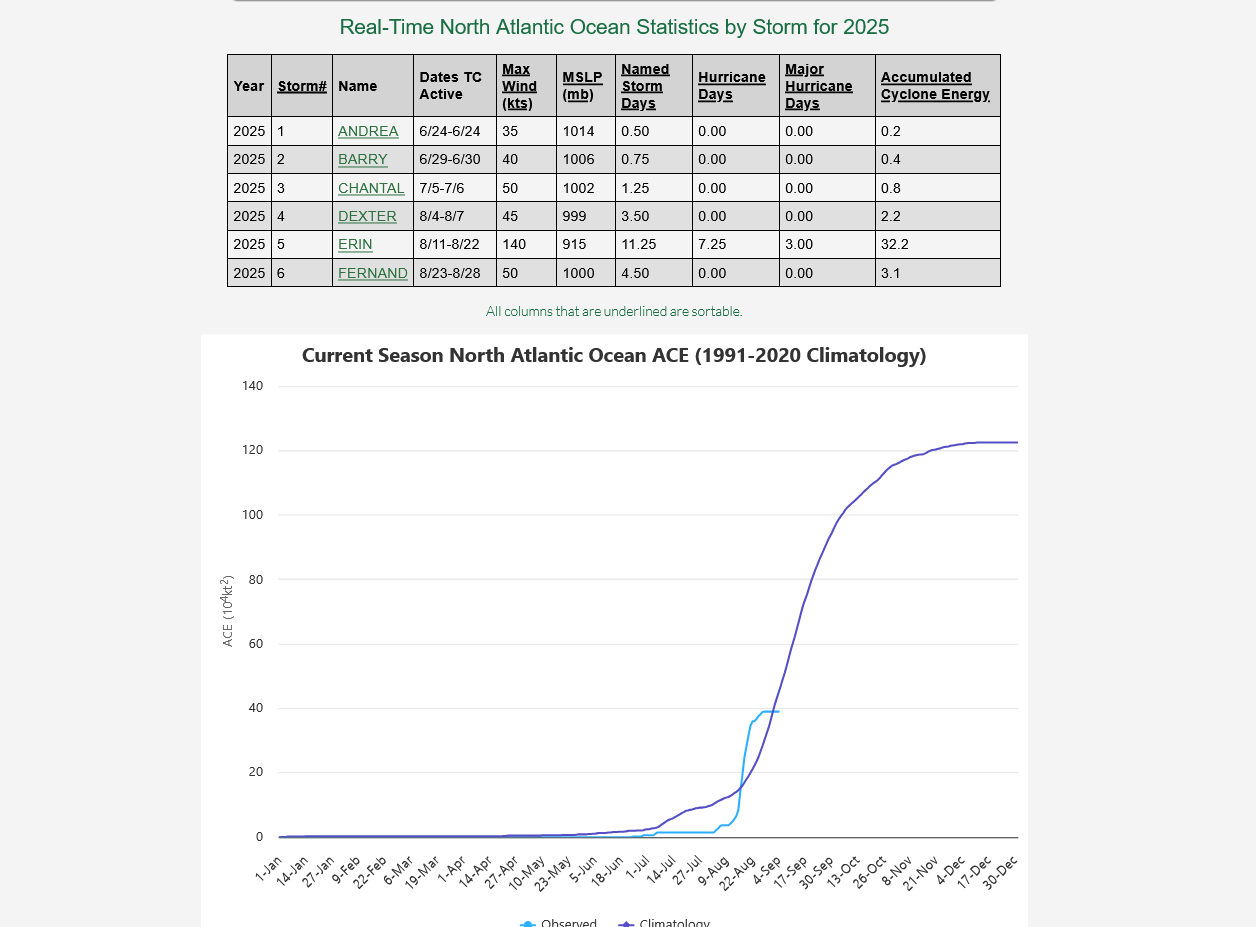
After the huge boost up from Erin last month, ACE in the tropical Atlantic basin has dropped below average again:
https://tropical.atmos.colostate.edu/Realtime/index.php?loc=northatlantic
Pretty quiet tropics for this time of year for the next days. Then much more active:
Day 5 outlook from the European Ensemble model with individual solutions. Still quiet.
Day 10 from the same model: Tropical systems possible in numerous locations!
Day 15: Storms maturing as they move west. Some threatening the United States. Some could be major hurricanes. This product has very skill this far out for any one solution. However it does a good job for identifying likely locations and potential intensities.
1. Day 5: Still quiet
2. Day 10: US still safe but activity in the tropical Atlantic basic is picking up
3. Day 12: United States becoming a potential target, maybe the Gulf of Mexico.
3. Day 15: Gulf of Mexico is a legit, potential target
This is quite unusual as we are in the period that typically features the highest tropical activity of the year, until the end of the month.
However, the models still think we will increase the activity...but not as much as previous forecasts.
Crazy quiet in the tropics right now as we enter the most active period on a historical average basis:
1. The European Ensemble solutions have a significant system on day 10 below;
2. This was the 15 day forecast from the same, last 12z run.
Thanks, Mike!
I think it’s absolutely fascinating what’s been going on this Sept so far. The last time Sept had no TC this far into the month was way back in 1992! It had its first Sep TC on Sep 17th. If 2025 doesn’t get a TD+ by Sep 17th (going to be close because of many models progging the current E MDR AEW to become a TD near or just after that day; also have to make sure the low off NC doesn’t do the same), then 2025 would have the latest 1st Sep TC since 1939’s Sep 23rd!
Any predictions on whether either the current MDR AEW or the low off of NC will reach TD status by Sept 17th?
Very amazing, Larry. Very unexpected too!
And the storm that broke the dry spell in 1992 was Hurricane Andrew.
That was so far back that I was still chief meteorologist at WEHT-TV back then!
https://www.youtube.com/watch?v=-w7_CLn8QSs
We talked to the experts to find out what's going on in the tropics and if it will last.
https://www.fox4now.com/weather/hurricane-center/why-is-the-peak-of-hurricane-season-so-quiet
+++++++++++++++++++++++++=
I've not actually been looking close enough at the tropics from day to day and comparing them to previous years to have a great answer or explanation.
However, I do follow the mid latitude weather patterns as close as anybody. The most noteworthy feature during this same period is depicted below.
This is pretty dang extreme for the mid latitudes. As you know, there are teleconnections in the atmosphere where major, large scale features in 1 place, interact with/correlate with and cause features in places thousands of miles away.
This is just strong postulating on my part but I also remember how cool the Summer of 1992 was(from the eruption of Mt. Pinatubo) and will use the next page to apply that.
+++++++++++++++++++++==
Re: Re: Re: Re: Re: NG 8/4/25+
By metmike - Sept. 5, 2025, 12:38 p.m.
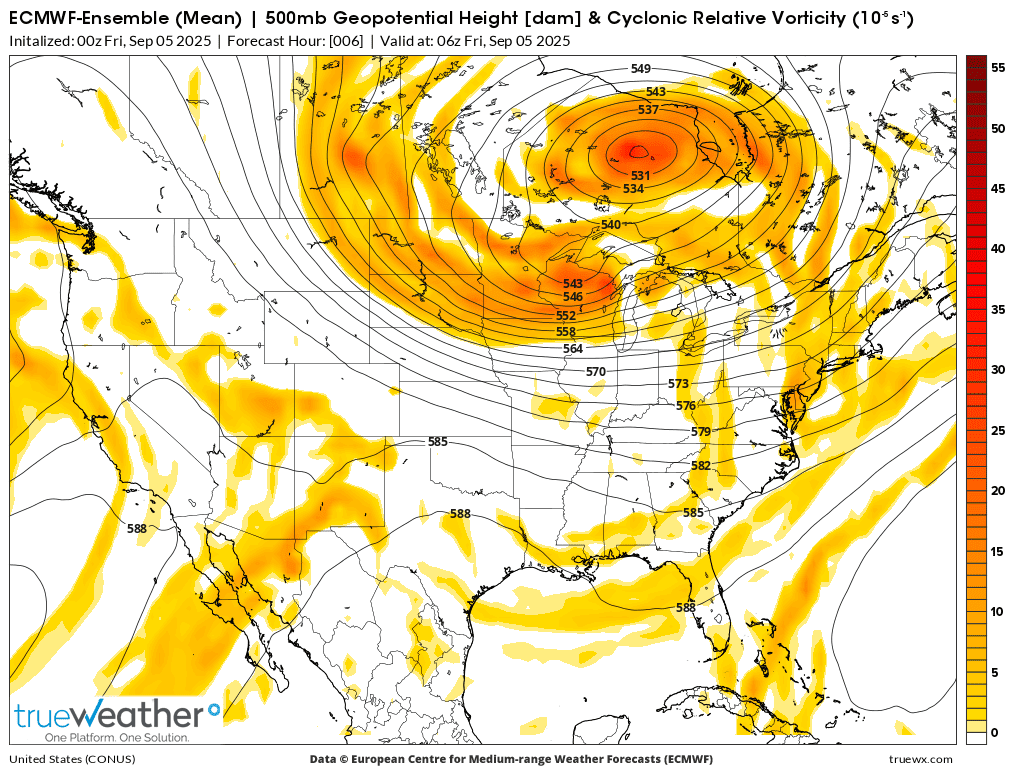
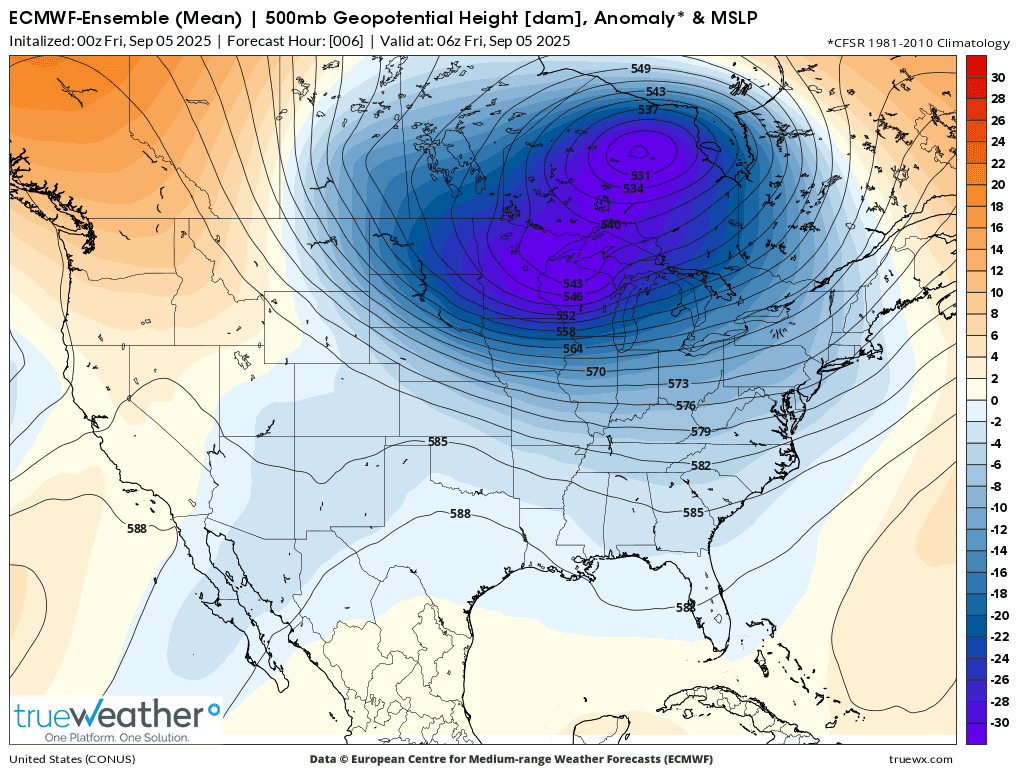
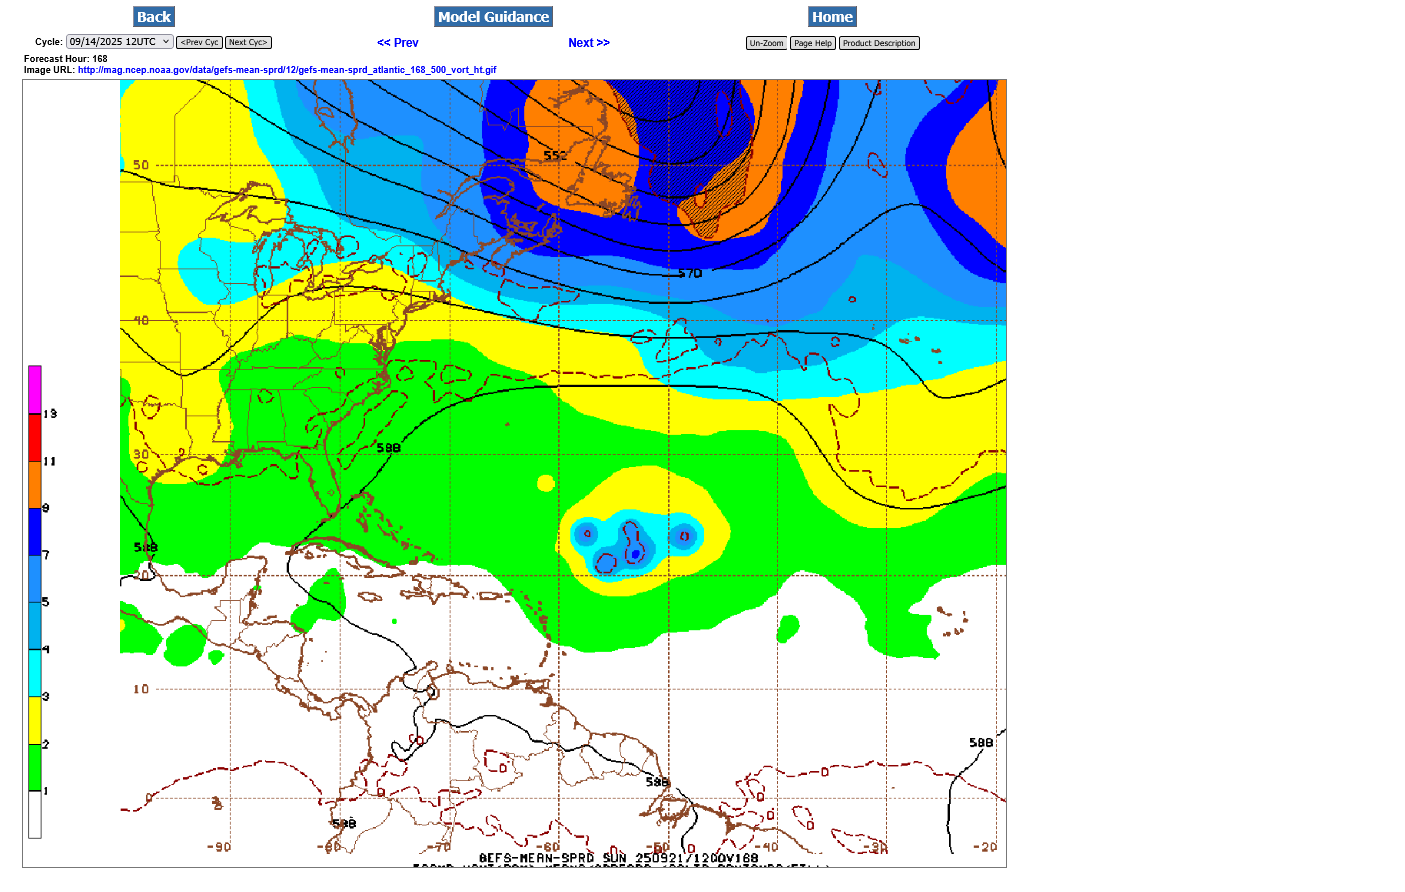
Here's the European Ensemble model at 500 mb.
1. Vorticity/spin. Spokes of vorticity rotating around the backside of the DEEP Low(north of Lake Superior) are a reinforcement of this near record ARCTIC cold.
2. Departure from average for September 5th. This is a COLD SEASON pattern with the polar vortex displaced extremely far south!
+++++++++++++++++
https://www.cpc.ncep.noaa.gov/products/tanal/temp_analyses.php
One of the biggest reasons for hurricanes and not often discussed is that they help to redistribute heat and balance heat/temperatures on the planet.
The tropics, with their high sun angle accumulate heat. The Arctic, with the low to no sun lose more heat.
This creates a strong temperature gradient with latitude. This causes a strong pressure gradient and along with the spin of the earth/Coriolis Force, we have moving and developing areas of high and now pressure with their associated circulations. These weather systems transport massive amounts of excessive heat pole ward that dislodge the cold air at high latitudes pushing southward.
In essence, this is the process of redistributing heat ongoing 365 days/year with constant, extreme variations.
When temperatures in the ocean get warm enough in the Summer and other conditions are favorable the atmosphere can generate tropical systems that are heat engines.
https://personal.ems.psu.edu/~nese/ch11sec3.htm
++++++++++++=
These heat engines EXHAUST excessive heat AWAY from the areas of the planet that have excessive heat. Like other weather systems driven by the dynamics described above, they help to redistribute and balance the huge disparity in heat/temps from south to north.
Related to this and the current, 2025 correlation to 1992.
I showed the extreme, Winter like upper level pattern of the atmosphere on the previous page from recent weeks.
A similar but much more pronounced and long lasting pattern existed at this time frame in 1992. In that case from the impact of the eruption of Mt. Pinatubo in 1991 and the volcanic ash cooling the planet.

How is this impacting the tropics??????
Well for sure, with a deep trough extending so far south and east, there is no chance for a tropical system to approach those areas.
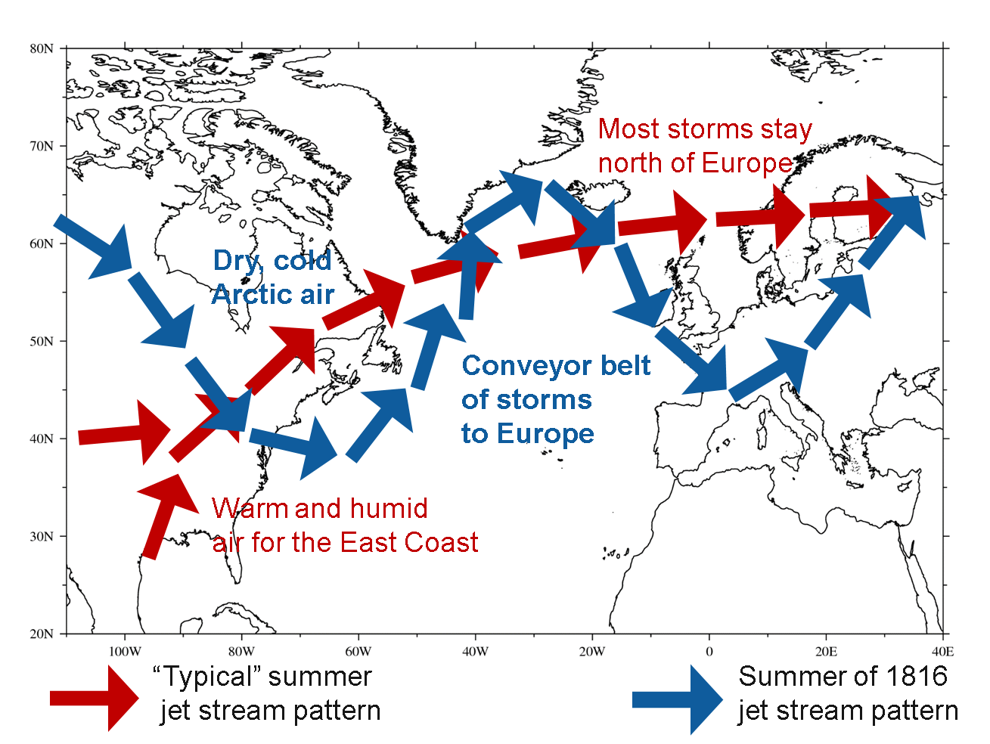
So let's expand more on this, using a depiction of the most amplified version of this pattern, for the Year without a summer, 1816(after an even bigger volcanic eruption cooled the planet).
1. The red arrows below, depict a typical Summer jet stream. Bermuda High to the East Coast, jet stream deflected to the far north. Warm tropical Atlantic having minimal wind shear. ***The planet accumulating excessive heat in the lower/mid latitudes.
2. Blue arrows during very chilly Summers like 1992, 1816 and recently, 2025. Strong jet stream unusually far south. Keeping any tropical systems, if they developed from getting close to the jet stream which would steer them away or rip them apart. Increasing wind shear in the tropics? ****Unusually strong transport of colder Arctic air from the high latitudes to lower latitudes which redistributes the unbalanced heat in a way that normally doesn't happen in Summer. This could be REDUCING the need for hurricanes that do the same thing at this time of year. ****That last part is speculative based on indirect mechanisms but the first part is a direct impact via the teleconnections of extremely deep upper level troughs in the East.
What do you think, Larry?
The current wave has a pretty good chance to break the streak and get a name by this next weekend:
|
This is what all the solutions from the just out 12z European Ensemble think for Surface Low Pressure in 7 days. It continues to curve northward and miss the United States to the far east:
The upper levels at that time will be more favorable for development with a big Bermuda High across the Atlantic(we can see the tropical system underneath that).
When it gets farther west, it will be steered farther north, then northeast around the western periphery of the Bermuda High. There's a mid latitude trough in the Midwest at that time.
Hey Mike,
That’s an interesting theory that makes sense. However, my search for a clearcut correlation between a cool E US Sept and low Sept ACE wasn’t successful though a slight correlation might exist.
Thanks, Larry.
The correlation is not just with cool but with extremely anomalous, large scale, super deep troughs
(the base of which extends to the Gulf Coast) that completely bump the Bermuda High well out into the Atlantic.
Only a few of those the past 100 years.
I notice 1983 was the complete opposite with record heat in the Midwest and record LOW tropical activity. Maybe the Bermuda High too far west.
Atlantic Basin Storm Totals by Year (including subtropical cyclones)
https://www.nhc.noaa.gov/climo/images/AtlanticStormTotalsTable.pdf
However, the ENSO status and MJO probably are much more important overall. I would be the MJO has not been favorable the last several weeks but haven't looked.
Saharan Dust and dry air in the Atlantic are important and I haven't tracked those. What say you, Larry?
On the redistribution of temps with latitude, that's wild speculation about being a direct factor in 2025, though the teleconnection factor is more based on meteorology. I just haven't looked at the teleconnections at all recently.
Thanks, Mike. Can you locate specific Septembers with that a strong mean E US to Bermuda upper trough pattern? Where would you find that? I don’t think finding that is easy. And then, where do you draw the line. If there were a good list of Septembers that qualify, I’d be looking at those Septembers to see how their ACE was.
I don't know where to find that, Larry.
On the tropics, there are plenty of people smarter than me, including you being one of them on lots of tropical stuff, so i wouldn't worry about doing a comprehensive analog analysis.
I haven't been watching the MJO recently and that one is easy to track. Do you know what thats been?
Mike said: “I haven't been watching the MJO recently and that one is easy to track. Do you know what thats been?”
——————
Hey Mike,
It was in low to mod amp phase 2 Sept 2-8 followed by mid to low amp phase 3 Sept 9-13. It is now going clockwise and thus backing up toward 8/1, which on average in Sept is favorable for development at least in the W portion of the Atlantic basin. It will support the current wave that has a 20%/70% chance for development. But then again, the MJO will tell a forecaster only so much.
*Edited for correction: clockwise, not counterclockwise!
Excellento, Larry!
https://www.nature.com/articles/s41467-023-39467-5?fromPaywallRec=false
https://www.aoml.noaa.gov/the-atlantic-nino-el-ninos-little-brother/
https://www.frontiersin.org/journals/earth-science/articles/10.3389/feart.2022.934654/full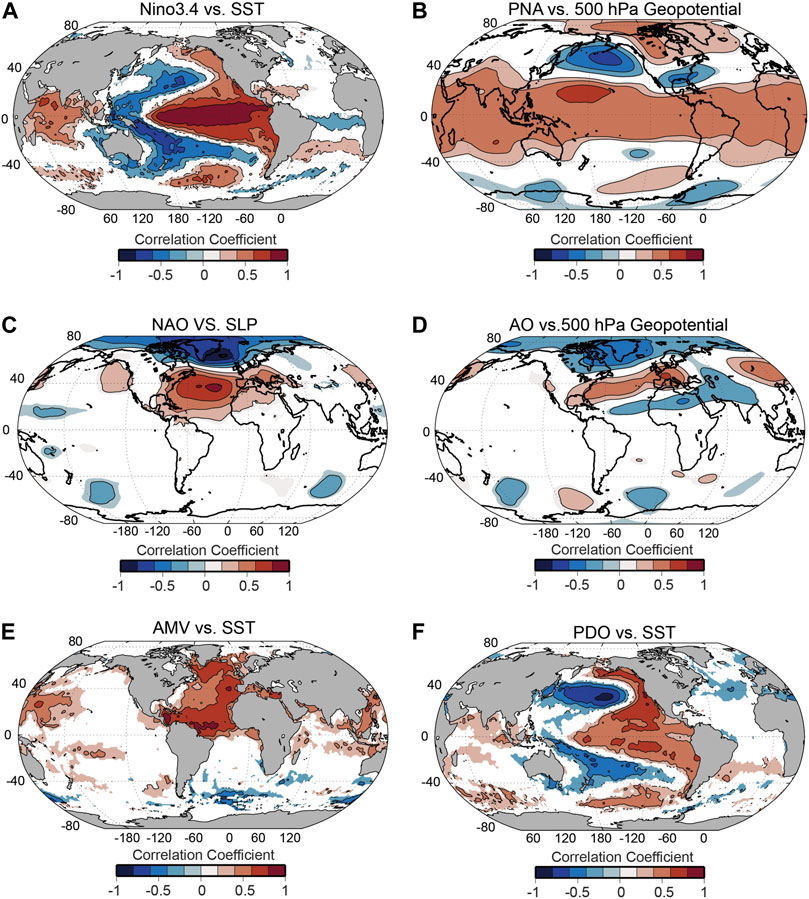
++++++++++++++++
https://agupubs.onlinelibrary.wiley.com/doi/full/10.1029/2022JD038107
The NAO is known to also influence upper-level winds across the subtropics (Cassou et al., 2004; Kushnir et al., 2006; Sutton et al., 2000; L. Zhang et al., 2022); similarly, TC activity (Gray, 1984) and structure (Chen et al., 2006; Rogers et al., 2003) are known to be modulated also by variations in the vertical wind shear. Hence, we investigate the NAO-related changes in vertical wind shear. The LF-NAO composites are associated with a tripolar wind shear structure spanning the entire basin: during NAO+ hurricane seasons, positive wind shear anomalies are present between 10 and 20°N and north of 50°N. Conversely, the latitudinal belt between 20 and 50°N is largely occupied by a negative anomaly. The reverse pattern is observed during the NAO− regime (Figures 10a and 10b), where wind shear is significantly weaker than average across the entire MDR and the Caribbean basin. The regression coefficient map Figure 10c confirms that deep-layer wind shear is negatively correlated with the LF-NAO. While the unfiltered NAO composites feature similar tripolar wind shear anomalies, they differ significantly from the LF-NAO ones (Figures 11a and 11b): the wind shear anomalies are larger in magnitude but they mostly affect the subtropics and the mid-latitude, leaving regions of climatologically high TC activity such as the MDR and the Caribbean basin largely unaffected (Figure 11c).

Low-frequency North Atlantic Oscillation (NAO) composite wind shear anomaly: (a) NAO+ (top tercile), (b) NAO− (bottom tercile) and (c) wind shear anomaly regression coefficient from Equation 6; the contoured-dotted area indicates statistically significant coefficients at the 95% confidence level.

Unfiltered North Atlantic Oscillation (NAO) composite wind shear anomaly: (a) NAO+ (top tercile), (b) NAO− (bottom tercile) and (c) wind shear anomaly regression coefficient from Equation 6; the contoured-dotted area indicates statistically significant coefficients at the 95% confidence level.
Thanks again for assessing the recent MJO, Larry!
Wonderful study below!

Research Letter
Open Access
https://agupubs.onlinelibrary.wiley.com/doi/10.1029/2023GL106872
The results from this study demonstrate that the MJO phase several weeks prior to a given period may be just as important as the current MJO phase in determining subseasonal TC activity in the Atlantic, which suggests that the relation between the MJO and Atlantic TC activity is more complicated than the MJO producing favorable or unfavorable conditions in the Atlantic. We hypothesize and provide evidence that a delayed response from the MJO in the WNP through mid-latitude interactions is important for subseasonal TC activity in the Atlantic, although this requires more analysis. Most importantly this work can be used to improve subseasonal TC prediction. By understanding the propagation paradigm of the MJO, we have gained a new source of predictability not currently used in subseasonal forecasts and we can potentially use this to predict active TC periods in the Atlantic with higher confidence.
+++++++++++++
The link between Atlantic tropical activity with the MJO and ENSO is indisputable but complicated by many other factors.
The MJO and ENSO are features with strong teleconnections in the same stream flow(tropics) which are upstream from the Atlantic tropics, so it makes the most sense to analyze the downstream impact of their various states.
However, I continue to feel that a super anomalous NORTHERN STREAM state, like we had in 1992 and in 2025 can deflect that typical southern stream impact farther south. There are likely no studies that address this in a comprehensive fashion (that I can find at this point) because it's so extraordinarily rare.
Everyone has been keying off of the usual indicators for Atlantic tropical activity and everybody's forecast for Atlantic activity has been wrong in September, including mine which was especially rooted in the European Ensemble model.
As mentioned previously, the tropics are NOT my meteorological area of expertise, so any forecasts that I pass on are not capable of beating the models or other more experienced/skilled tropical activity forecasters, including you!
However, AFTER the fact analysis of the meteorology like this is a different animal than forecasting BEFORE something happens. After it happens, there are trails and fingerprints left behind which allow us to back track and come up with potential and likely explanations. In this case, I'm suspecting the northern stream based on following the extreme nature of the northern stream recently which almost never matters in August and September. But we had a rare December/January type northern stream(record cold in the age of global warming is astounding) which almost never happens.
I am not insisting that was the culprit, just that it's presence, for sure introduced a unique teleconnection from the north that potentially bumped out or shifted the ENSO stream.
For every action, there is a reaction in the opposite direction in the atmosphere. To be specific we need to ask ourselves, when this extraordinarily rare action below happened recently, what was the reaction elsewhere, especially downstream in the Atlantic?
This is just the definition of teleconnections but in a realm not explored because of the rarity.
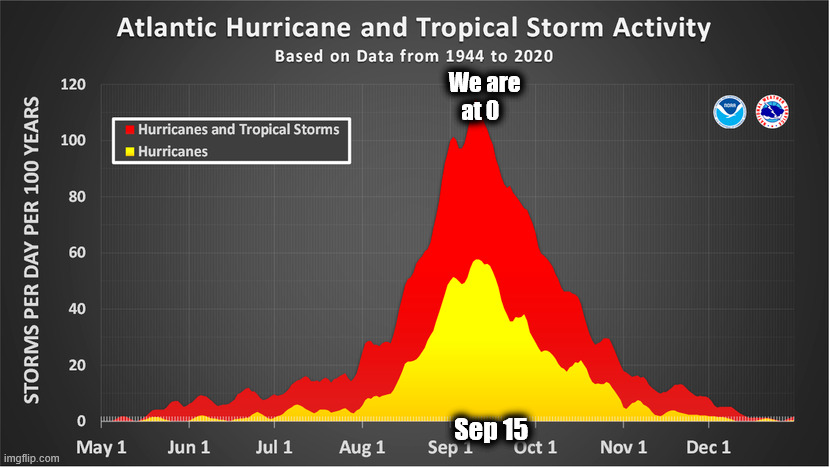
Just to review the seasonal/historical average again below and where we are right now to demonstrate how unusual this year has been with 0 tropical systems so far this month.
ttps://www.nhc.noaa.gov/climo/
Up to 80% chance of this system below developing in the next week!
This would break the tropical storm drought of September 2025.
|
Thanks, Mike.
Unfortunately, that extra level of protection to the US from the unusually deep E US upper trough may not carry over to the late season climo favored W Caribbean centered area of genesis, which for US threat potential starts to dominate next week. What’s got me a little worried is:
-the last 2 days of Euro Weeklies (EW) have 120-150% of the active 2005-24 avg ACE starting next wk for 3 wks, which adds to ~42 ACE 9/22-10/12
-The good news is that a large portion of the 9/22-28 ACE is being generated by the current MDR AOI, which appears based on great op/ens agreement to be an easy safe recurver from the US.
-But there’s some activity during that week in W Car/Gulf
-And though some of the 9/29-10/12 activity is well out in the Atlantic and thus not threatening, the W Car/Gulf activity level is even higher on the EW for 9/29-10/12 vs that of 9/22-28, which is consistent with peak climo for that region
-I sincerely hope this relative “dud” of a season continues, especially after the overall high impact to the SE US and Gulf during 2016-24. We are so overdue for a break. But with relatively dangerous ENSO on avg (weak La Niña), with late seasons recently being bad, and with what the most recent EWs have shown, the Conus will need good luck to get out of 2025 unscathed.
Thanks very much, Larry!
That's some excellent analysis. Hopefully, the models should be better able to track what's going on now.
That extremely deep trough/early September Polar Vortex is long gone.
Downstream impacts should be about gone, with the atmosphere re-configuring to the new alignment.
I was just remembering something and you might remember this too from the natural gas thread relating to the Polar Vortex. Starting early in August (when weeks 3-4 were still HOT for the US-and TS activity expected to be high on models) the models started latching on to a NEW, extremely anomalous pattern that blindsided everybody.
++++++++++++++++++++++++++++++
Re: Re: Re: Re: Re: Re: NG 8/4/25+
By metmike - Aug. 20, 2025, 6:37 a.m.
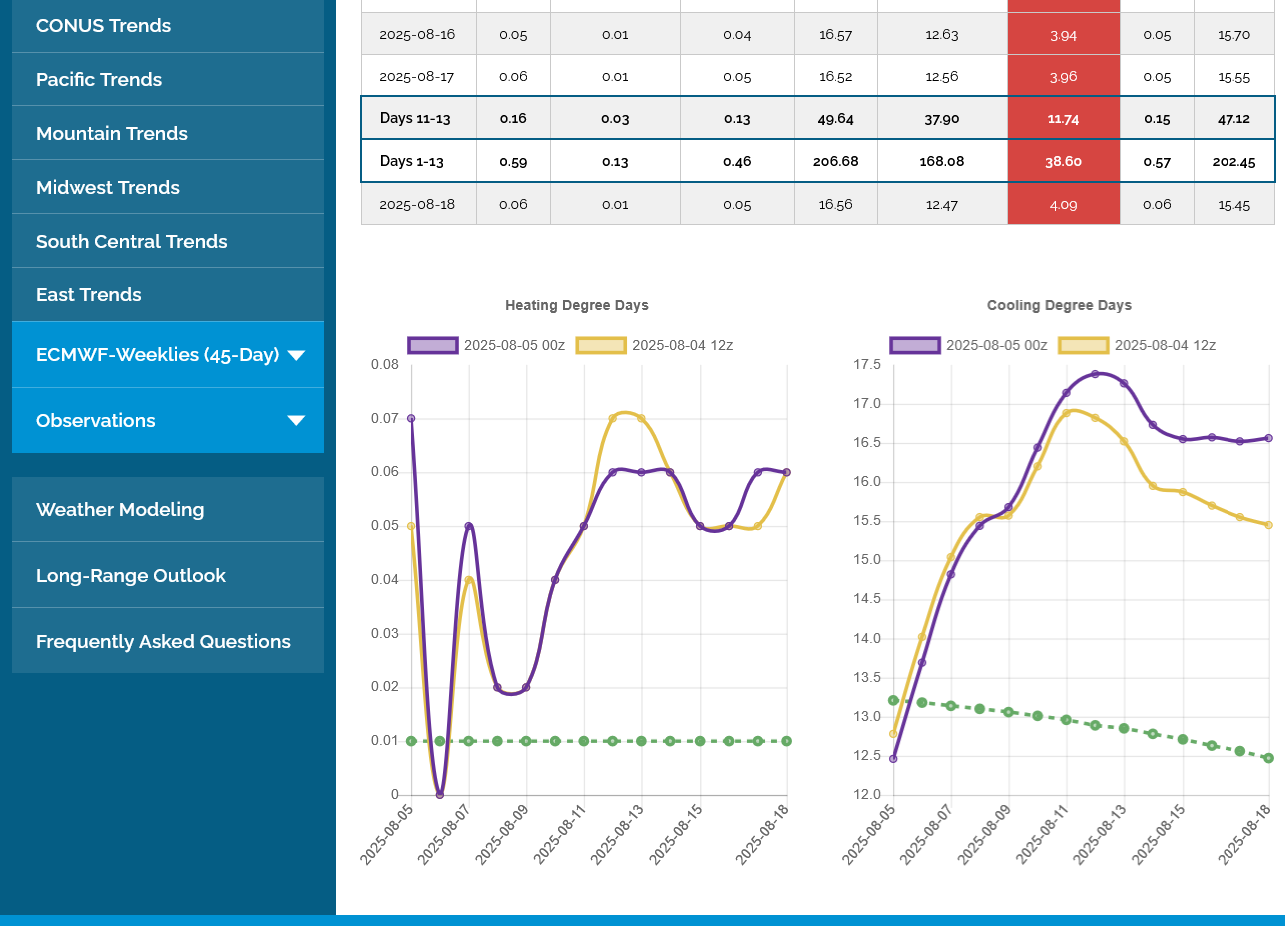
1. Another -4 CDDs on this last 0z European Ensemble mean model in purple/right compared to the previous 12z run 12 hours earlier! This is a 2 week forecast.
2. This is what the same forecast for the next 2 weeks(which have passed) looked like 2 weeks ago. The latest forecast are for NEW days, that were weeks 3-4 back then but its a display of how BEARISH the weather forecast updates have been for these new days as they've gotten cooler and cooler and cooler from the models picking up on a much stronger northern stream than anticipated.
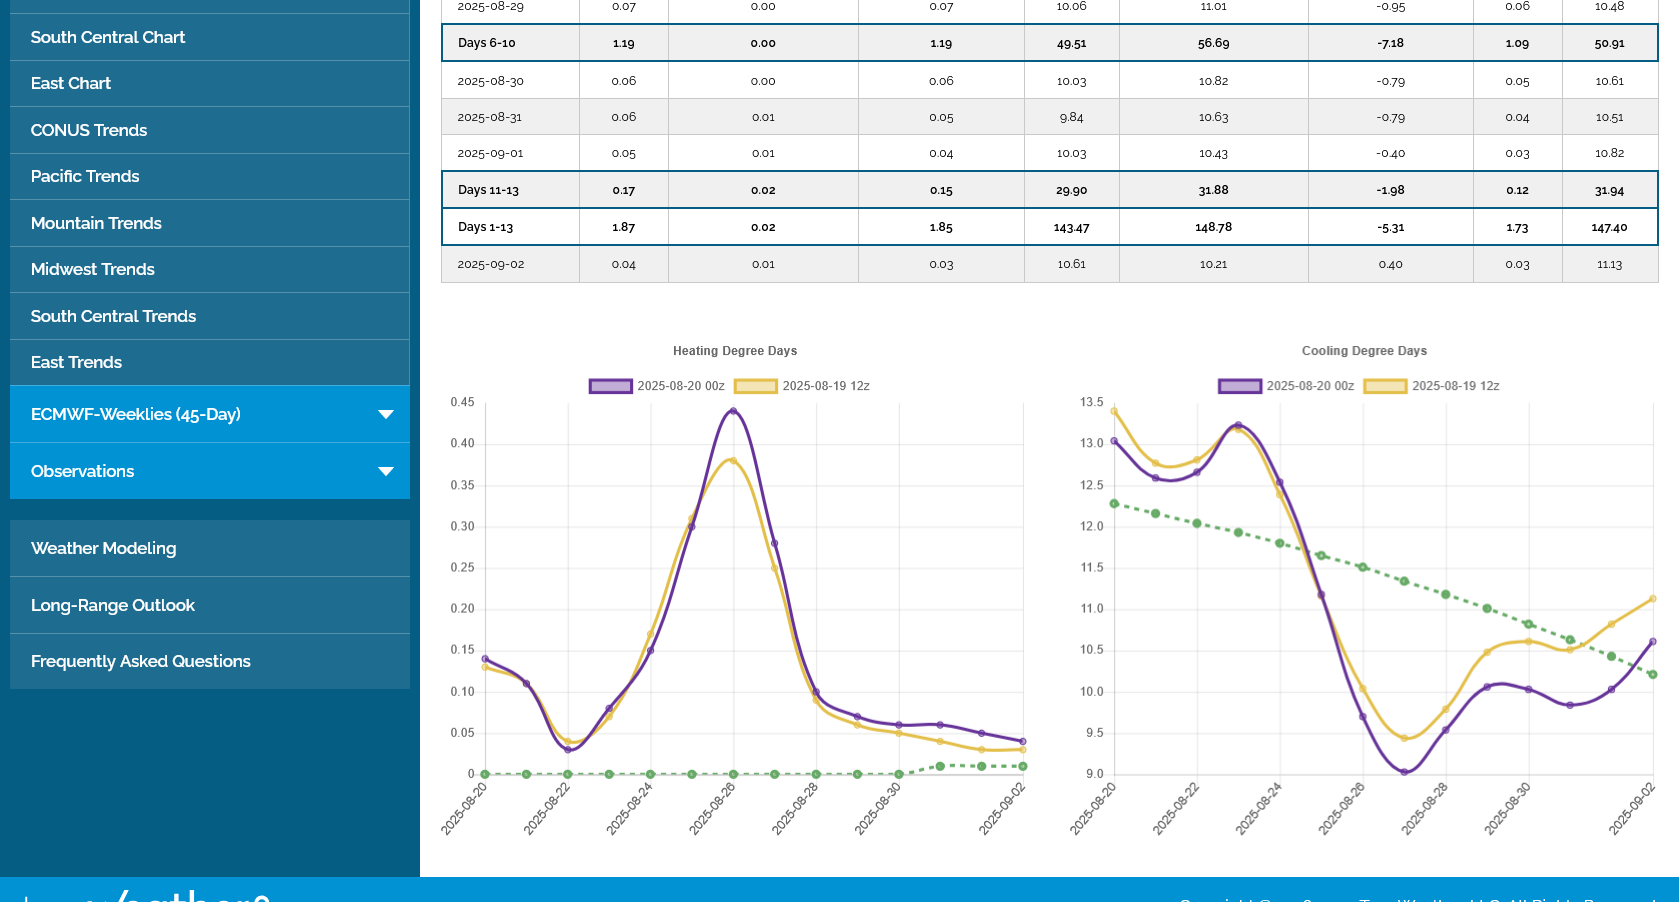
2 week forecast on 8-5-25. The last run or the EE in purple was even HOTTER that day. Note how far above the climatological average in green the CDDs were. There were +63 CDDs compared to the last one above.
+++++++++++++++++++
The MANNER in which we changed from record heat to record cold in August DURING THE AGE OF WELL DEVELOPED, RELIABLE MODELING is completely unprecedented. Almost 50 years ago, when I was in college at the University of Michigan looking at weather models for the first time, the longest model anybody had went out 72 hours.
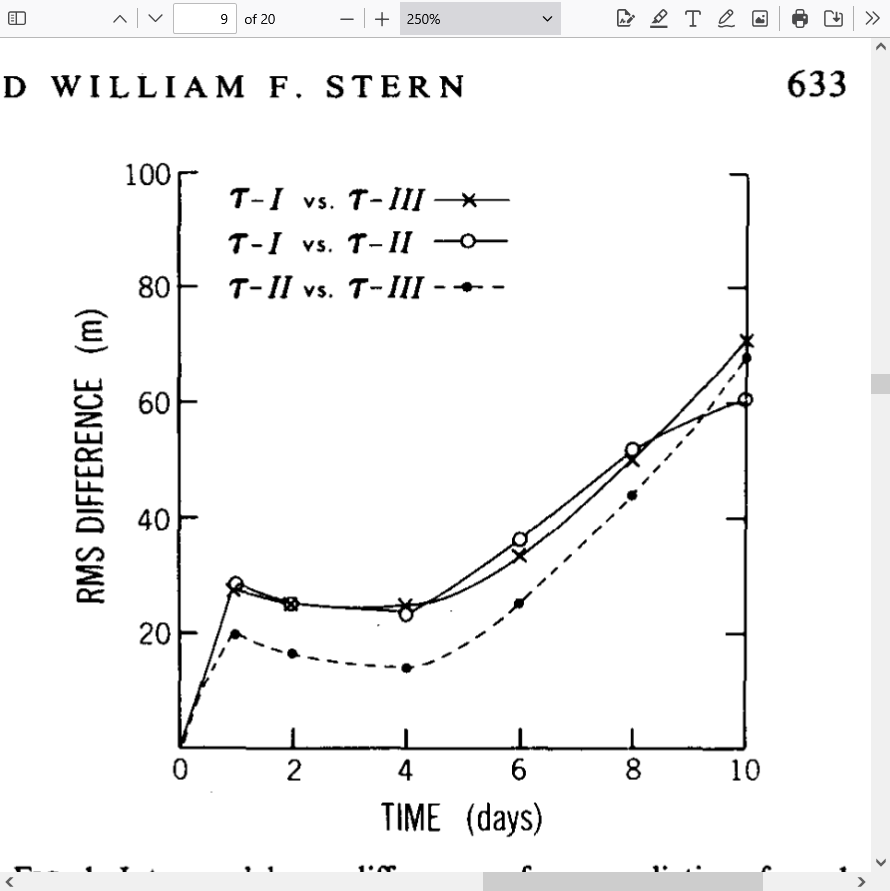
This 1982 paper is fascinating with that in mind. They were in the early stages of developing a 10 day model, which wouldn't be widely available for a decade later.
Note all the mathematical equations..........like reading a foreign language!!!
That was the language we used in so many different classes, learning and communicating about the physical laws that those equations represented.
I was soooooooooo celebrating when graduating from that (boring to me) stage to the stage of synoptic meteorology and weather forecasting that you and me love so much.
https://www.gfdl.noaa.gov/bibliography/related_files/tg8201.pdf
Tropics finally getting a bit more active!
90% of this becoming a tropical depression in the next 48 hours!
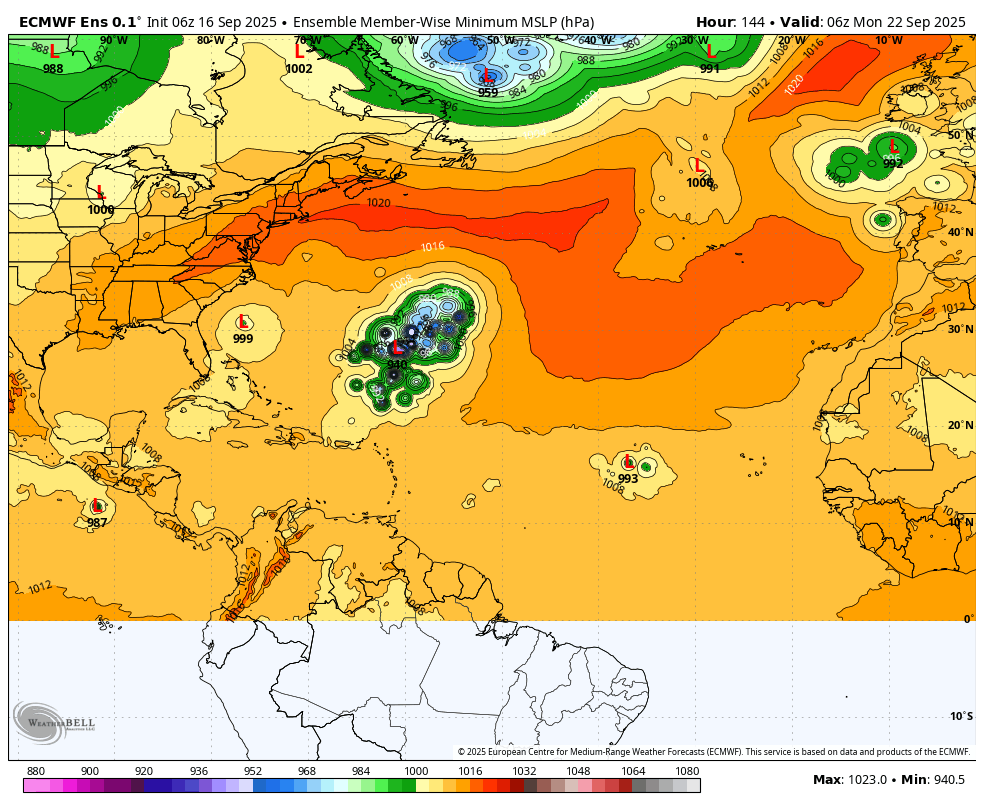
This was the 6 European Ensemble model Surface Low Pressure predictions for all the solutions in 6 days-144 hours. They are clustered in the same blob below.
Regardless of the strength, EVERY solution curves the path to the right/to the north, then northeast AWAY from the US East Coast.