August 2nd, 2025 by Roy W. Spencer, Ph. D.
https://www.drroyspencer.com/2025/08/uah-v6-1-global-temperature-update-for-july-2025-0-36-deg-c/
The Version 6.1 global average lower tropospheric temperature (LT) anomaly for July, 2025 was +0.36 deg. C departure from the 1991-2020 mean, down from the June, 2025 anomaly of +0.48 deg. C.
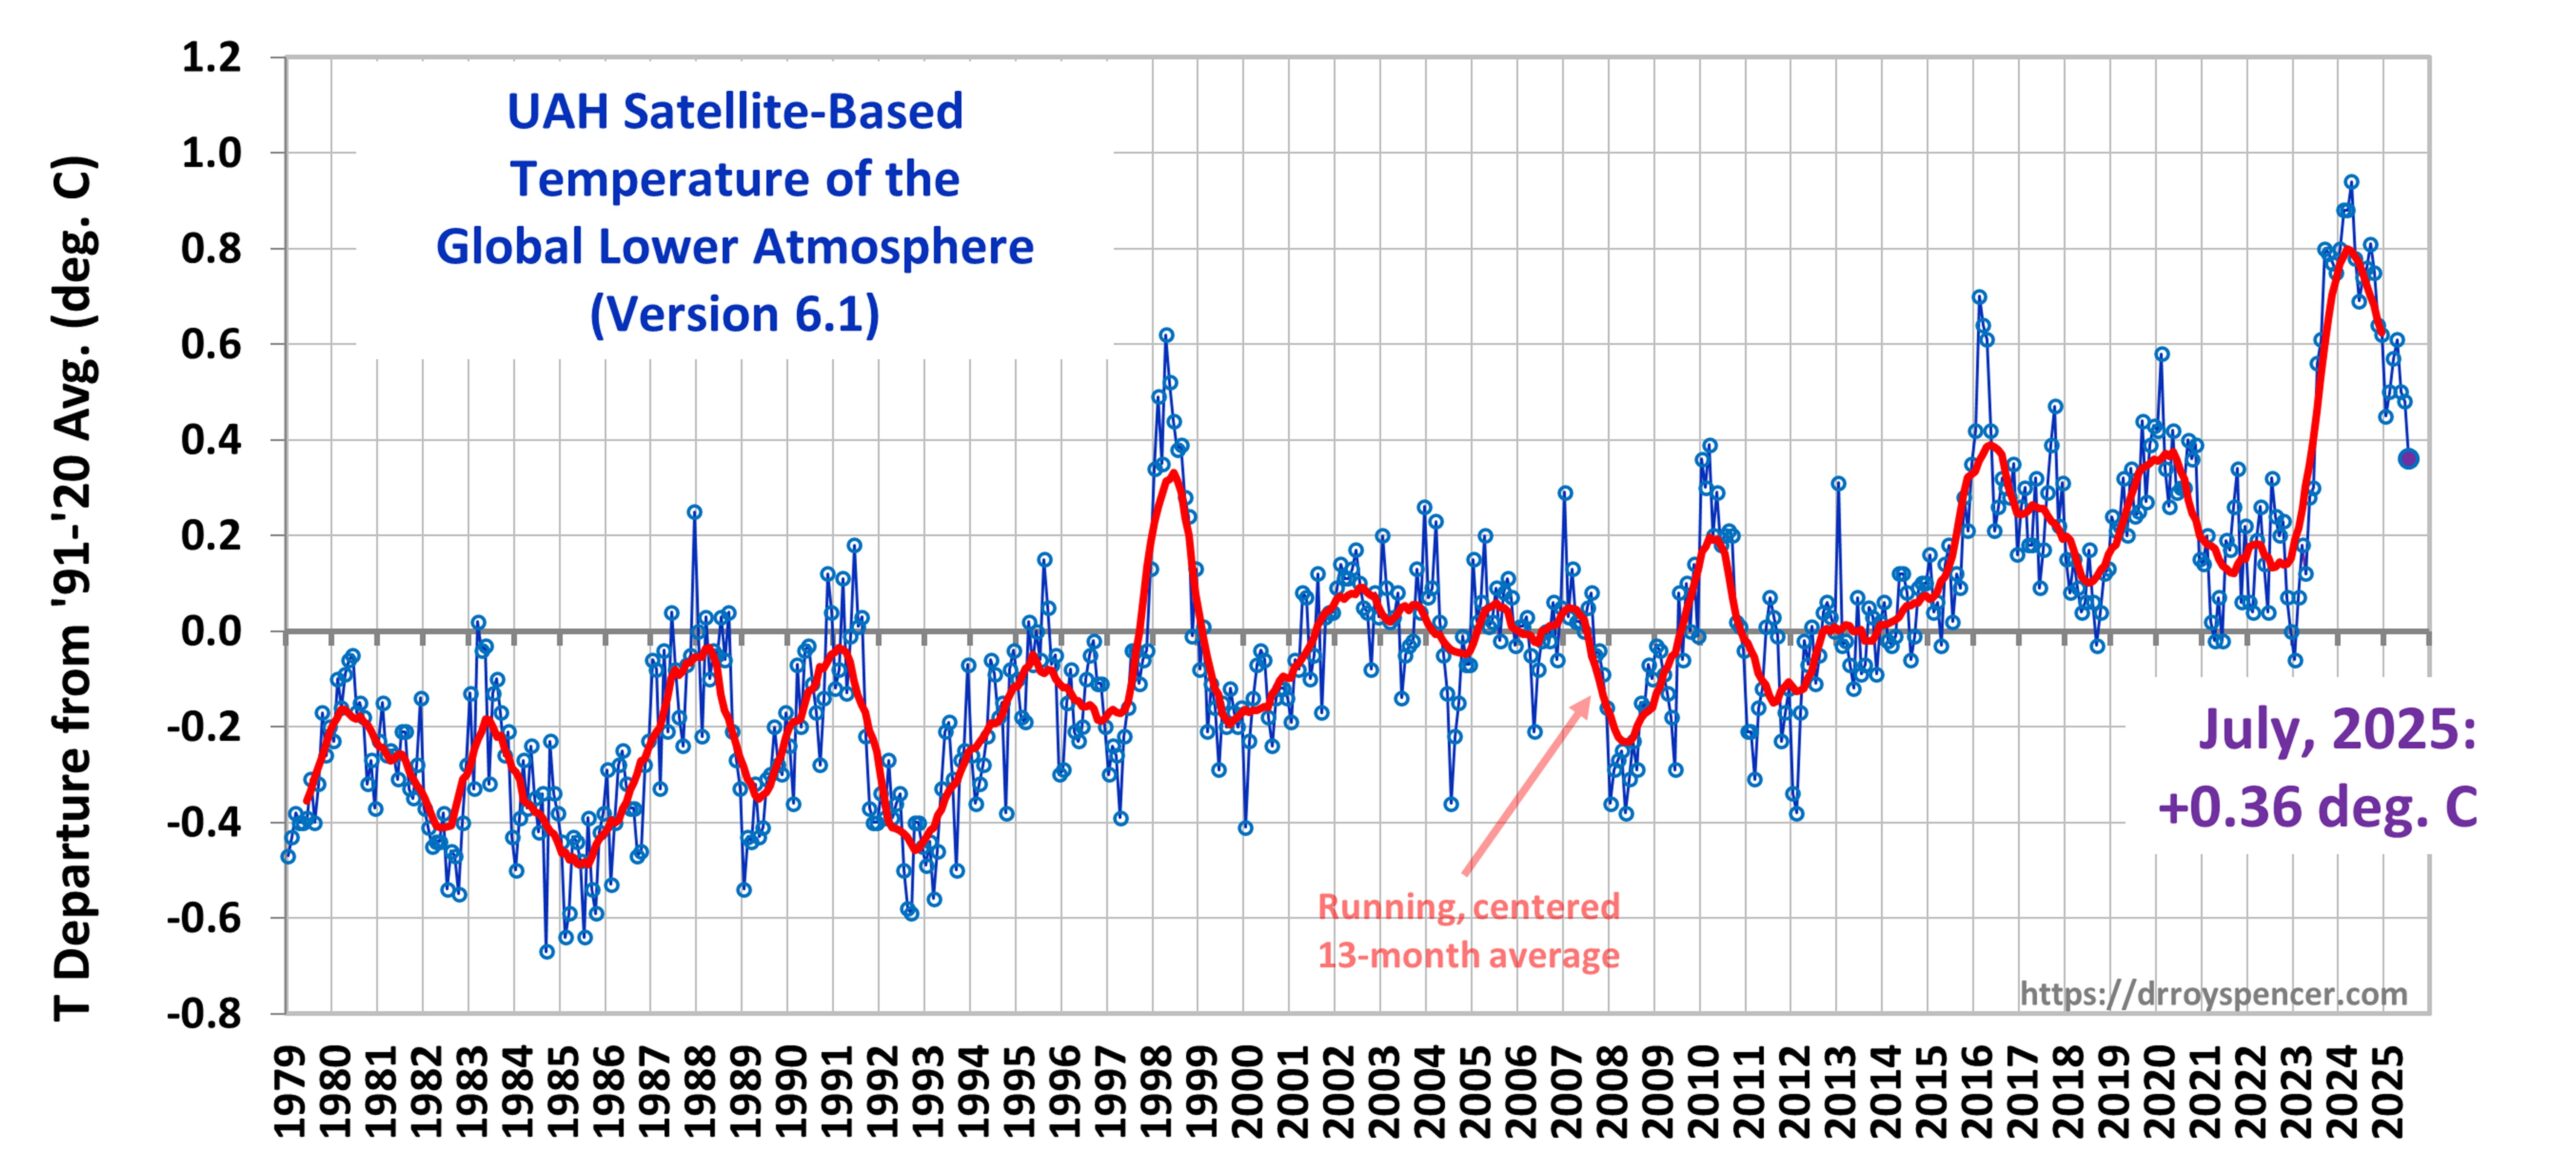
The Version 6.1 global area-averaged linear temperature trend (January 1979 through July 2025) remains at +0.16 deg/ C/decade (+0.22 C/decade over land, +0.13 C/decade over oceans).
The 0.12 deg. C drop in global average temperature anomaly since last month was dominated by the extra-tropical Southern Hemisphere, which fell from +0.55 deg. C in June to +0.10 deg. C in July.
What I think this big drop back down, that takes the warming back to the trend tells us is that the sudden spike higher 2 years ago was NOT from an accelerating trend or the positive feedback increasing and a new trend up with a steeper slope.
There are just as many negative feedbacks we don't read/hear about. The biggest one not properly dialed into the models is from photosynthesis and transpiration from plants on a planet that is massively greening up from the benefits of CO2.
In the US Cornbelt, we are conducting a real world laboratory to study this every growing season!
Climate change in the United States, with 100% certainty is helping to protect us from widespread severe droughts.
Summer Climate Change in the Midwest and Great Plains due to Agricultural Development during the Twentieth Century
https://journals.ametsoc.org/view/journals/clim/32/17/jcli-d-19-0096.1.xml

++++++++++++++++++++++++++++++++++++++++++++++++++++

++++++++++++++++++
Only 1, widespread drought in the Cornbelt since 1988! That was 2012(1 drought in 37 years). This crazy great weather/climate considering the history of this location the past 200 years.
Over that period, the US Cornbelt averaged a drought of this magnitude around 1 time every 5 years.
The reason for the climate OPTIMUM in the Cornbelt is the tightly packed rows of corn(2 times as dense as 40 years ago in many cases. Along with higher CO2 and climate change.
Those plants are transpiring additional soil moisture from their deep root systems,, thru their stomata (under their leaves). This increases low level moisture/precipitable water/dew points This reduces the lifting condensation level so more vertical/cumulus clouds form and at a lower level, which reduces afternoon temps. This also provides an added source for rains, which fall out and cause a sort of positive feedback cycle.
What is really missed is the amount of solar radiation in the air that is captured by the plants in photosynthesis. This converts solar heat energy into chemical energy stored in the plants, also helping to reduce daytime readings over areas with vegetation. Multiply this around the greening planet and it turns out to be a robust negative feedback.
However, H2O overall is a greenhouse gas that ADDS to global warming because it traps heat like CO2 does. When CO2 heats the planet, the temperature goes up and the warmer air can hold a bit more moisture (around 7% more for every +1 Deg C/1.8 F).
Most of the warming from more H2O is taking place at night.
Most of the warming from CO2 is at the coldest/driest places. That's because heat is absorbed in absorption bands in different parts of the radiation spectrum, which is determined by the characteristics of each gas doing the absorbing.
Turns out that the absorption bands for CO2 overlap some of those as from H2O. So in places with high dewpoints/low level moisture/precipitable water some of those absorption bands are almost saturated from the H2O.
Adding CO2 there, has had much less impact than adding CO2 to cold/dry places, where the radiation absorption bands are NOT already saturated by H2O.
https://b.tellusjournals.se/articles/10.3402/tellusb.v35i2.14788
You want a REAL climate crisis?
Cool the temperatures back down to the 1800s and reduce the CO2 back to those levels!!!
That sounds like a very bizarre thing to read because it's AUTHENTIC SCIENCE and NOT what is being taught by mainstream science, politics and the media.
Re: Re: Re: Re: Re: Death by GREENING!
By metmike - Feb. 2, 2025, 7:54 a.m.
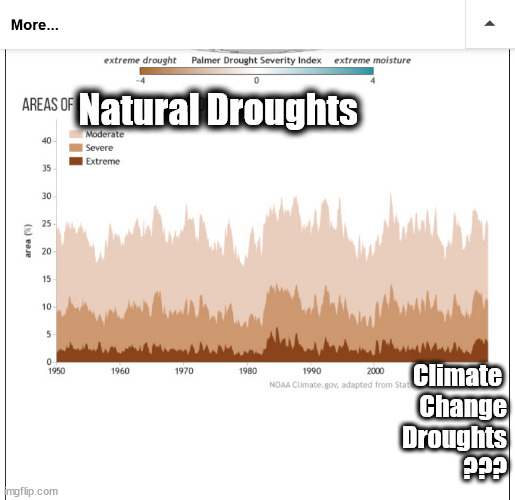
Here's a perfect example of why they get it so wrong using the global drought graph from above. Please tell me where on this graph below, that the climate change droughts are and where the natural droughts are since the year 2000? Impossible because the pattern is THE EXACT SAME! The MSM, in 2025 tells us that EVERY drought is now caused by climate change to the point that they use the terms interchangeably.
https://www.climate.gov/news-features/featured-images/2017-state-climate-global-drought
+++++++++++++++++++++++
Global cooling and LOW CO2 levels are what cause widespread, extremely long lasting droughts with catastrophic global and huge regional famines!
Here in 2025, we are living in a climate optimum with absolute, scientific certainty!!
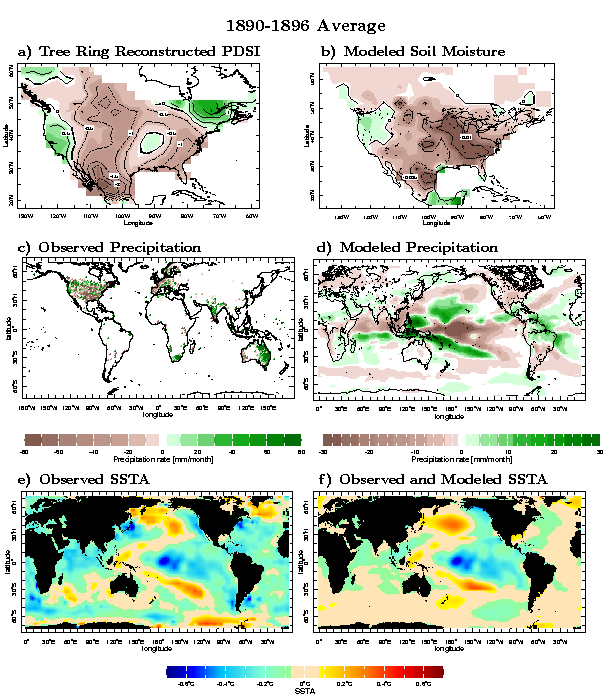
Causes and consequences of nineteenth century droughts in North America
https://ocp.ldeo.columbia.edu/res/div/ocp/drought/nineteenth.shtml
++++++++++++++++++++++++++++++++++++++++++++
You want a REAL climate CRISIS?
This is what it looks like:
Can you imagine if this below happened today? It's less likely because climate change and the current climate OPTIMUM is helping to PROTECT US!
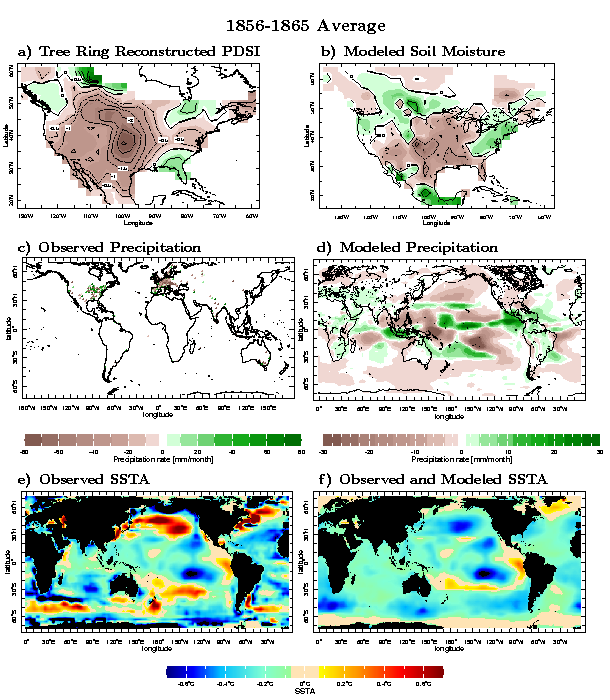
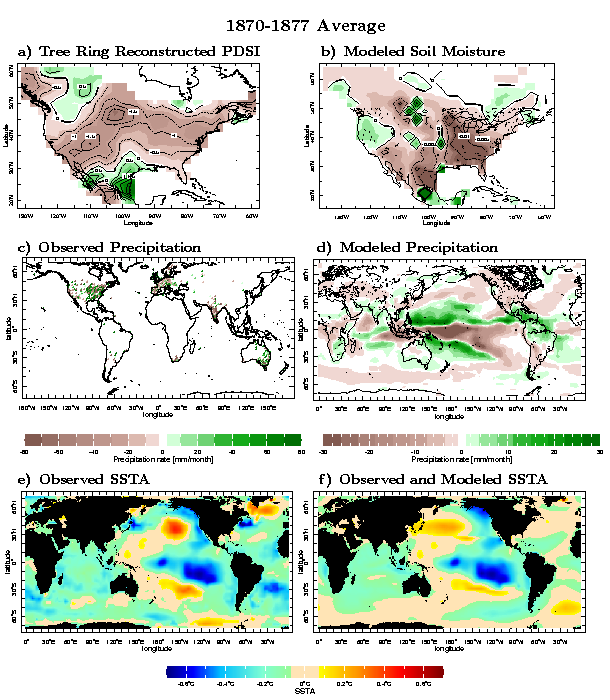
The planet had a REAL climate crisis between 1876 and 1878.
50 million people died. 3% of the global population died from that real climate crisis!
https://news.climate.columbia.edu/2017/12/15/causes-great-famine-drought/

https://ui.adsabs.harvard.edu/abs/2017AGUFMGC51F..04S/abstract
The 1876-1878 Great Famine impacted multiple regions across the globe including parts of Asia, Nordeste Brazil, and northern and southern Africa, with total human fatalities exceeding 50 million people, arguably the worst environmental disaster to befall humanity.
NASA EXPLAINS THE DUST BOWL DROUGHT
https://www.nasa.gov/centers/goddard/news/topstory/2004/0319dustbowl.html
https://wattsupwiththat.com/2025/08/06/astonishing-extreme-lightning-bolt-recorded/