Thanks, cutworm.
This is real!
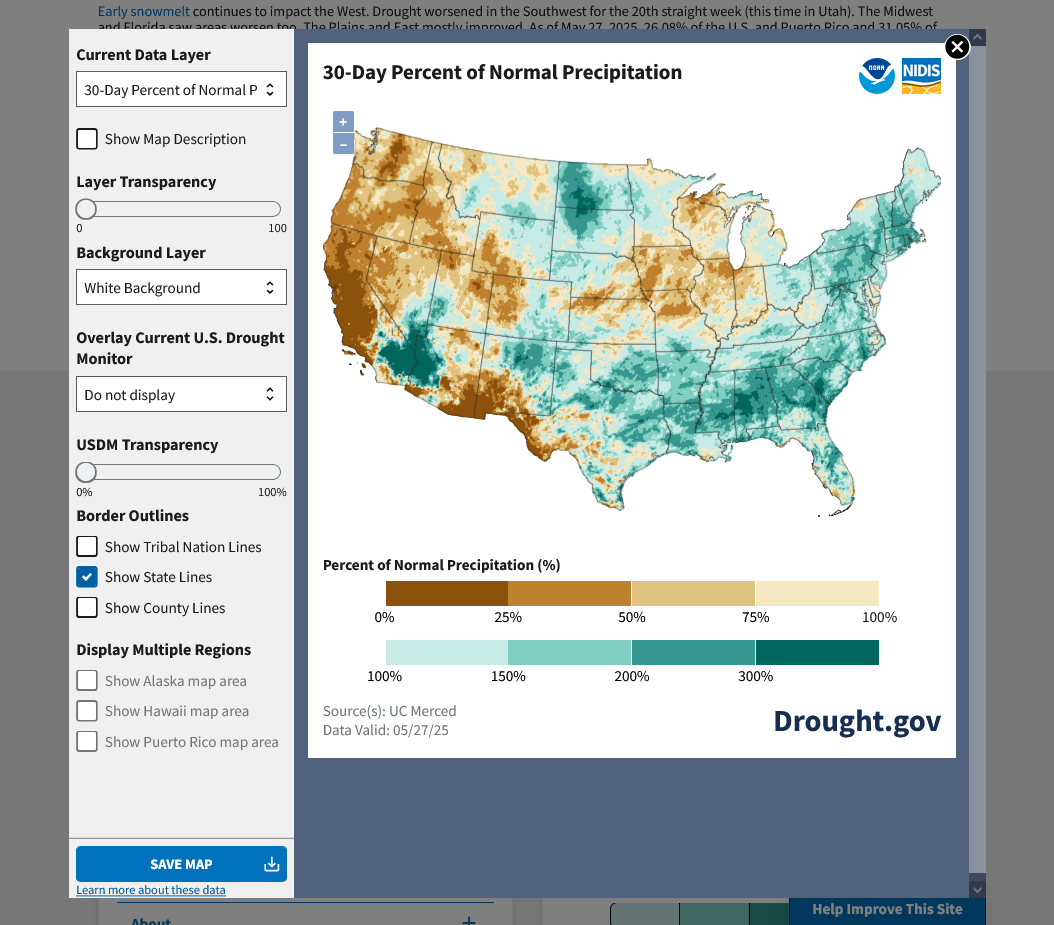
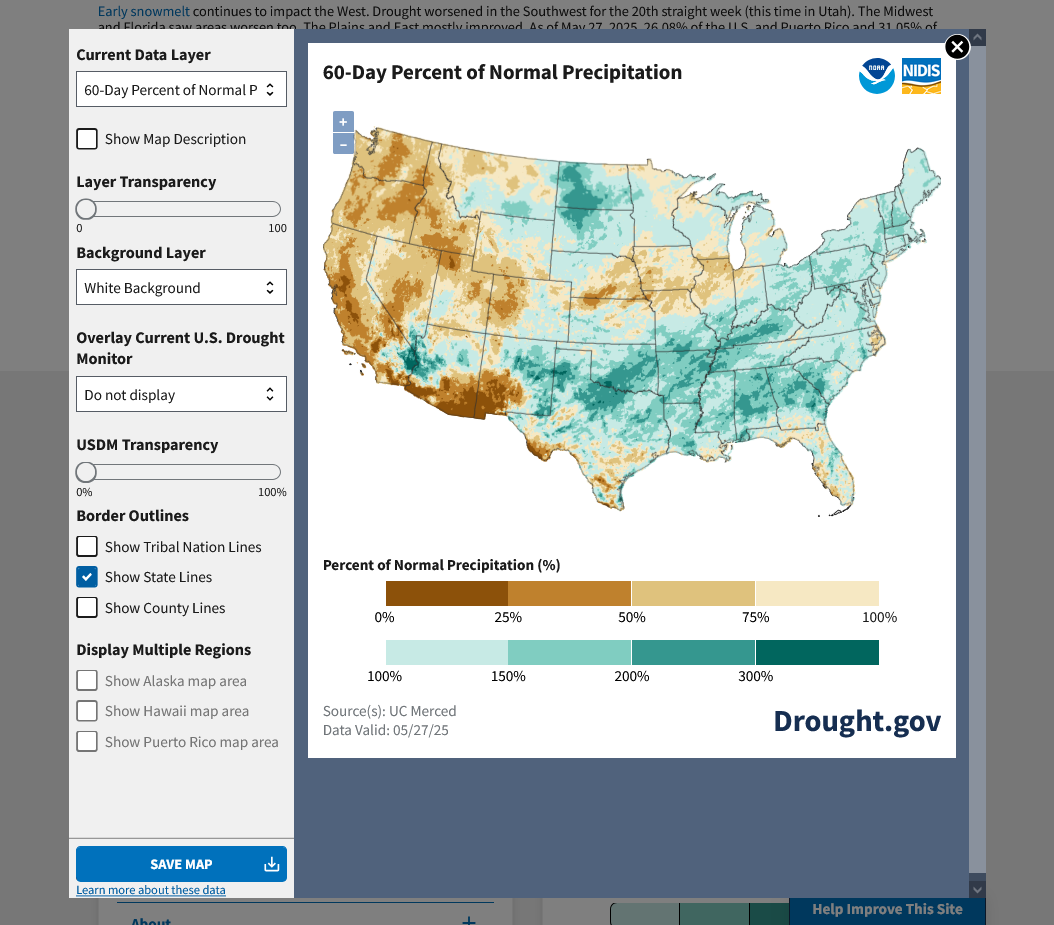
https://www.drought.gov/current-conditions
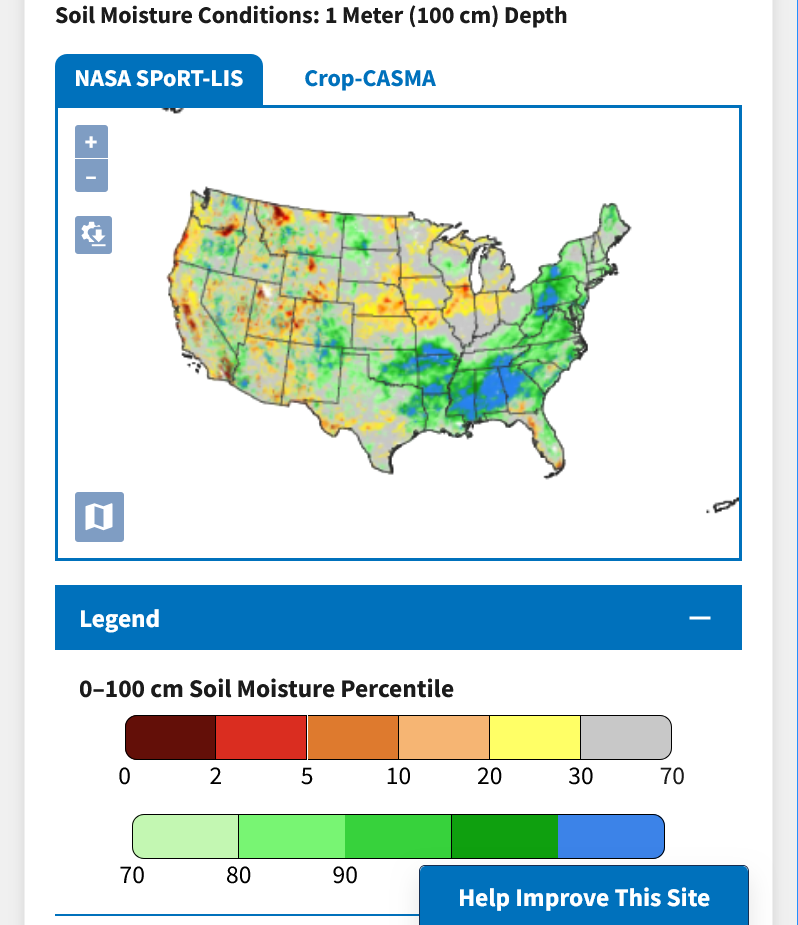
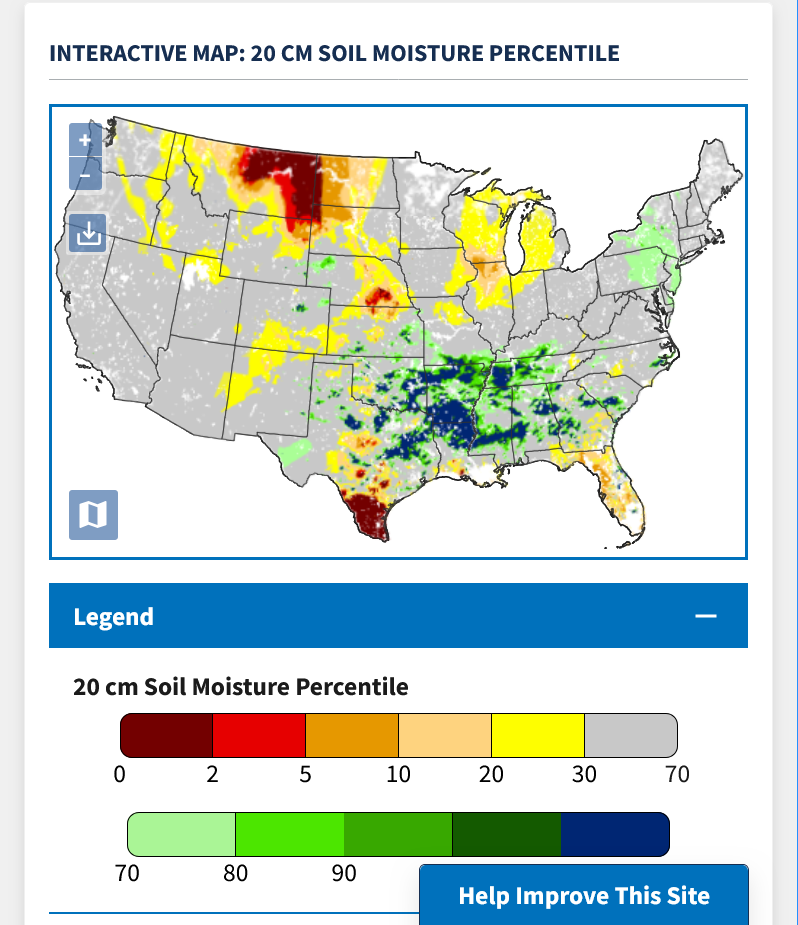
https://www.drought.gov/data-maps-tools/nationalsoilmoisturecom
Some of the maps above are as much as a week old.
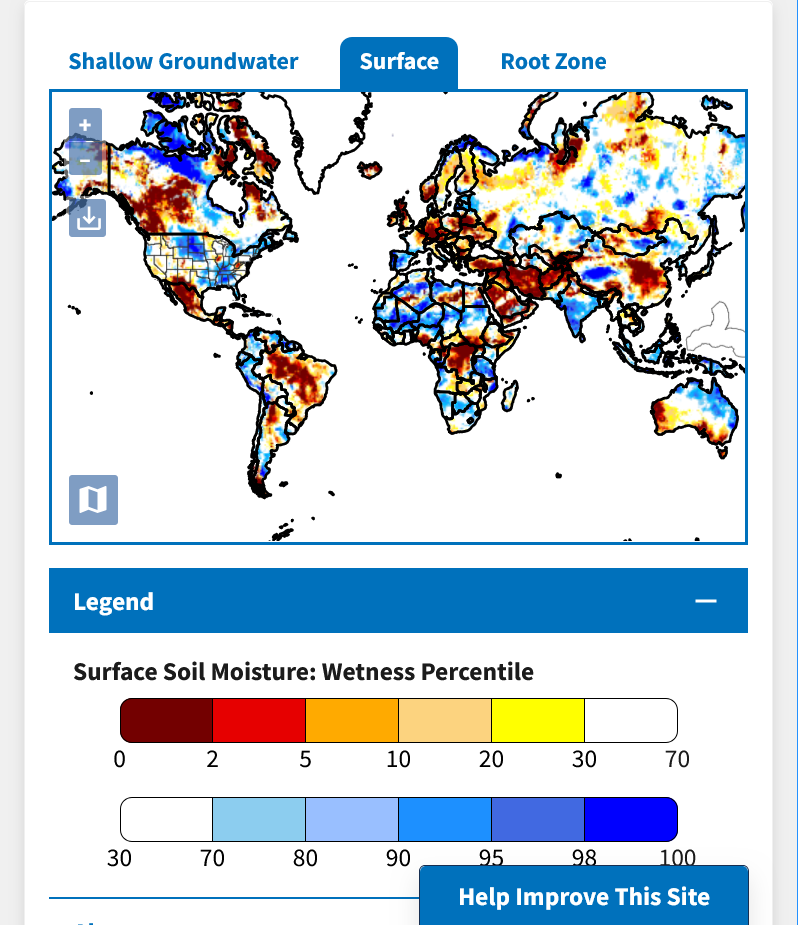
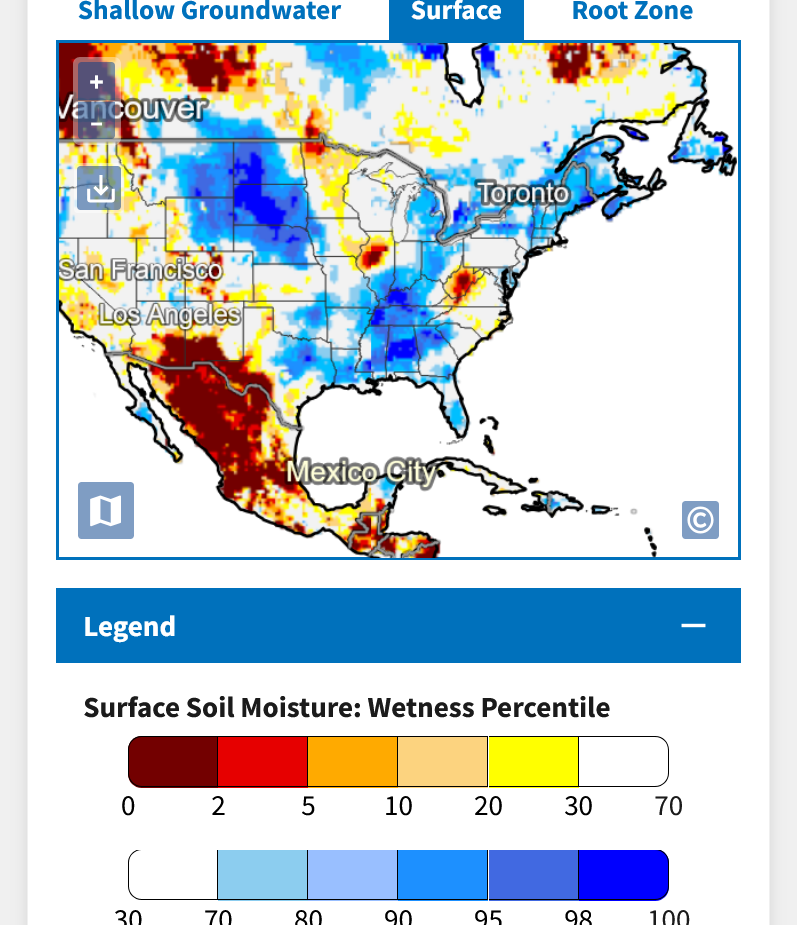
Soilmoisture anomaly:
These maps sometimes take a day to catch up to incorporate the latest data(the bottom map is only updated once a week).
https://www.cpc.ncep.noaa.gov/products/Soilmst_Monitoring/US/Soilmst/Soilmst.shtml#
![]()


I should have included the rainfall totals forecast and will do that when back at my computer along with cotton prices.
Cotton is off to the bullish races tonight because of more excessive rain later this week in cotton country.
Total rains for 2 weeks from the last 6z GEFS model, most of this in week 1:
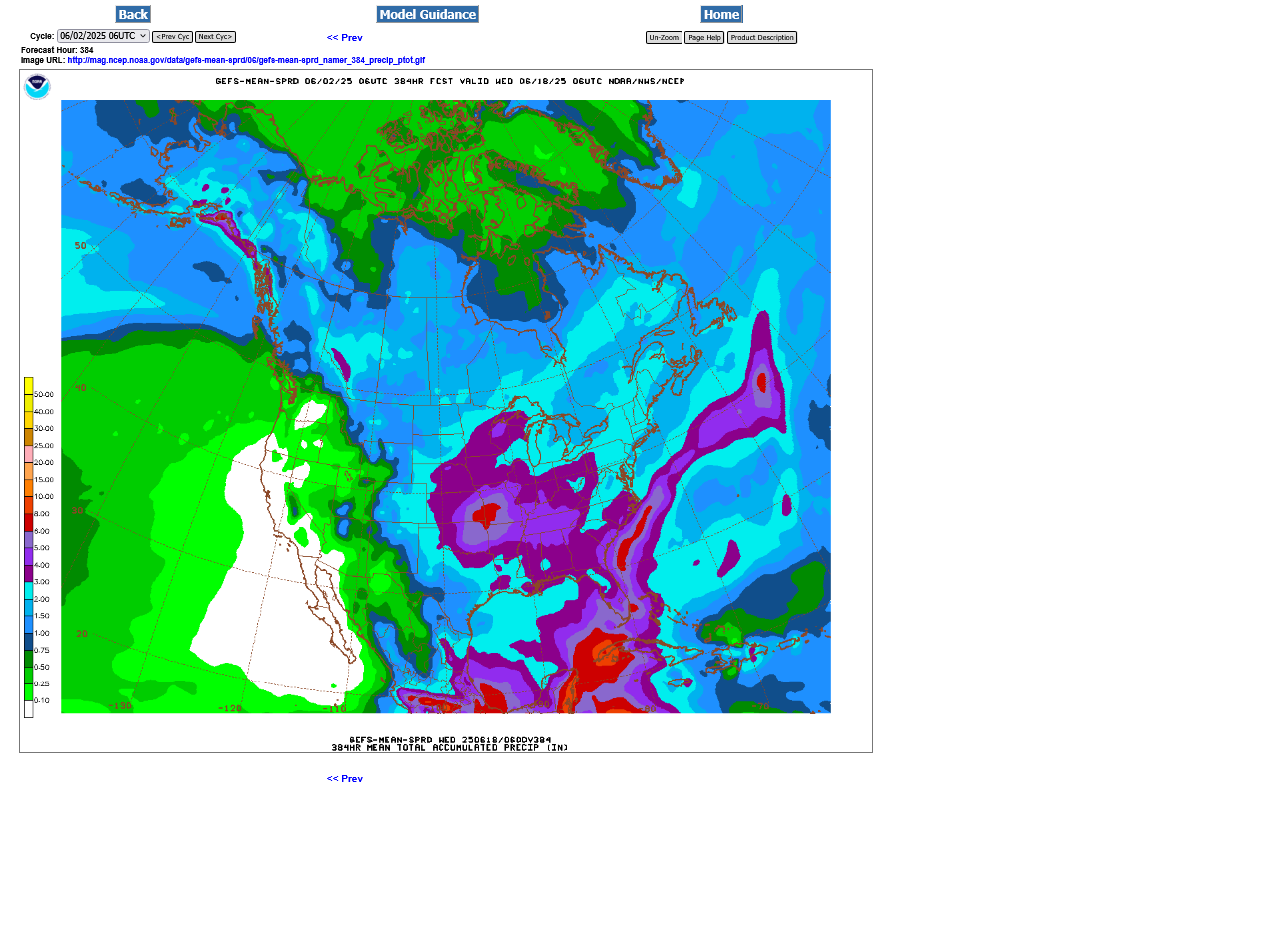
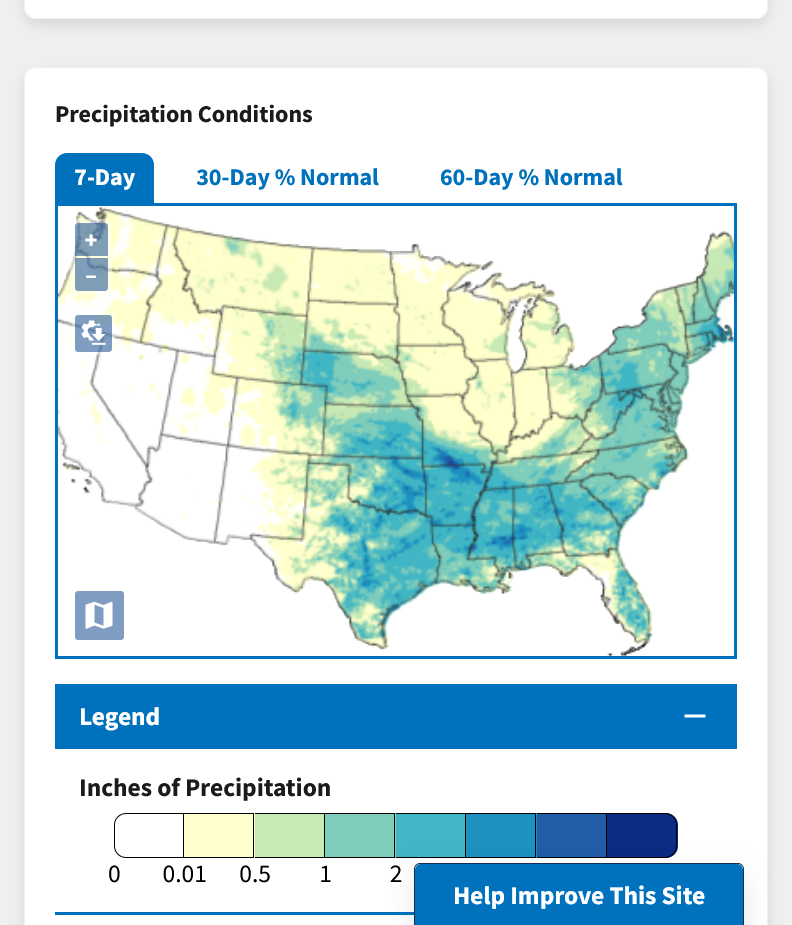
7 Day Total precipitation below:
http://www.wpc.ncep.noaa.govcdx /qpf/p168i.gif?1530796126

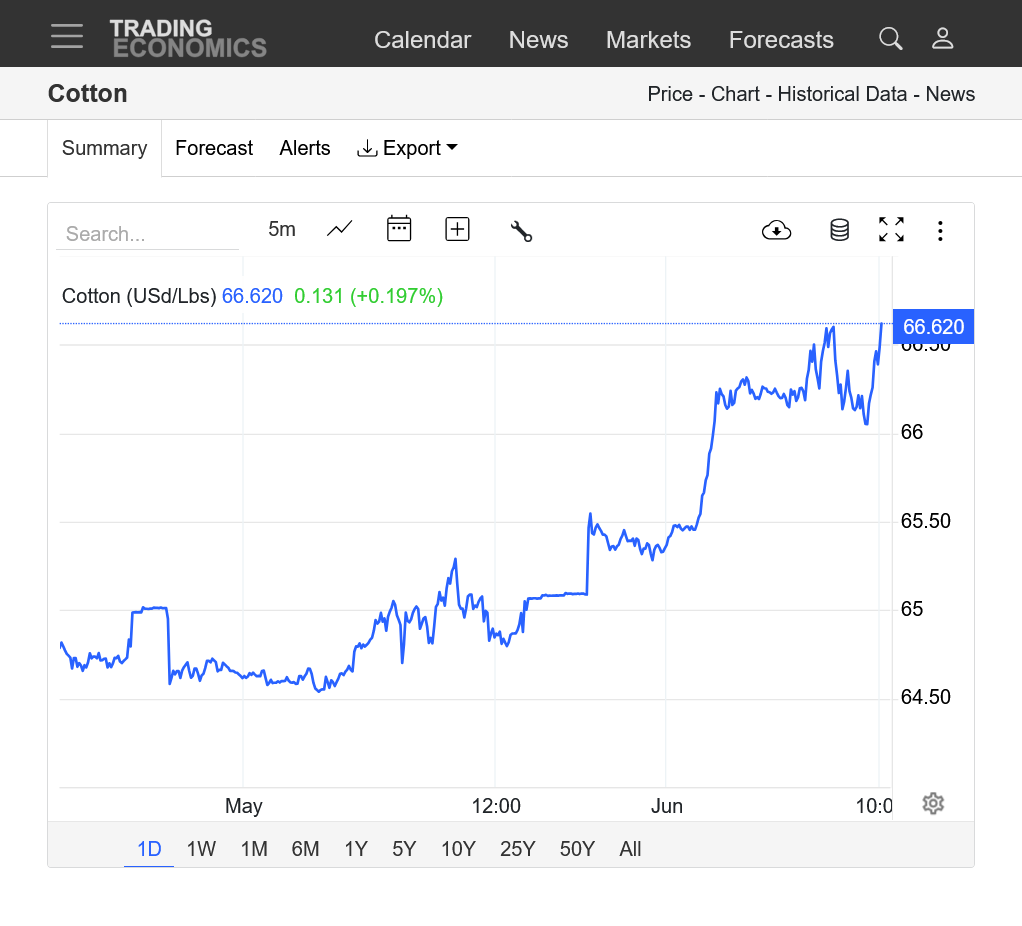
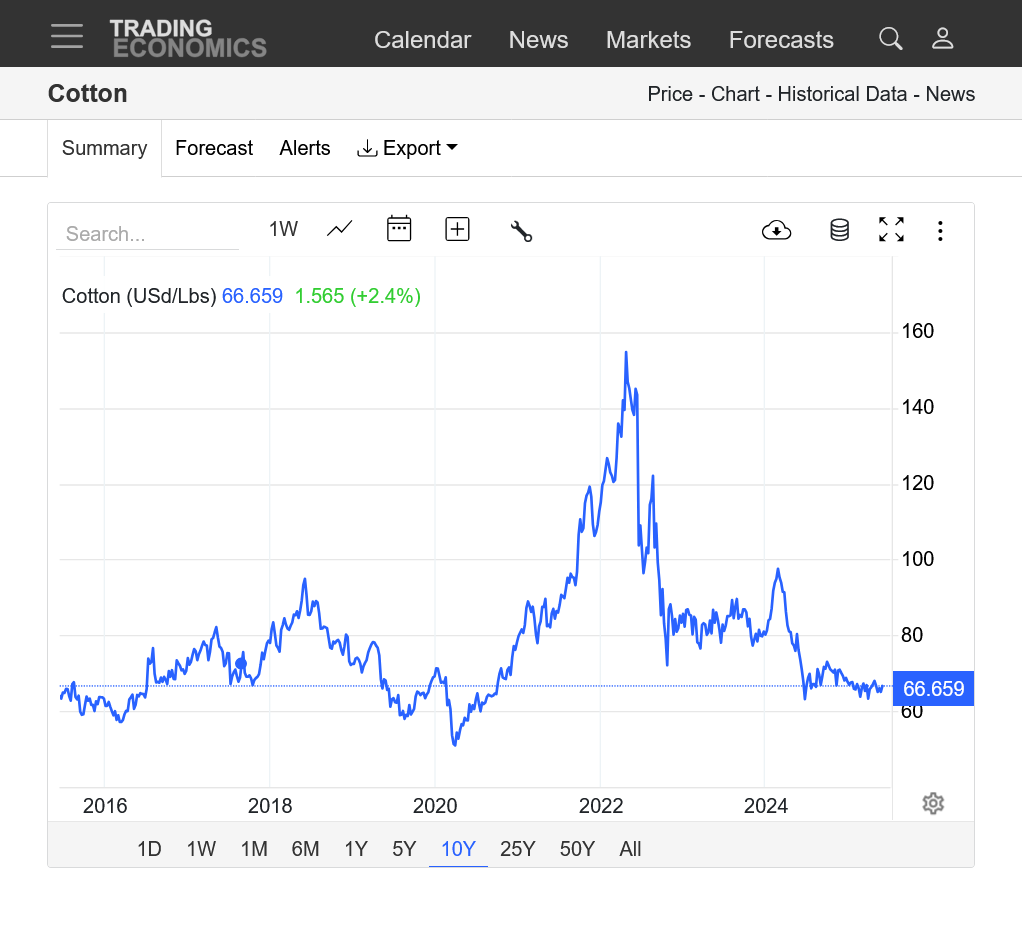
Cotton:
https://tradingeconomics.com/commodity/cotton
1. 1 day-Bullish wet weather
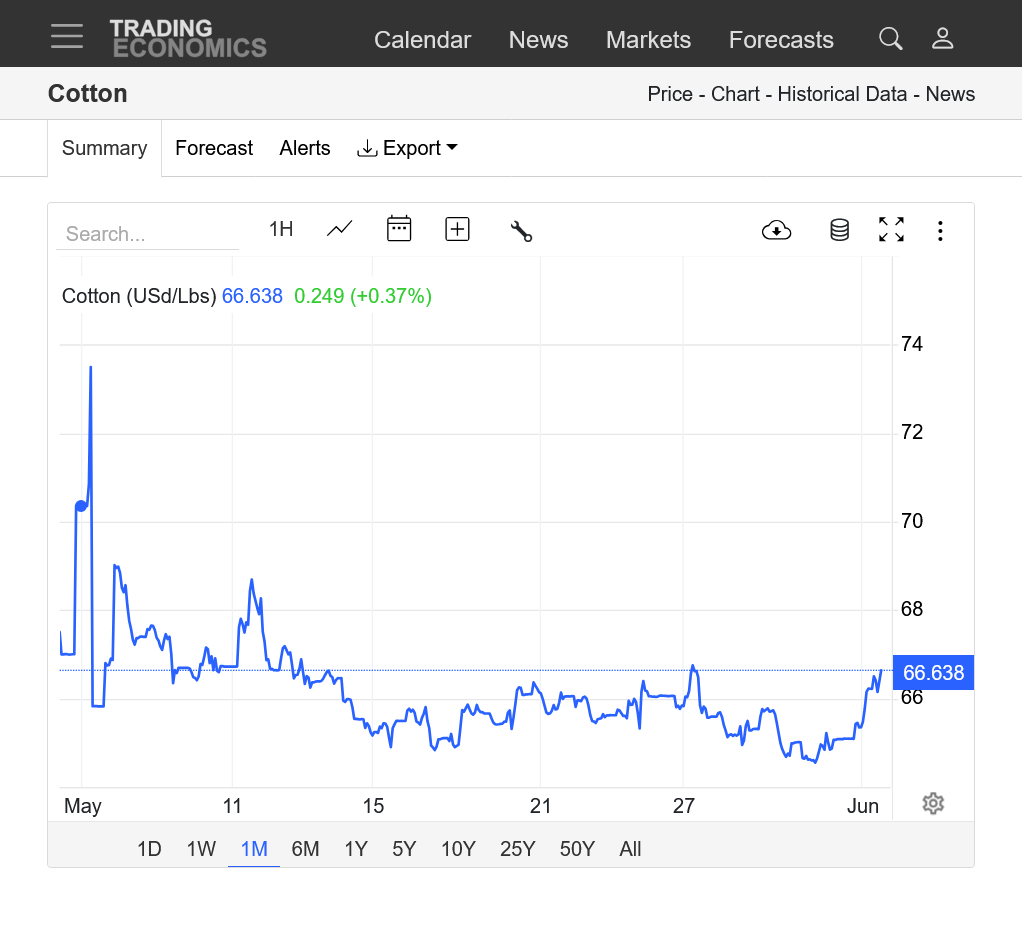
2. 1 month-Breaking out to the upside?
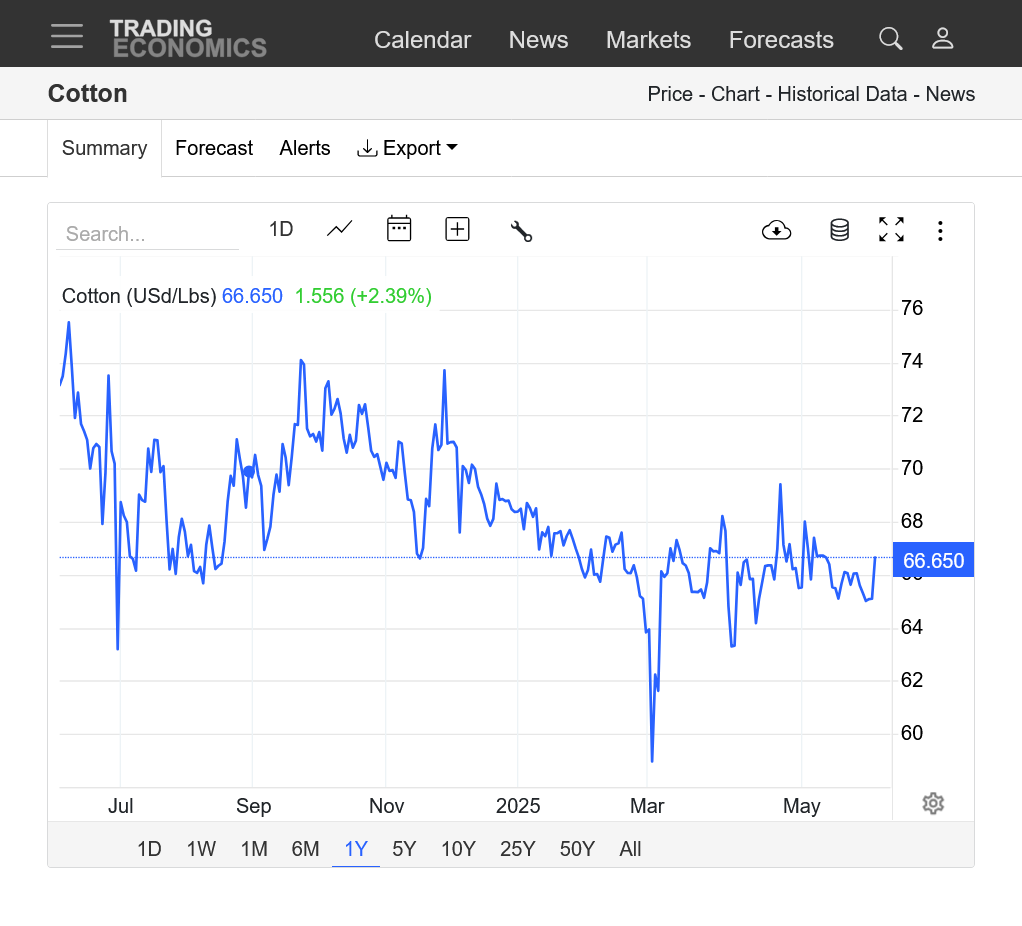
3. 1 year-Still in a downtrend
4. 10 years-Undecided. Coiling pattern. Possible descending triangle with the potential to break out to the upside because of weather and weaker dollar. But economy and crude oil are bearish.
https://tradingeconomics.com/commodity/cotton
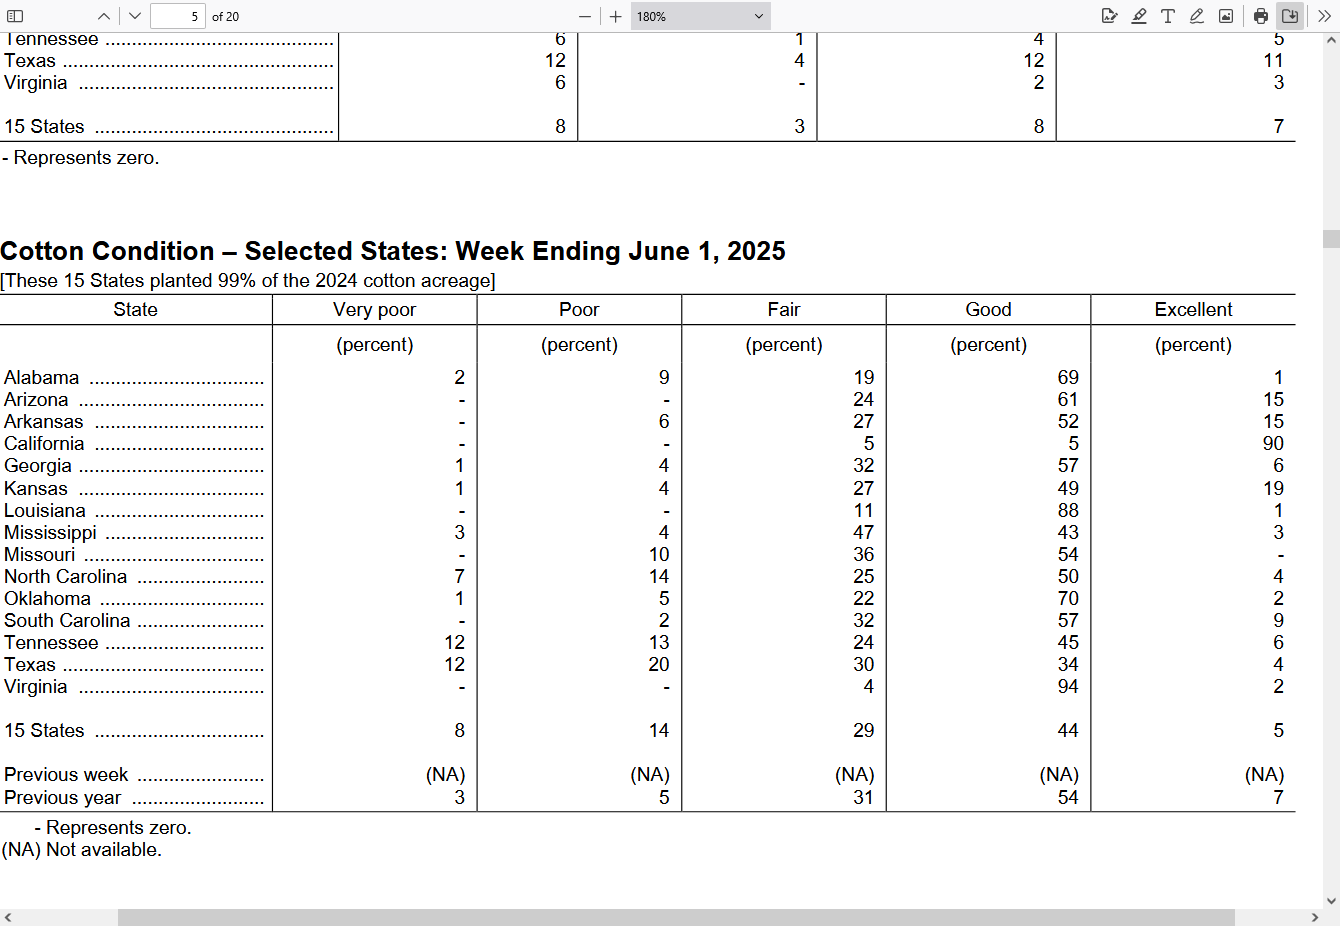
See the full USDA weekly crop progress report here: https://release.nass.usda.gov/reports/prog2225.pdf
This is what stands out the most for me: 22% of the cotton crop is P/VP. This compares to just 8% P/VP last year.
Double digit P/VP states were AL, MO, NC, TN and TX. TX is by far the biggest producer (30%) and they were a whopping 32% P/VP!
G/EX was 49% compared to 61% last year.
metmike: The United States is the #4 biggest global cotton producer!
|
https://ipad.fas.usda.gov/cropexplorer/cropview/commodityView.aspx?cropid=2631000
| United States | 12 | 14,500 | 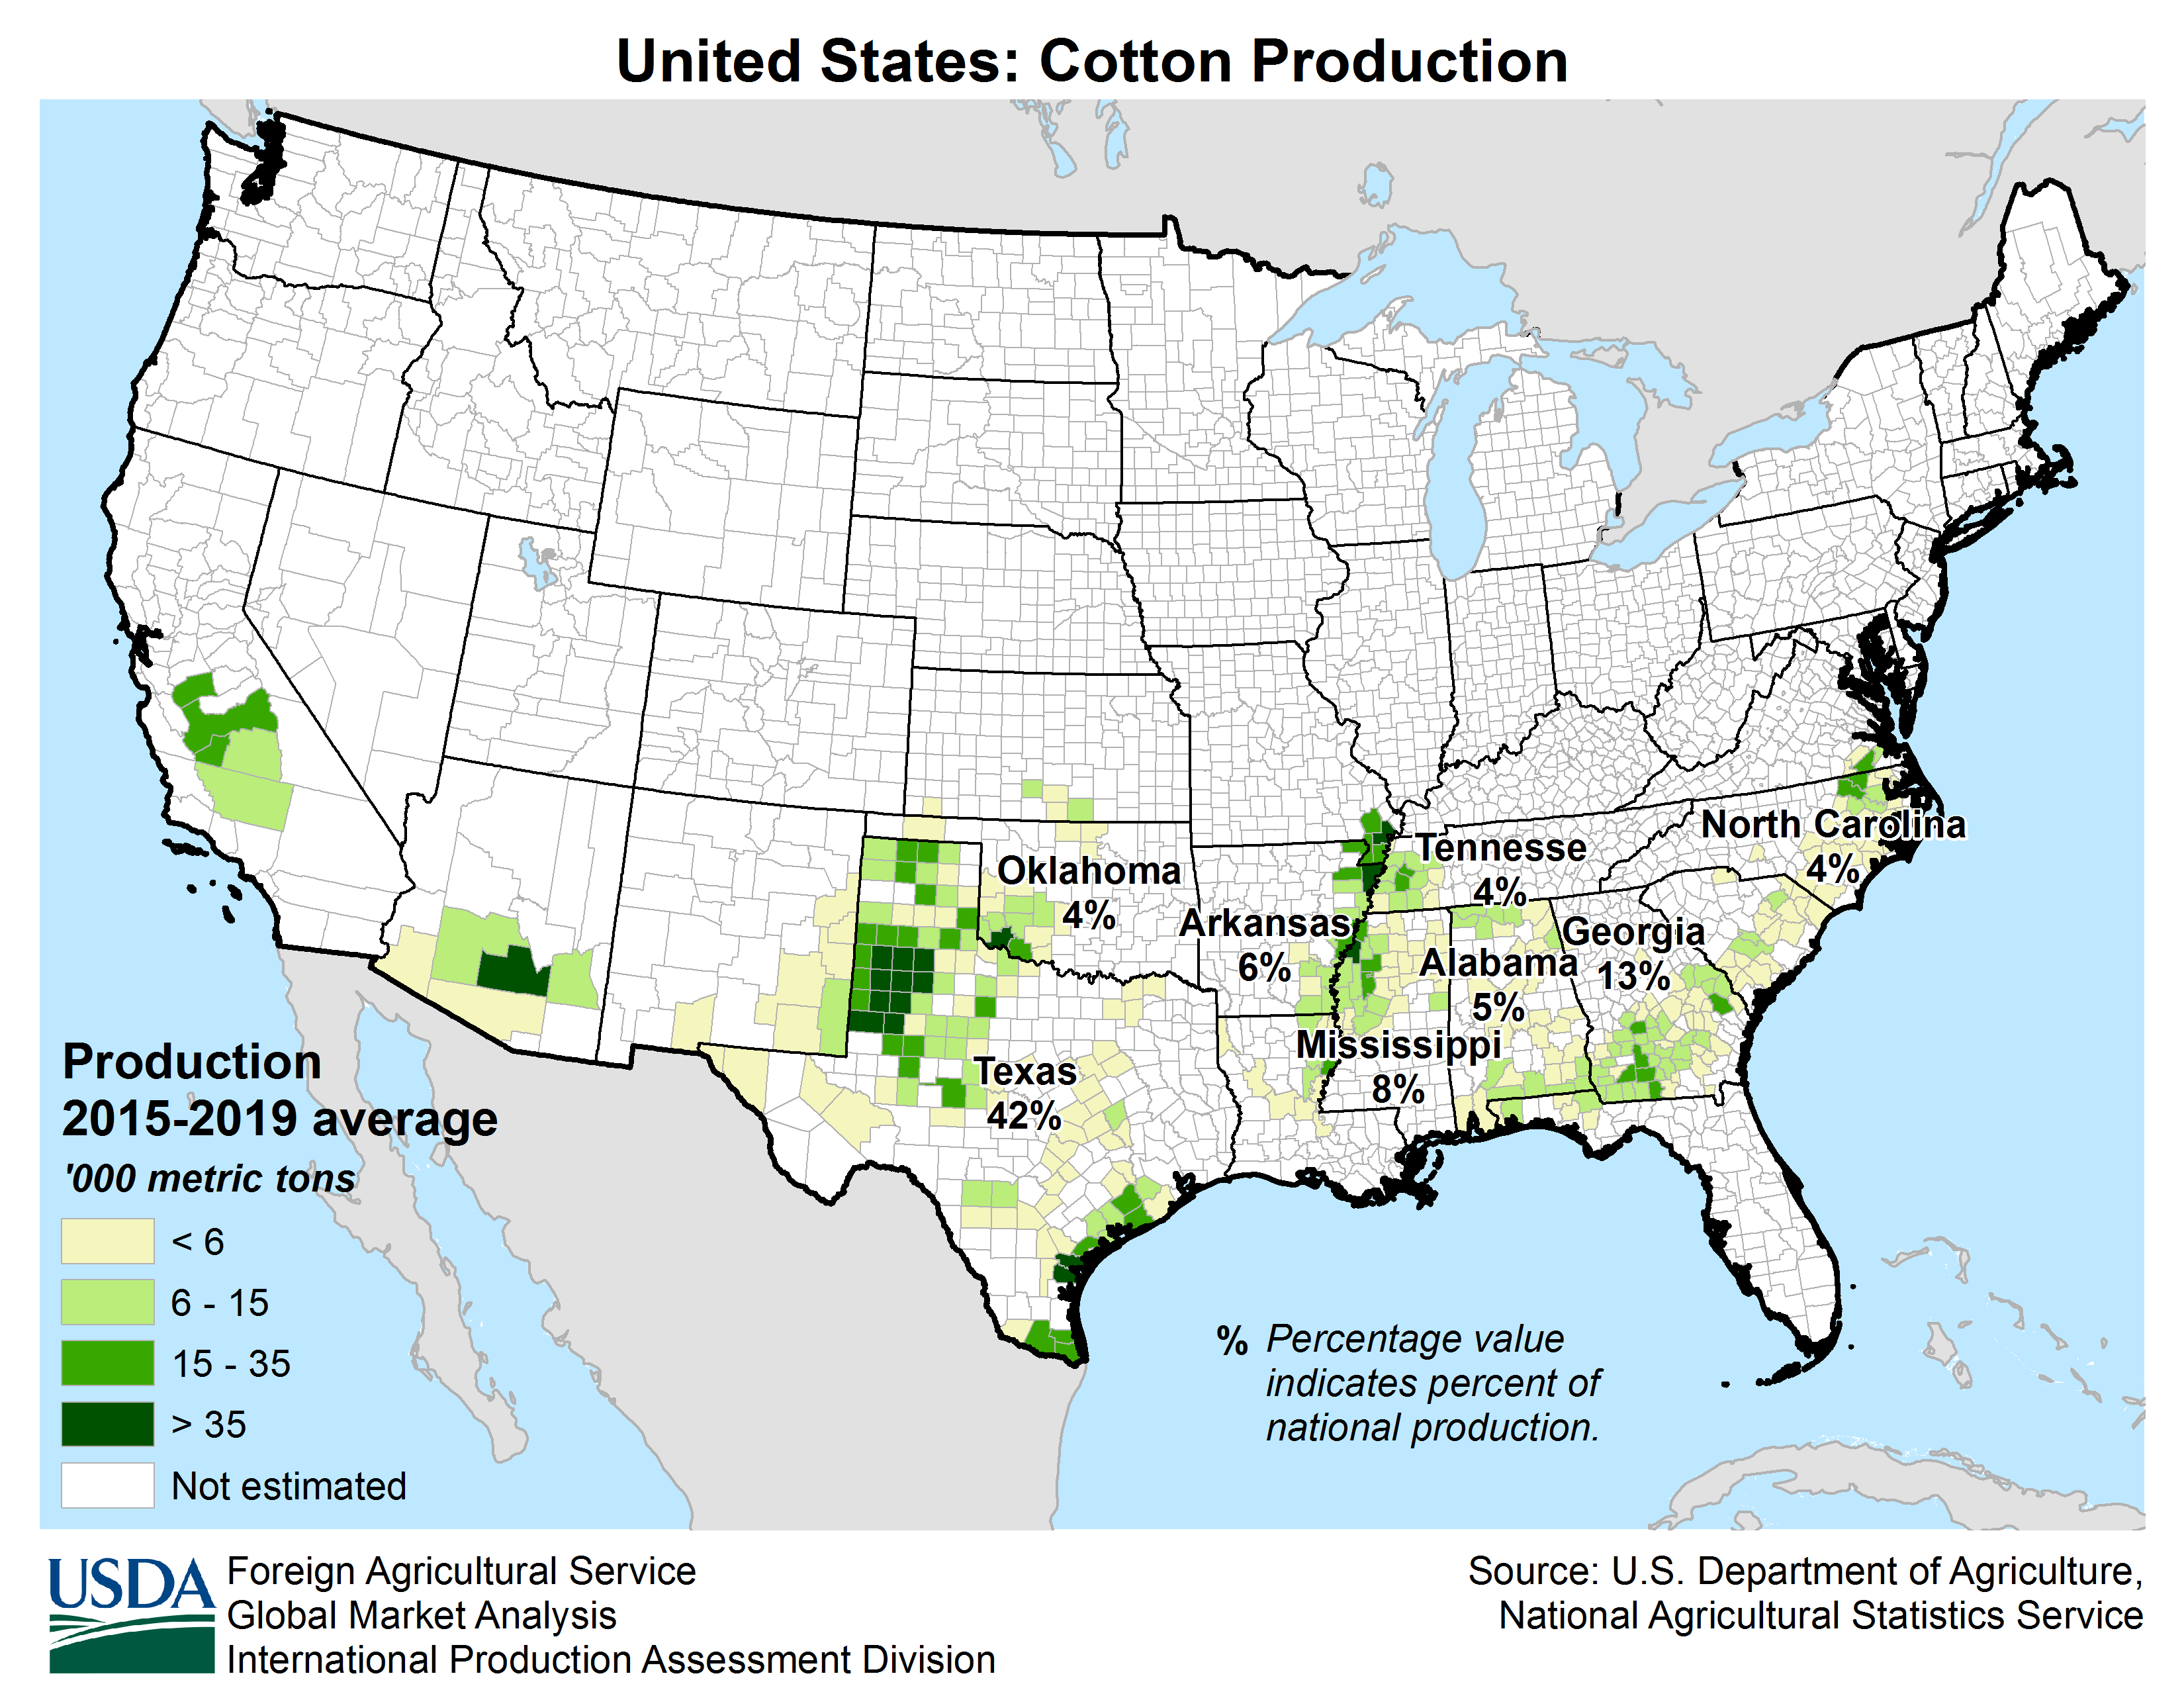 |
| Cropland NDVI (MODIS) | Cumulative Precipitation (mm) |
 | 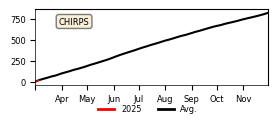 |
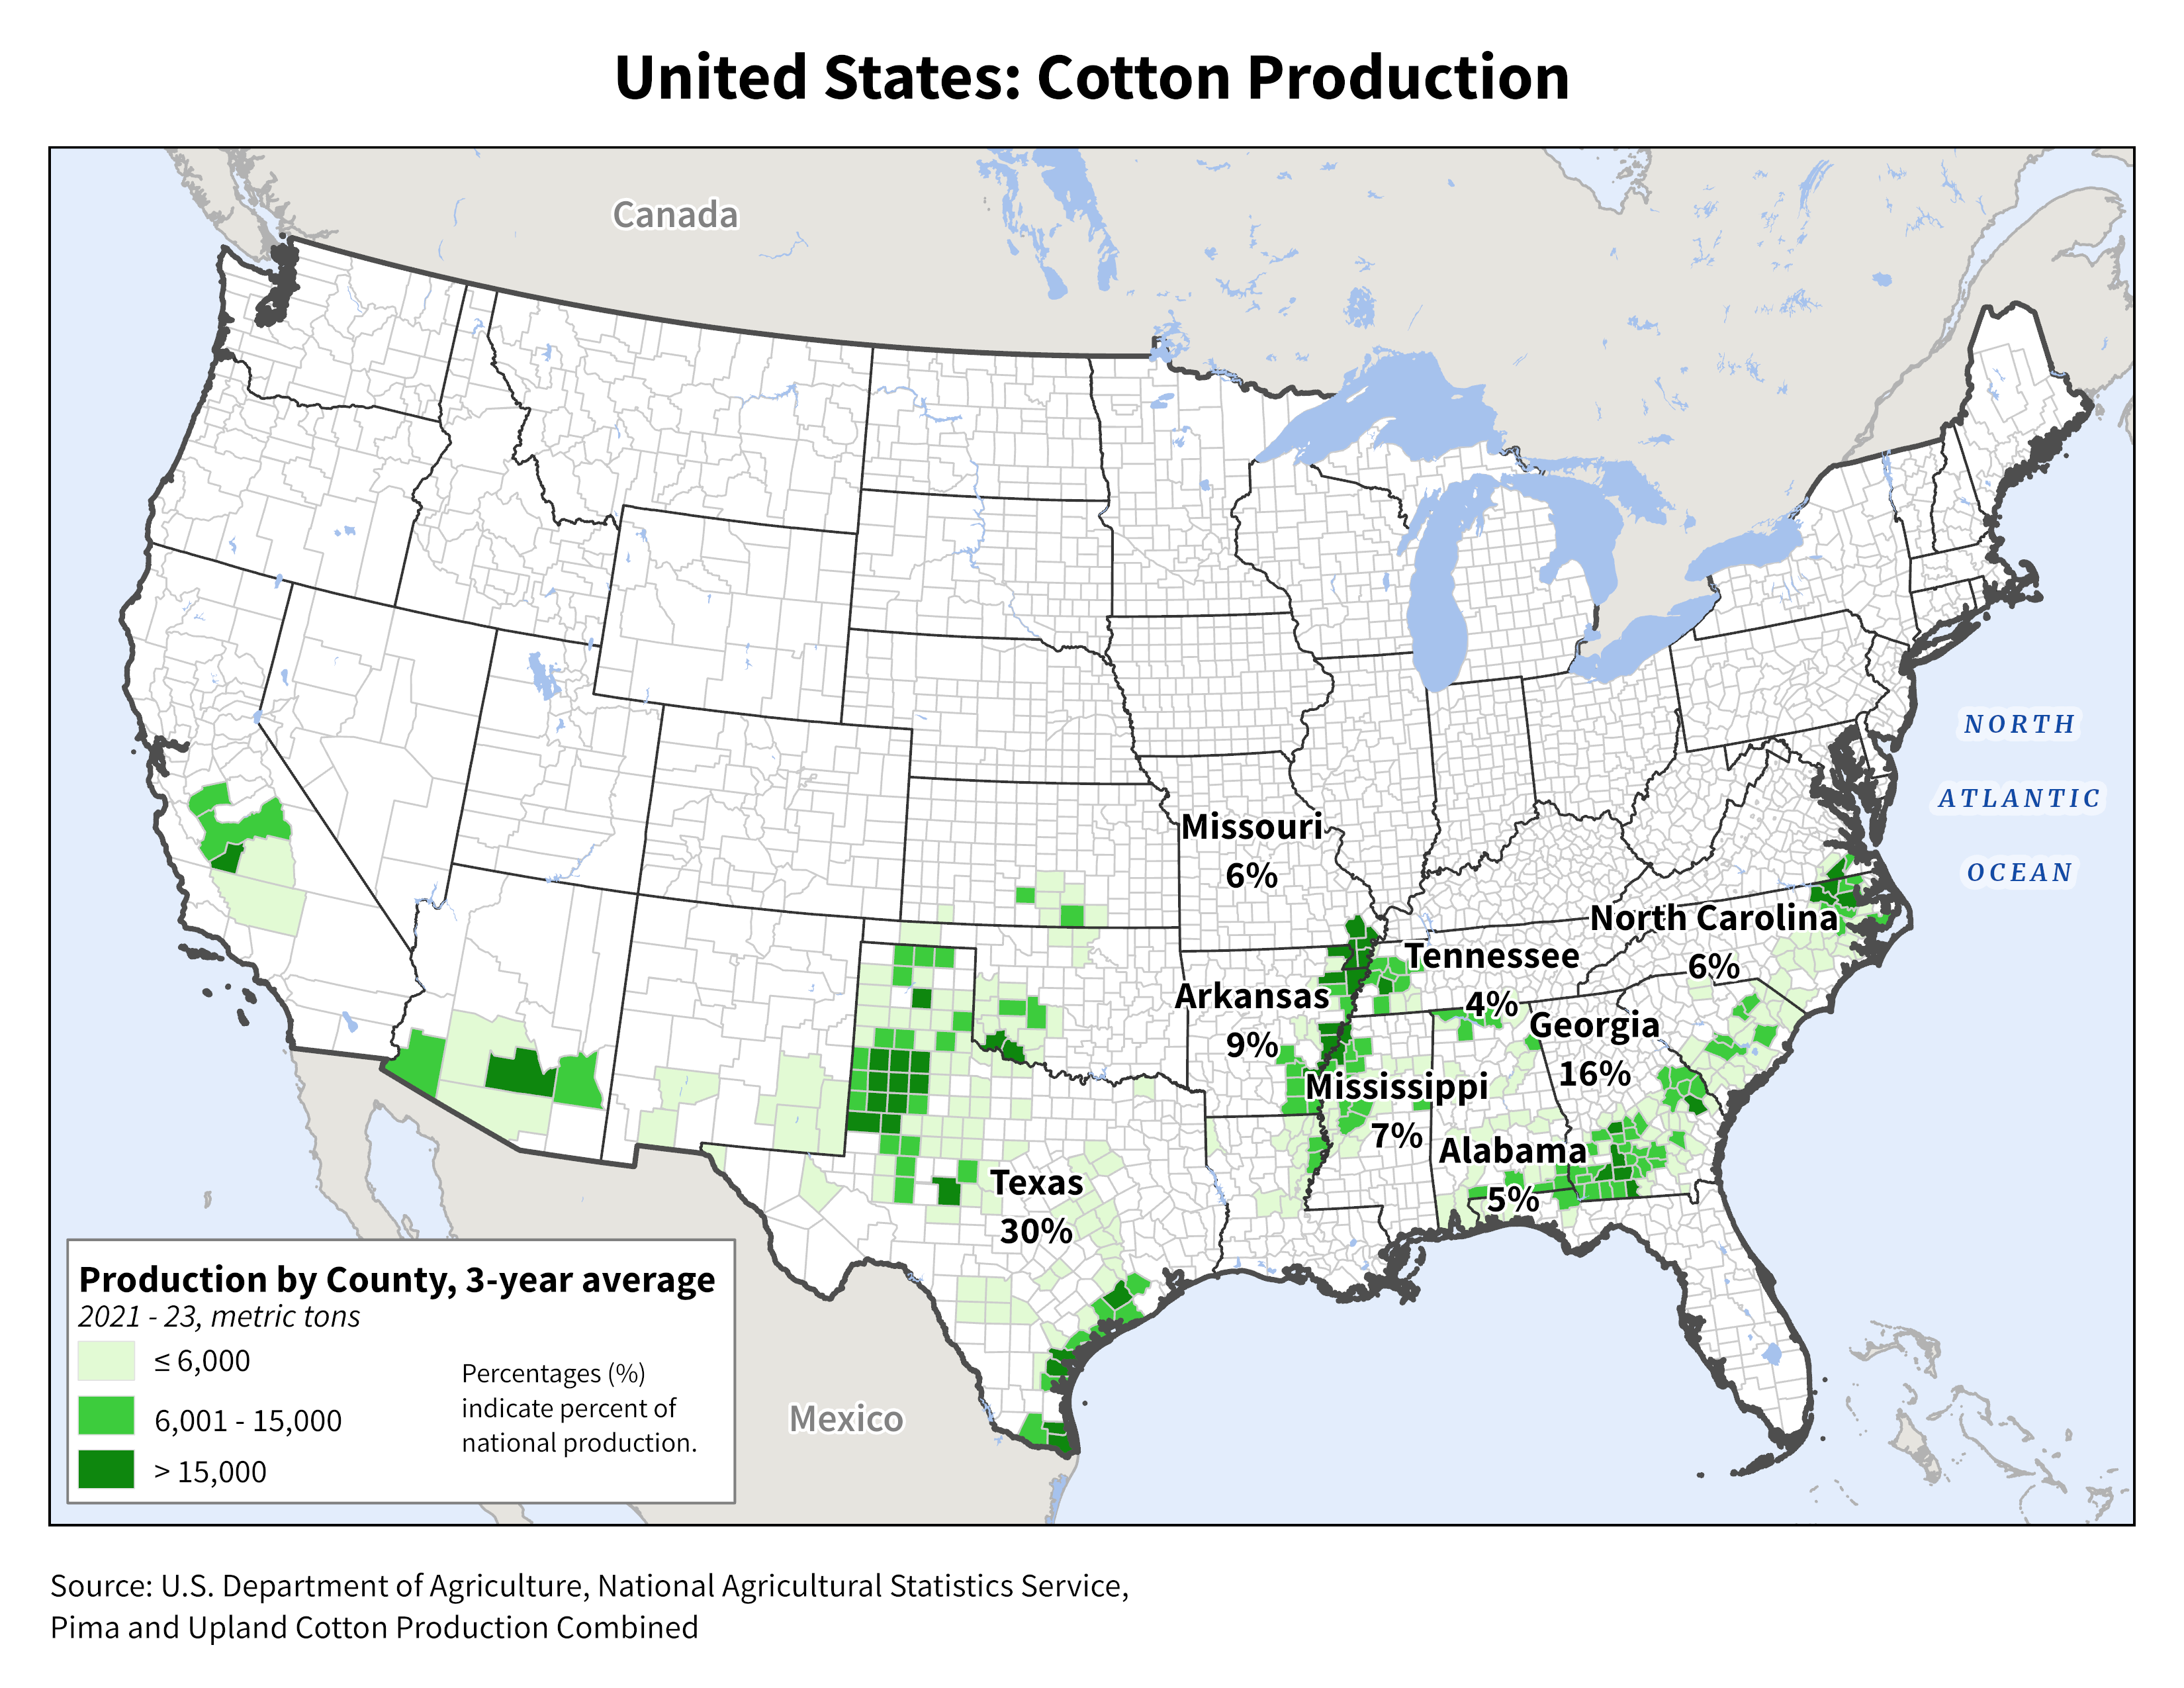
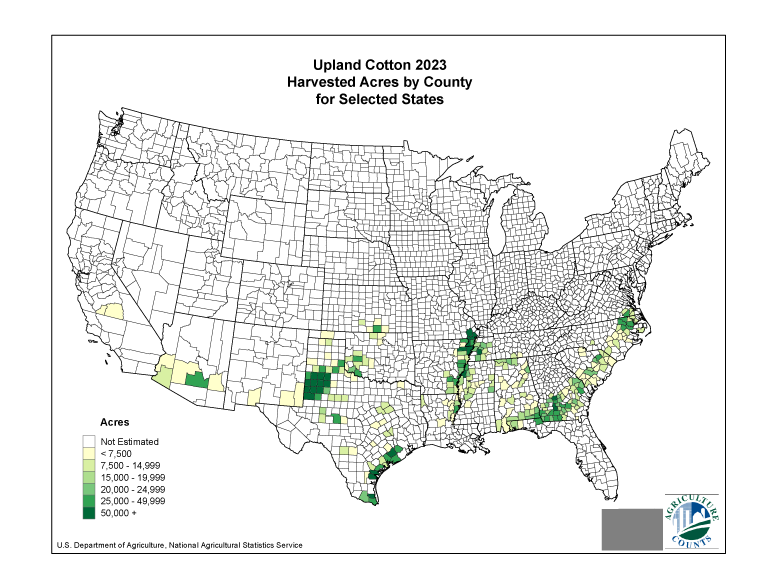
I'm not entirely sure why the panhandle of TX and far southeast/coastal cotton crop are doing so poorly. I counted 83% on the map above, so much of the other 17% must come from AZ and CA(where its mostly irrigated) as well as a few other states on the crop report at the top.
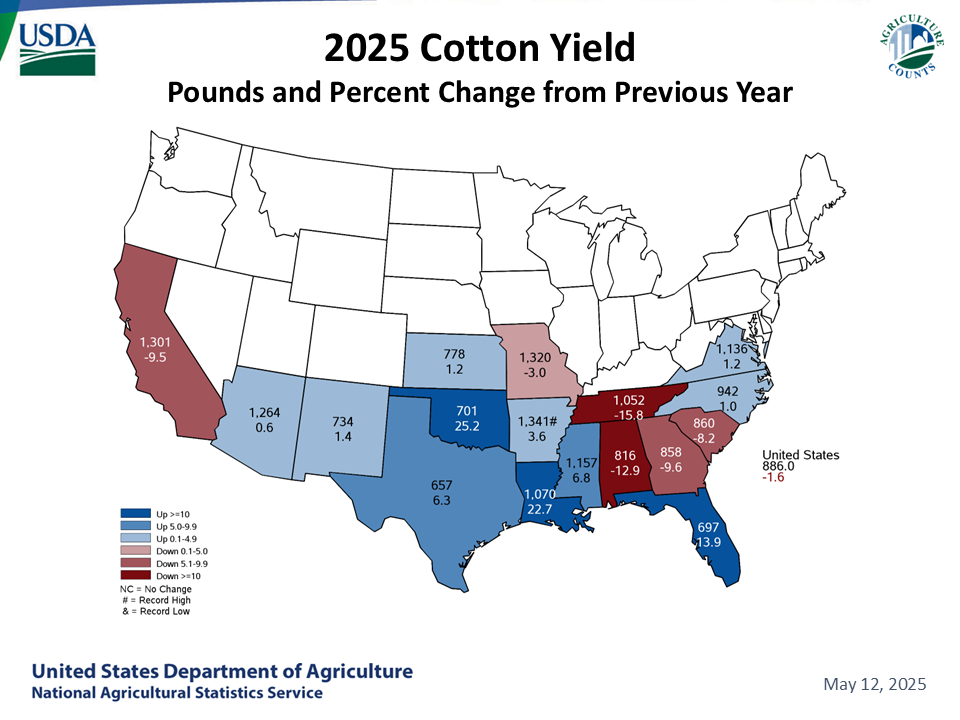
+++++++++++++++
https://www.nass.usda.gov/Charts_and_Maps/Field_Crops/cotnmap.php
+++++++++++++